Open Journal of Geology, 2013, 3, 71-76
doi:10.4236/ojg.2013.32B015 Published Online April 2013 (http://www.scirp.org/journal/ojg)
Evaluat io n o f Cav it y F or mation and the Use of Cut-off
Wall to Reduce the Risk of Washing Subsurface
Fine Material
Fouzan Alfouzan1, Muawia A Dafalla2, Akeel Alharbi3
1Assistant Research Professor, King Abdulaziz City for Science and Technology, KACST, Saudi Arabia
2Assistant Professor and Consultant, Civil Engineering, BRCES, King Saud University
3Scientific Researcher, King Abdulaziz City for Science and Technology, KACST, Saudi Arabia
Received 2013
ABSTRACT
This study shows the results of mapping numerous cavities and distress which appeared and detected in Qassim area,
Saudi Arabia. This phenomenon was observed near a school building and residential area and became a serious risk to
occupants and residents. The survey was carried out applying geotechnical techniques which included advancing rotary
boreholes to depths of 23 m to 30 m with sampling and testing. The evaluation process also included resistivity imaging
profiles using 2D electrical resistivity measurements. Results obtained from this research showed a thick top layer of
silty clayey sand soil rich of gypsum and carbonate presenting a hazardous and high-risk soil type. The percentage of
fines that are likely to be washed out as a result of chemical disintegration and exposure to significant hydraulic gradi-
ent was of great concern. Assessment was made using combined geotechnical and geophysical approach in addition to
chemical tests. Based on the data collected and analysis of test results a practical solution was suggested to solve this
problem. The use of “cut-off wall” in order to reduce the level of subsurface scour and cajuvity formation were found
appropriate. The depth of the cut off wall was determined based on the subsurface geological profile. Advantages of this
approach and concerns need to be considered in adopting typical solutions that are presented.
Keywords: Collapse; Cavities; Electrical Resistivity; Sarah Formation; Geotechnical Methods
1. Introduction
This study was conducted to investigate the cause of
cracks and subsoil collapse appeared recently at a resi-
dential area in Authal Center, Al Qassim Region, and
Central Saudi Arabia. The site investigation was con-
ducted for locations within close vicinity to coordinates
(N 26o 31' 17.8'' E 43o 41' 22.2"). See Figure 1.
Figure1. Study Area Map (after of [1]).
The area was reported to have unusual subsidence and
near surface cavities. The cause of these faults and col-
lapse was obviously not related to human activities and
expected to be a natural phenomenon. Investigation pro-
gram included geotechnical engineering and geological
assessment. In addition to these methods, a 2D geo-
physical resistivity imaging system was used. The fol-
lowing goals were planned to be achieved:
1) Evaluating of the thickness of surface soil layer.
2) Evaluating the subsurface geological features.
3) Evaluating depth of groundwater and surface water
if found.
4) Evaluating the seriousness of current collapse and
void formation hazards, at present and in future.
2D resistivity imaging system was used as to be one of
the most known systems at present time to give two dif-
ferent cross-sections in different directions in investi-
gated areas and environmental explorations. A geotech-
nical engineering study was conducted and both field and
laboratory works were carried out. Results obtained
through geophysical and geotechnical methods showed
that the entire problem is related to the nature of the near
Copyright © 2013 SciRes. OJG
F. ALFOUZAN ET AL.
72
surface soil layer. Loose spots of clayey sand were
formed due to the loss of fine material being washed
away. The subsurface soil was subjected to great hydrau-
lic head difference created by topography and rainfall.
When soils got wet and liquefied, interstitial pores in-
crease, hollow tiny voids and vugs develop into fissures,
cracks, big voids and then collapse by time (Figure 2).
Chemical disintegration of subsoil material can have a
significant role in cavity formation especially when cal-
cium and salts including carbonates and sulfates are pre-
sent.
Calcium carbonate (CaCO3) reacts with CO2 to form
soluble calcium bicarbonate; Ca(HCO3)2. This can cause
solid material to reduce and wash away with water.
This soluble compound is then washed away with the
rainwater. This form of weathering is called 'Carbona-
tion”.
Calcium oxide can react with basic oxides to give cal-
cium sulfites.
CaO + SO2 CaSO3
with oxidation of the CaSO3 gives CaSO4 or Ca
SO4·N(H2 O).
2. Geology Setting
Arabian Peninsula is formed of two main structures, the
first is the Arabian Shield, which covers nearly 40% of
the Arabian Peninsula in the West, and the second struc-
ture is the sedimentary formation which covers the re-
maining parts of the Kingdom, located dominantly to-
wards the East. The formation of the Arabian Shield con-
sists of solid basement rocks of [2] Proterozoic Eon
(Precambrian), which is overlain by rocks that return in
age to Paleozoic, Mesozoic and Cenozoic eras, forming
rocks of the sedimentary basin in the sedimentary cover.
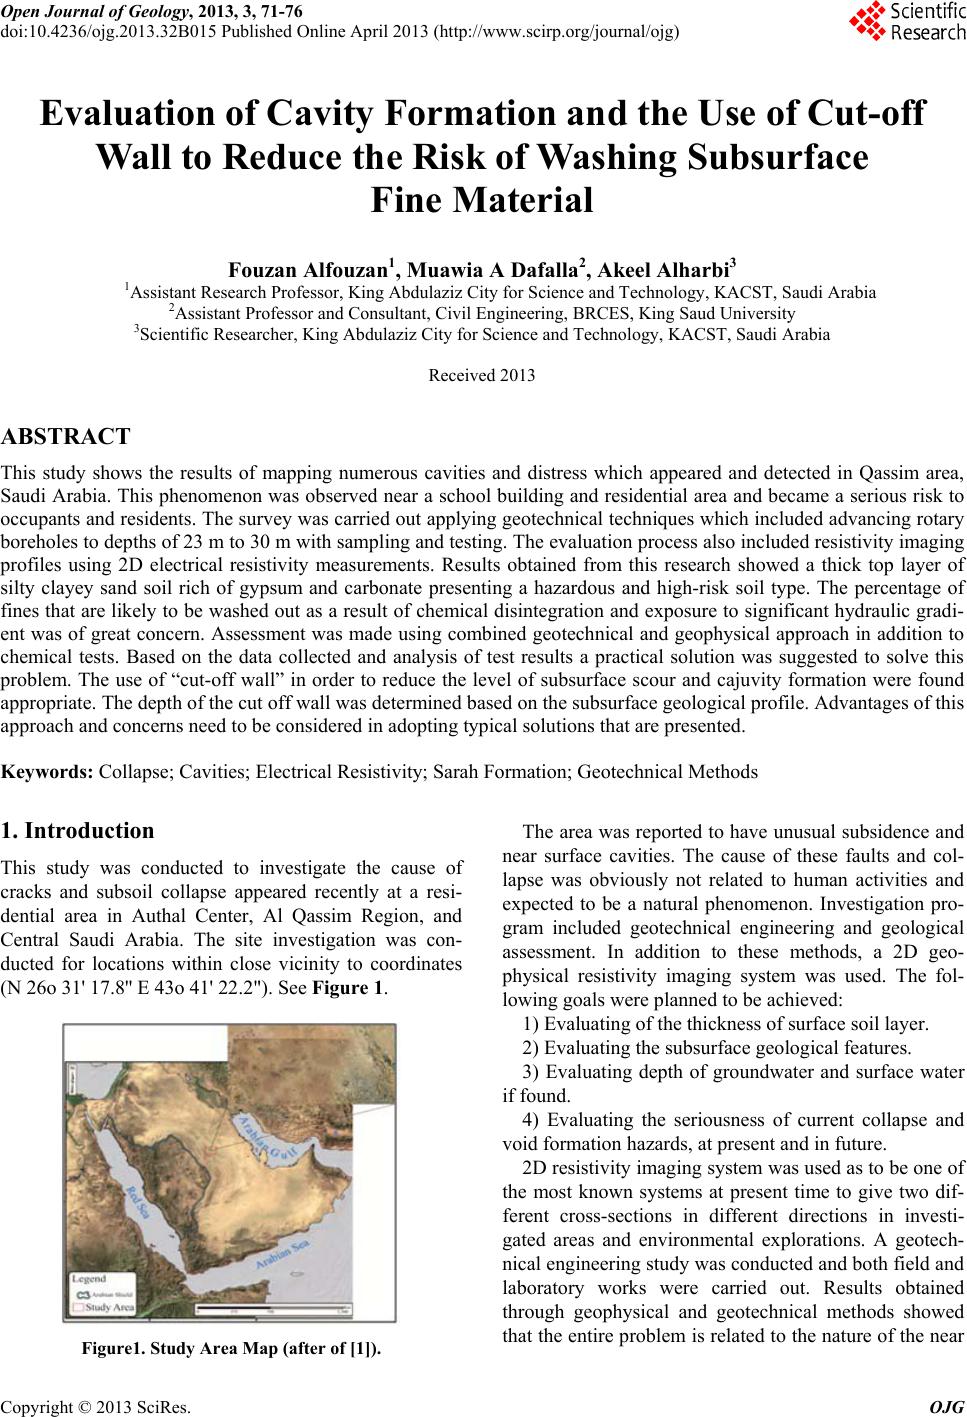
The study area lies on recent deposits of Quaternary
Period in age, directly above Sara Formation of Early
Silurian. Sara Formation is characterized and strongly
influenced by lifting tectonic movements. Sara Forma-
tion is formed of different constituents, which include the
two main components:
Figure 2. Typical sink hole close to ground surf ac e .
1) Shale and silt, exposed at Jabal Khanasir Sara in Al
Qassim Region.
2) Tillite sandstone, exposed at Jabal as Zarqa, east of
Hail. These rocks consist of heavy distribution of cross
bedding structures.
The local site geology of the study area indicated the
presence of Quaternary deposits of sand, clay and silt
followed by weakly cemented sandstone. The sandstone
cementation is improving with depth and getting sound
and intact beyond 10m below ground level.
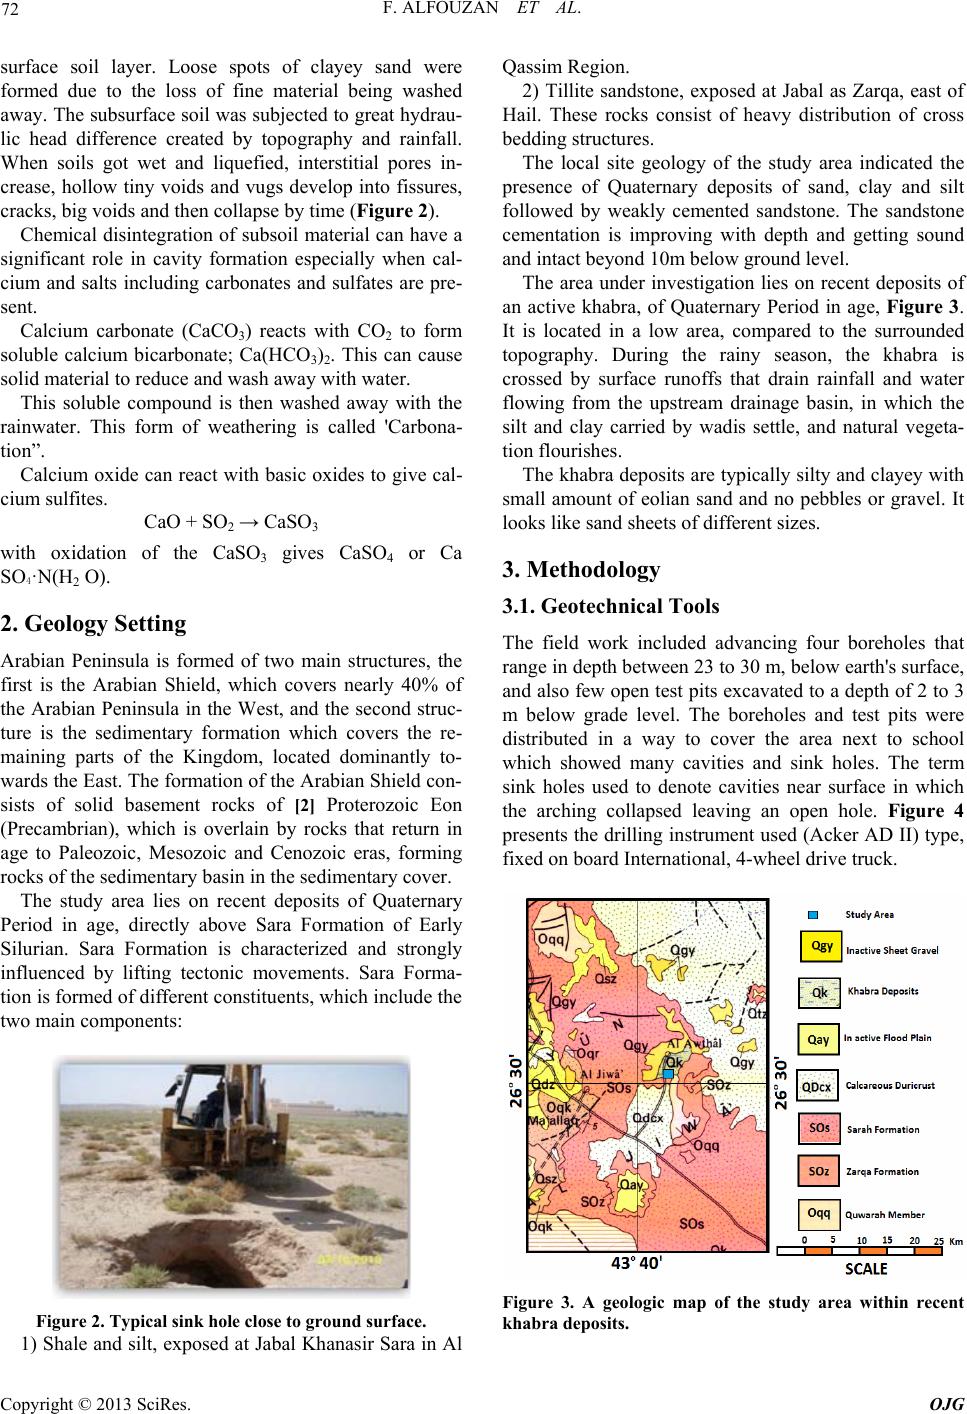
The area under investigation lies on recent deposits of
an active khabra, of Quaternary Period in age, Figure 3.
It is located in a low area, compared to the surrounded
topography. During the rainy season, the khabra is
crossed by surface runoffs that drain rainfall and water
flowing from the upstream drainage basin, in which the
silt and clay carried by wadis settle, and natural vegeta-
tion flourishes.
The khabra deposits are typically silty and clayey with
small amount of eolian sand and no pebbles or gravel. It
looks like sand sheets of different sizes.
3. Methodology
3.1. Geotechnical Tools
The field work included advancing four boreholes that
range in depth between 23 to 30 m, below earth's surface,
and also few open test pits excavated to a depth of 2 to 3
m below grade level. The boreholes and test pits were
distributed in a way to cover the area next to school
which showed many cavities and sink holes. The term
sink holes used to denote cavities near surface in which
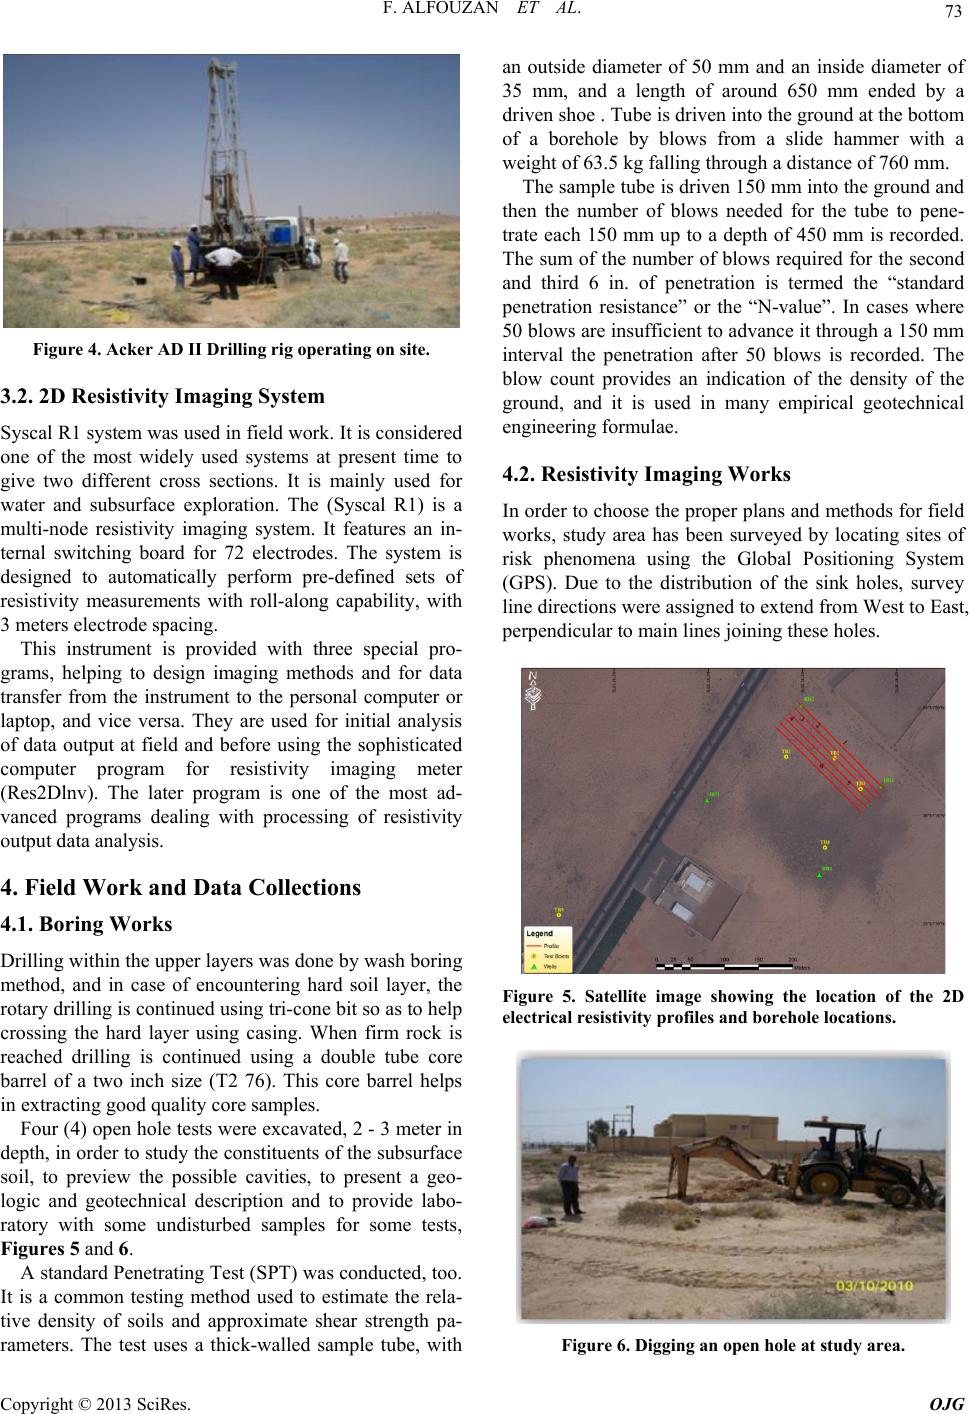
the arching collapsed leaving an open hole. Figure 4
presents the drilling instrument used (Acker AD II) type,
fixed on board International, 4-wheel drive truck.
Figure 3. A geologic map of the study area within recent
khabra deposits.
Copyright © 2013 SciRes. OJG
F. ALFOUZAN ET AL. 73
Figure 4. Acker AD II Drilling rig operating on site.
3.2. 2D Resistivity Imaging System
Syscal R1 system was used in field work. It is considered
one of the most widely used systems at present time to
give two different cross sections. It is mainly used for
water and subsurface exploration. The (Syscal R1) is a
multi-node resistivity imaging system. It features an in-
ternal switching board for 72 electrodes. The system is
designed to automatically perform pre-defined sets of
resistivity measurements with roll-along capability, with
3 meters electrode spacing.
This instrument is provided with three special pro-
grams, helping to design imaging methods and for data
transfer from the instrument to the personal computer or
laptop, and vice versa. They are used for initial analysis
of data output at field and before using the sophisticated
computer program for resistivity imaging meter
(Res2Dlnv). The later program is one of the most ad-
vanced programs dealing with processing of resistivity
output data analysis.
4. Field Work and Data Collections
4.1. Boring Works
Drilling within the upper layers was done by wash boring
method, and in case of encountering hard soil layer, the
rotary drilling is continued using tri-cone bit so as to help
crossing the hard layer using casing. When firm rock is
reached drilling is continued using a double tube core
barrel of a two inch size (T2 76). This core barrel helps
in extracting good quality core samples.
Four (4) open hole tests were excavated, 2 - 3 meter in
depth, in order to study the constituents of the subsurface
soil, to preview the possible cavities, to present a geo-
logic and geotechnical description and to provide labo-
ratory with some undisturbed samples for some tests,
Figures 5 and 6.
A standard Penetrating Test (SPT) was conducted, too.
It is a common testing method used to estimate the rela-
tive density of soils and approximate shear strength pa-
rameters. The test uses a thick-walled sample tube, with
an outside diameter of 50 mm and an inside diameter of
35 mm, and a length of around 650 mm ended by a
driven shoe . Tube is driven into the ground at the bottom
of a borehole by blows from a slide hammer with a
weight of 63.5 kg falling through a distance of 760 mm.
The sample tube is driven 150 mm into the ground and
then the number of blows needed for the tube to pene-
trate each 150 mm up to a depth of 450 mm is recorded.
The sum of the number of blows required for the second
and third 6 in. of penetration is termed the “standard
penetration resistance” or the “N-value”. In cases where
50 blows are insufficient to advance it through a 150 mm
interval the penetration after 50 blows is recorded. The
blow count provides an indication of the density of the
ground, and it is used in many empirical geotechnical
engineering formulae.
4.2. Resistivity Imaging Works
In order to choose the proper plans and methods for field
works, study area has been surveyed by locating sites of
risk phenomena using the Global Positioning System
(GPS). Due to the distribution of the sink holes, survey
line directions were assigned to extend from West to East,
perpendicular to main lines joining these holes.
Figure 5. Satellite image showing the location of the 2D
electrical resistivity profiles and borehole locations.
Figure 6. Digging an open hole at study area.
Copyright © 2013 SciRes. OJG
F. ALFOUZAN ET AL.
Copyright © 2013 SciRes. OJG
74
The electrical resistivity survey lines were designed to
be of 2 dimensions, with 177 m length and 3 m electrical
node spacing. 9 parallel electrical survey lines, with 9
meters spacing distance between each other’s, have been
conducted, and in a way that the first survey line extends
to the north of the site and the last one extends towards
the south as shown in figure (5). The 2D electrical resis-
tivity profile No. 2 shown in Figure 7 was selected to
extend along a direction that crosses boreholes No. 2 and
No. 3. Borehole No. 1 is situated 10 meters away from
the start point of this profile, and the distance between
the two wells is 157 meters.
vity was low and in the order of (5 ), in a vertical sec-
tion ranging from earth's surface to a depth of 6 meters.
This low resistivity is believed to be a result of loose
sand that is almost moist and wet. Then, the resistivity
increases between 7 meters depth to the bottom of profile
section, indicating more cohesive sandy layers. Evalua-
tion used the approaches and guides by [6].
These results match properly with those obtained in
the geotechnical engineering work. The nature of the
subsurface soil, according to what has been reported
from test borings, seems to be formed of extremely dense
sandy soil layers, with argillaceous, calcareous and gyp-
siferous cementation. The density of the sandy soil in-
creases with depth, and gradually, soil becomes sand-
stone. Photos of Scanning Electron microscope (SEM)
show presence of cements between the sand particles and
wide interstitial spaces between quartz grains filled by
the soluble gypsum (Figure 8). No groundwater has been
detected in the range of tested soil layers. However, the
soil layers might be water bearing ones in the pluvial
intervals, long time ago, as it lies in a low depression at
the foothill of nearby mountains. This study suggests that
the problem is related to the nature of soil layers, near to
earth’s surface, that when it rains, the layer goes into
loose sand liquefaction, sometimes called “running sand”,
causing more looseness for sand, and more widening of
interstitial spaces and forming vugs that extend gradually
into cracks and voids causing sudden collapses (Figure 9).
The choice of the two borehole locations being con-
nected with electrical section is to compare between the
two methods of investigation. This will enable a double
check and comparison between two different methods.
The electrical resistivity lines can give information on
layers to depths far greater than those obtained from the
boreholes. The test locations were selected in such a way
to cover the area of high risk near the school. Cavities
were scattered at different places within the site. The
works of [3], [4] and [5] provide a good guide for
evaluating the electrical resistivity of soils.
5. Results of Electrical Resistivity Imaging
and the Geotechnical Engineering
Results of electrical imaging tests showed that the resis-
Figure 7. Typical electrical resistivity profile.
A collapse potential test was carried out for samples extracted from the test pits in accordance with ASTM D
F. ALFOUZAN ET AL. 75
5333-9 [7]. The collapse Index measured at 300 kPa
stress was found 6.3% (Figure 10).
The chemical test results presented in Table 1 provide
good estimates of anions and cations. Percentage of
gypsum and carbonate content is significant.
ue to the chemical nature of the subsurface material
and the flow of water derived by significant hydraulic
gradient, it is decided to recommend some solution that
will reduce the risk to the existing school.
However, one of the solutions suggested based on de-
tailed field study, was to dig a trench with a depth rang-
ing between 2.5 - 3 meters, with a width of 60 - 80 cen-
timeters around the local building walls, filling it with
imbricated water proof insulator, then filling the empty
spaces by a low permeability soil, e.g. a mixture of sand
and bentonite or any appropriate clayey soil, that does
not contain gravels or angular grains that could cause a
damage to water proof layer. This method is known as
“cut-off wall”. It is effective in preventing hydraulic rush
of subsurface water that would cause soil washing and
pore space formation (Figure 11).
Figure 8. View of the expansive soil as seen in an SEM to
2000 magnifications.
Figure 9. Typical soil profile as obtained for borehole 3.
Figure 10. Collapse potential test profile.
Table 1. Chemical Tests for samples collected from TP 1, TP 2, TP 3 and TP 4.
Al Ca Fe Mg Si Na K Cl (*)Ca-CO3CaSO4·2H2OS SO4-2 NH4NO3
TP No.
%
1 1.6 19.6 0.5 1.1 34.4 9.6 1.9 0.20 13.7 7.8 1.5 4.5 5.0 0.6
2 1.7 22.2 0.8 1.5 21.3 6.5 0.8 0.33 2.3 7.7 1.5 4.6 5.0 2.2
3 4.4 13.0 2.3 1.6 27.6 3.2 0.6 0.37 2.1 8.0 1.6 4.7 3.9 1.1
4 6.6 21.4 3.7 2.0 25.6 2.7 0.5 0.41 0.8 7.7 1.5 4.6 4.5 1.1
*dissolved cl estimated from saturated clay paste.
Copyright © 2013 SciRes. OJG
F. ALFOUZAN ET AL.
76
Figure 11. Schematic diagram for the proposed cut-off wall.
6. Conclusion and Recommendation
This study investigated the cause of cavity formation
near surface and close to foundation level for a site of a
school building in central parts of Saudi Arabia.
It was found that the site was rich in soluble salts
which included gypsum and calcareous material. The site
was also subjected to surface and subsurface water flow
with a rather high hydraulic gradient. Comprehensive
study using geotechnical and geophysical methods in
addition to physical and chemical laboratory tests were
performed.
A practical solution was suggested to solve the prob-
lem of near surface cavity formation using “cut-off wall”
method. The trench with a depth of 2.5 - 3.0 meters, and
a width of 60 - 80 centimetres, around the outside school
walls filled up with a mixture of sand bentonite slurry is
expected to intercept flow of water and reduce the energy
of flow. The wall can be extended to a satisfactory depth
where no cavities were reported. The use of water proof
insulator or geotextile membrane can be used as a liner to
protect fine material from being washed away. Construc-
tion of the cut-off wall all around the school will provide
satisfactory protection. Rise and fall of ground water
under the school will not cause any serious problems as
the fines will be trapped at the bottom sandstone layer.
7. Acknowledgements
The authors would like to acknowledge and thank King
Abdulaziz City for Science and Technology for funding
this work. Thanks to extend to Eng. Mutaz Elamin and
the geophysical team of KACST for conducting some
activities related to this project.
REFERENCES
[1] H. Abdulrahman and Alghamdi, “An Investigation of the
Structural Framework beneath Riyadh City Using Gravity
and Aeromagnetic Evidence,” 2007, Unpublished thesis,
KSU, Riyadh.
[2] R. W. Powers, L. F. Ramirez, C. D. Redmond and E. L.
Elberg, “Geology of the Arabian Penisula. Sedimentary
Geology of Saudi Arabia,” US Geological Survey Profes-
sional Paper, 560-D, 1966, p. 147.
[3] Z. Abu-Hassanein, C. Benson and L. Blotz, “Electrical
Resisitivity of Compacted Clay,” Journal of Geotechnical
Engineering, Vol. 122, No. 5, 1996, pp. 397-406.
doi:10.1061/(ASCE)0733-9410(1996)122:5(397)
[4] R. J. Kalinski and W. E. Kelly, “Electrical-Resistivity
Measurement for Evaluation Compacted-Soil Lin-
ers.,”Journal of Geotechnical Engineering, Vol. 120, No.
2 1994, pp. 451-457.
doi:10.1061/(ASCE)0733-9410(1994)120:2(451)
[5] G. L. Yoona and J. B. Parkb, “Sensitivity of Leachate and
Fine Contents on Electrical Resistivity Variations of
Sandy Soils,” Journal of Hazardous Materials, Vol. 84,
No. 2-3, 2001, pp. 147-161.
[6] W. M. Telford, L. P. Geldart and R. E. Sheriff, Applied
Geophysics, second edition, Cambridge University Press,
1990. doi:10.1017/CBO9781139167932
[7] ASTM, American Standard Testing Methods, 2002,
ASTM D 2487and ASTM D 5333. Annual Book of
ASTM Standards, Vol. 04.08.
Copyright © 2013 SciRes. OJG