 Journal of Surface Engineered Materials and Advanced Technology, 2013, 3, 1-12 http://dx.doi.org/10.4236/jsemat.2013.34A1001 Published Online October 2013 (http://www.scirp.org/journal/jsemat) Copyright © 2013 SciRes. JSEMAT 1 Cross-Linked Alginate Film Pore Size Determination Using Atomic Force Microscopy and Validation Using Diffusivity Determinations* Cheryl Simpliciano1, Larissa Clark1, Behrokh Asi1, Nathan Chu1, Maria Mercado1, Steven Diaz1, Michel Goedert1#, Maryam Mobed-Miremadi1,2# 1Department of Biomedical, Chemical and Materials Engineering, San Jose State University, San Jose, USA; 2Department of Bioen- gineering, Santa Clara University, Santa Clara, USA. Email: #michel.goedert@sjsu.edu, #mmobedmiremadi@scu.edu Received July 4th, 2013; revised August 6th, 2013; accepted September 1st, 2013 Copyright © 2013 Cheryl Simpliciano et al. This is an open access article distributed under the Creative Commons Attribution Li- cense, which permits unrestricted use, distribution, and reproduction in any medium, provided the original work is properly cited. ABSTRACT The deficit of organ donors has fueled the need for advances in tissue engineering and regenerative medicine. Microen- capsulation in alginate immuno-isolation membranes has been used to treat many disabling metabolic disorders, namely, phenylketonuria, kidney failure and diabetes mellitus. Systematic nutrient flux determinations are hindered by the lack of experimental data on alginate-based membrane topography and the pore size thus preventing the full therapeutic po- tential of the bio-membranes to be reached. In this study, samples of cross-linked alginate membranes were subjected to the following analytical characterization: 1) pore size characterization using atomic force microscopy operated in con- tact mode to detect and measure pore size; 2) differential scanning calorimetry to confirm biopolymer cross-linking; and 3) diffusivity measurements using spectrophotometry and fluorescence microscopy to confirm the presence of through pores and to calculate reflection coefficients. The pore sizes for the pre-clinical standard formulation of 1.5% (w/v) me- dium viscosity alginate cross-linked with 1.5% CaCl2 and 0.5% (w/v) alginate and chitosan cross-linked with 20% CaCl2 are 5.2 nm ± 0.9 nm and 7.0 nm ± 3.1 nm, respectively. An increase in the glass transition temperatures as a function of cross-linker concentration was observed. Diffusivity values obtained from the inward diffusivity of creatinine into macrocapsules (d = 1000 µm ± 75 µm) and the outward diffusivity of FITC dextrans from macrocap- sules (d = 1000 µm ± 75 µm) and microcapsules (d = 40 µm ± 5 µm) were shown to correlate strongly (R2 = 0.9835) with the ratio of solute to pore sizes, confirming the presence of through pores. Reflection coefficients approaching and exceeding unity correlate with the lack of permeability of the membranes to MW markers that are 70 kDa and greater. Keywords: Alginate; Atomic Force Microscopy; Pore Size; Stokes’ Radius; Diffusivity; Cross-linking; Differential Scanning Calorimetry; Reflection Coefficient 1. Introduction Novel therapies resulting from regenerative medicine and tissue engineering technology may offer a new hope for patients with injuries, metabolic disorders, cancer, and end-stage organ failure. As an example, currently, pa- tients with diseased and injured organs are often treated with transplanted organs. However, there is a shortage of donor organs that is worsening yearly as the population ages and as the number of new cases of organ failure increases [1]. Bio-printing, including microencapsulation of cells, enzymes and drugs in biocompatible hydrogels, has been researched in an organ prototyping and meta- bolic disorders [2,3], stem cell encapsulation [4] and can- cer [5]. This use of hydrogels can be attributed to the ability of the hydrogel to form a biodegradable and bio- compatible encapsulation matrix once cross-linked [6]. The most common hydrogel biopolymer used in trans- plantation and cell therapy is alginate [2]. Alginate is a naturally-occurring, water-soluble poly- mer comprised of (1,4)-linked β-D-mannuronic (M) and (1,3)-α-L-guluronic (G) acid residues. Different varieties of alginate contain varying ratios of M and G. Depending *Declaration of interest: Authors have no declaration of interests to report. #Corresponding authors. 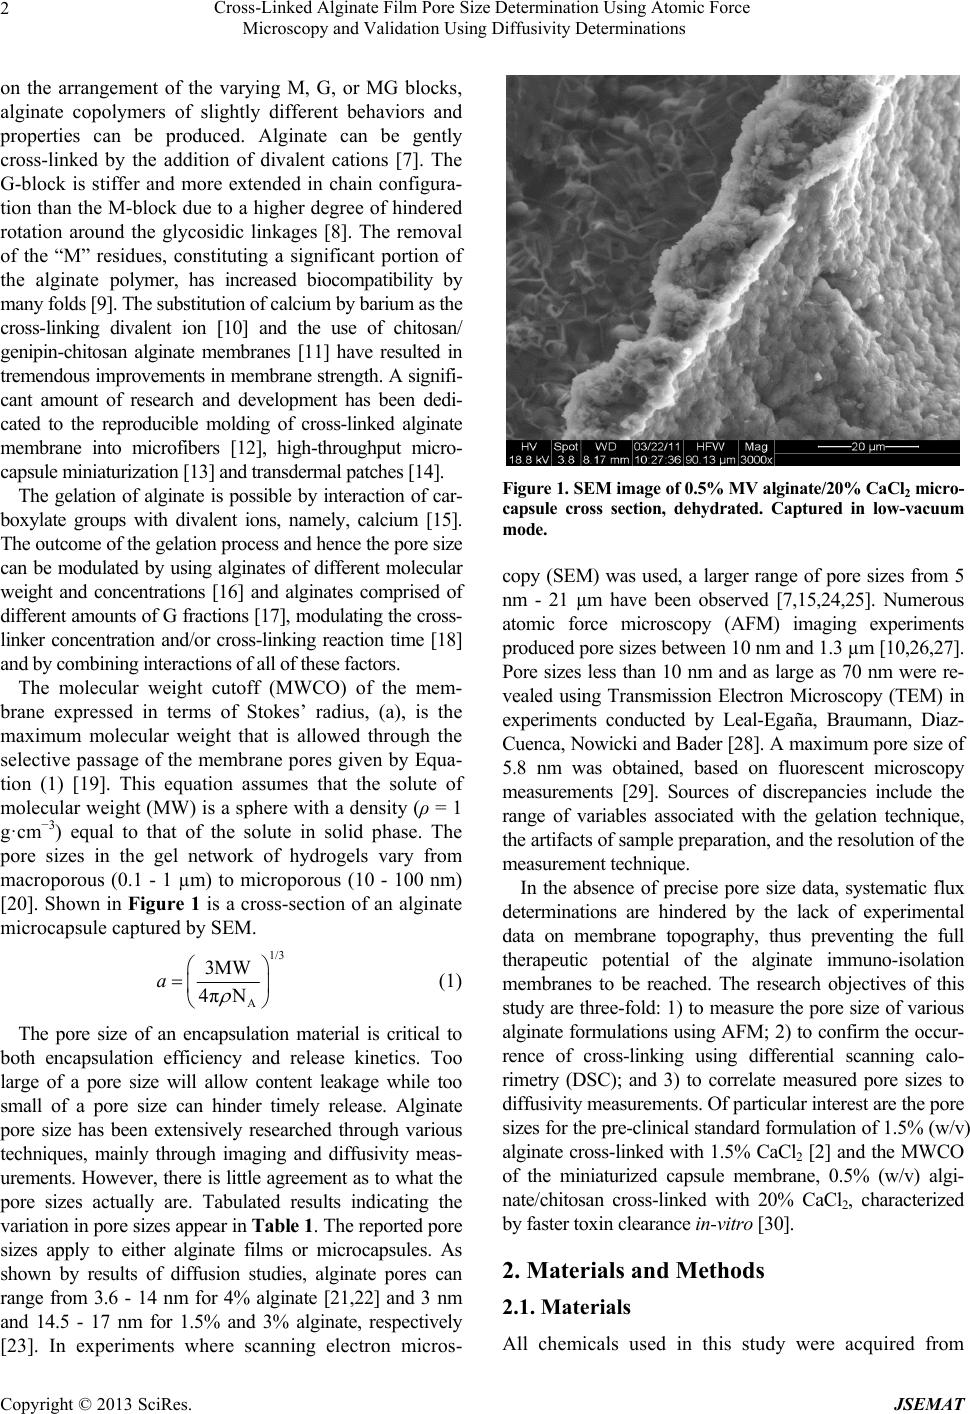 Cross-Linked Alginate Film Pore Size Determination Using Atomic Force Microscopy and Validation Using Diffusivity Determinations Copyright © 2013 SciRes. JSEMAT 2 on the arrangement of the varying M, G, or MG blocks, alginate copolymers of slightly different behaviors and properties can be produced. Alginate can be gently cross-linked by the addition of divalent cations [7]. The G-block is stiffer and more extended in chain configura- tion than the M-block due to a higher degree of hindered rotation around the glycosidic linkages [8]. The removal of the “M” residues, constituting a significant portion of the alginate polymer, has increased biocompatibility by many folds [9]. The substitution of calcium by barium as the cross-linking divalent ion [10] and the use of chitosan/ genipin-chitosan alginate membranes [11] have resulted in tremendous improvements in membrane strength. A signifi- cant amount of research and development has been dedi- cated to the reproducible molding of cross-linked alginate membrane into microfibers [12], high-throughput micro- capsule miniaturization [13] and transdermal patches [14]. The gelation of alginate is possible by interaction of car- boxylate groups with divalent ions, namely, calcium [15]. The outcome of the gelation process and hence the pore size can be modulated by using alginates of different molecular weight and concentrations [16] and alginates comprised of different amounts of G fractions [17], modulating the cross- linker concentration and/or cross-linking reaction time [18] and by combining interactions of all of these factors. The molecular weight cutoff (MWCO) of the mem- brane expressed in terms of Stokes’ radius, (a), is the maximum molecular weight that is allowed through the selective passage of the membrane pores given by Equa- tion (1) [19]. This equation assumes that the solute of molecular weight (MW) is a sphere with a density (ρ = 1 g·cm−3) equal to that of the solute in solid phase. The pore sizes in the gel network of hydrogels vary from macroporous (0.1 - 1 µm) to microporous (10 - 100 nm) [20]. Shown in Figure 1 is a cross-section of an alginate microcapsule captured by SEM. 1/3 A 3MW 4πN a (1) The pore size of an encapsulation material is critical to both encapsulation efficiency and release kinetics. Too large of a pore size will allow content leakage while too small of a pore size can hinder timely release. Alginate pore size has been extensively researched through various techniques, mainly through imaging and diffusivity meas- urements. However, there is little agreement as to what the pore sizes actually are. Tabulated results indicating the variation in pore sizes appear in Table 1 . The reported pore sizes apply to either alginate films or microcapsules. As shown by results of diffusion studies, alginate pores can range from 3.6 - 14 nm for 4% alginate [21,22] and 3 nm and 14.5 - 17 nm for 1.5% and 3% alginate, respectively [23]. In experiments where scanning electron micros- Figure 1. SEM image of 0.5 % MV a lgi nate/20 % CaCl2 micro- capsule cross section, dehydrated. Captured in low-vacuum mode. copy (SEM) was used, a larger range of pore sizes from 5 nm - 21 µm have been observed [7,15,24,25]. Numerous atomic force microscopy (AFM) imaging experiments produced pore sizes between 10 nm and 1.3 µm [10,26,27]. Pore sizes less than 10 nm and as large as 70 nm were re- vealed using Transmission Electron Microscopy (TEM) in experiments conducted by Leal-Egaña, Braumann, Diaz- Cuenca, Nowicki and Bader [28]. A maximum pore size of 5.8 nm was obtained, based on fluorescent microscopy measurements [29]. Sources of discrepancies include the range of variables associated with the gelation technique, the artifacts of sample preparation, and the resolution of the measurement technique. In the absence of precise pore size data, systematic flux determinations are hindered by the lack of experimental data on membrane topography, thus preventing the full therapeutic potential of the alginate immuno-isolation membranes to be reached. The research objectives of this study are three-fold: 1) to measure the pore size of various alginate formulations using AFM; 2) to confirm the occur- rence of cross-linking using differential scanning calo- rimetry (DSC); and 3) to correlate measured pore sizes to diffusivity measurements. Of particular interest are the pore sizes for the pre-clinical standard formulation of 1.5% (w/v) alginate cross-linked with 1.5% CaCl2 [2] and the MWCO of the miniaturized capsule membrane, 0.5% (w/v) algi- nate/chitosan cross-linked with 20% CaCl2, characterized by faster toxin clearance in-vit ro [30]. 2. Materials and Methods 2.1. Materials All chemicals used in this study were acquired from  Cross-Linked Alginate Film Pore Size Determination Using Atomic Force Microscopy and Validation Using Diffusivity Determinations Copyright © 2013 SciRes. JSEMAT 3 Table 1. Literature review of pore size for various analytical methods. Study Method Wet/Dry Imaging Conditions Membrane Morphology/Type Pore Size Wang, et al. [7] Cryo-SEM Dry Microcapsules (Calcium Chloride) 3.9 - 10.9 µm Zimmerman, et al. [10] AFM Wet Thick film (Barium Chloride) 1.2 - 1.3 µm Gombotz and Wee [15] SEM Dry Microcapsules (Calcium Chloride) 5 - 200 nm Choi, et al. [21] Diffusion Wet Microfluidic scaffold (Calcium Chloride) 3.6 nm Chan and Neufeld [22] Diffusion Wet Microcapsules (Calcium Chloride) 4 - 14 nm Li, et al. [23] Diffusion Wet Cylinders (Calcium Chloride) 14.5 - 17 nm Wright, et al. [24] SEM Dry Slabs (Calcium Chloride) 0.1 - 0.3 µm Jejurikar, et al. [25] Cryo-SEM Dry Low Viscosity Alginate Films (Calcium Chloride and Barium Chloride) 0.5 - 21 um Hsiong, et al. [26] AFM Dry Films (Calcium Chloride) 10 - 100 nm Schmid, et al. [27] AFM Wet Films (Calcium Chloride) 50 - 300 nm Leal-Egaña, et al. [28] TEM Microcapsules (Glutaraldehyde) 10 - 70 nm Mobed-Miremadi, et al. [29] Fluorescence Microscopy Wet Artificial Cells (Calcium Chloride) <5.8 nm Sigma-Aldrich (USA); these are: medium molecular weight (MV) sodium-alginate (A2033), low molecular weight (LV) sodium-alginate (A2158), low molecular weight chitosan (44 886–9, 75% deacetylated, 3.8–6 kDa) and fluorescein isothiocyanate dextran markers abbrevi- ated as FITC Dextran markers (46947, FD70S, FD4). All other reagent grade chemicals were provided by the Chemistry store in the Faculty of Sciences at San Jose State University: creatinine powder (MW = 113 Da) and bovine serum albumin (BSA, MW = 66.4 kDa). The tri- angular Pyrex-Nitride AFM probes (PNP-TR-20) were purchased from NanoWorld (Neuchâtel, Switzerland). Polylysine-coated slides were purchased from VWR (Radnor, PA) (cat# 16002-116). Cellulose Ester (CE) dialysis tubing with a molecular weight a cutoff (MWCO) of 20 kDa was puchased from Spectrum Labs (Spec- traPor # 131342, Rancho Dominguez, CA). 2.2. Methods It should be noted that it was not possible to use a single type of alginate structure for all analytical tests. While films were used for AFM and differential scanning calo- rimetry (DSC), spherical capsules were used for diffusiv- ity measurements. Due to the approximate average ratio of AFM scan area to capsule area (1:105), it has been assumed that the sphere curvature can be neglected and thus the pore sizes for the spherical and flat structures are nterchangeable for the same formulation. 2.3. Atomic Force Microscopy (AFM) 2.3.1. Sample Prepa ration AFM imaging was performed on spin-coated films pre- pared with various alginate and cross-linker concentra- tions and the dialysis tubing standard. Samples were cast as films for ease of imaging. 1 mL of alginate dissolved in saline (0.9% NaCl w/v) at a given concentration was deposited onto a poly-L-Lysine (PLL)-coated glass slide placed into a small petri dish. The dish was fixed to a homemade spin coater comprised of a CPU fan attached to a power supply shown in Figure 2. The alginate was allowed to spin for 15 s producing a film with a relatively homogenous thickness. Calcium chloride at a given con- centration was added to the film in a drop-wise fashion to induce cross-linking. The films were set to cross-link for 1 hr followed by a DI water rinse. The PLL-coated slide was then transferred directly onto the AFM platform for imaging. 2.3.2. Measurements Surface imaging was performed on the various alginate film formulations. The characterization was conducted using an Agilent 5500 AFM equipped with a contact- mode nose amplifier and 100 µm scanner N0524A (Agilent, Santa Clara, CA). Calibrations were performed using a TGZ02 standard (MikroMasch, Wilsonville, OR) and dialysis tubing with a MWCO of 20 kDa. The in- strument was operated in contact mode using a Pyrex- 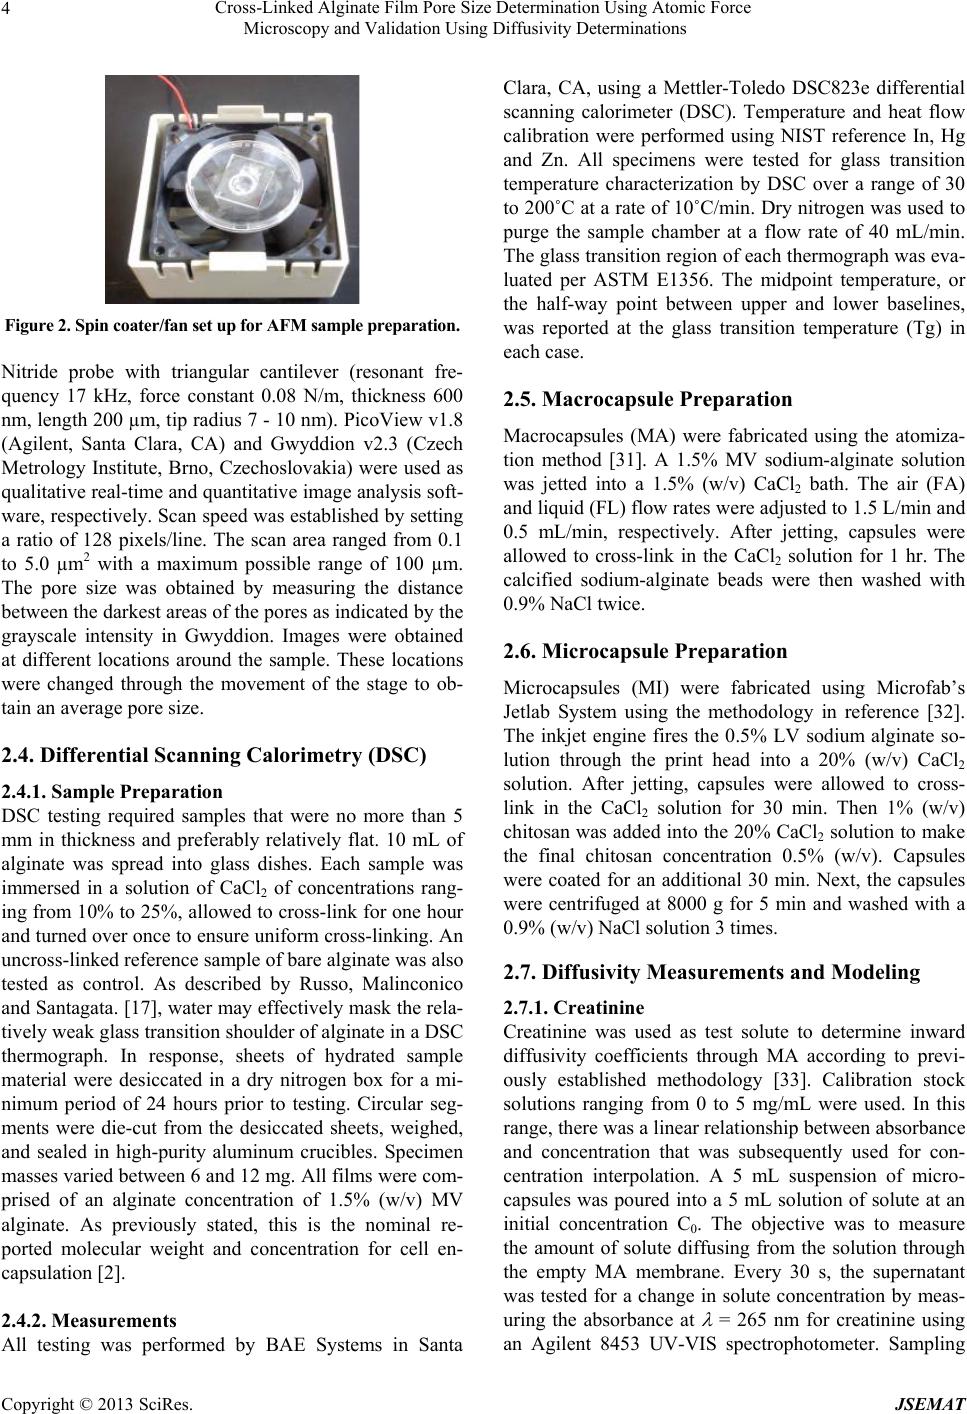 Cross-Linked Alginate Film Pore Size Determination Using Atomic Force Microscopy and Validation Using Diffusivity Determinations Copyright © 2013 SciRes. JSEMAT 4 Figure 2. Spin coater/fan s et up for AFM sample preparation . Nitride probe with triangular cantilever (resonant fre- quency 17 kHz, force constant 0.08 N/m, thickness 600 nm, length 200 µm, tip radius 7 - 10 nm). PicoView v1.8 (Agilent, Santa Clara, CA) and Gwyddion v2.3 (Czech Metrology Institute, Brno, Czechoslovakia) were used as qualitative real-time and quantitative image analysis soft- ware, respectively. Scan speed was established by setting a ratio of 128 pixels/line. The scan area ranged from 0.1 to 5.0 µm2 with a maximum possible range of 100 µm. The pore size was obtained by measuring the distance between the darkest areas of the pores as indicated by the grayscale intensity in Gwyddion. Images were obtained at different locations around the sample. These locations were changed through the movement of the stage to ob- tain an average pore size. 2.4. Differential Scanning Calorimetry (DSC) 2.4.1. Sample Prepa ration DSC testing required samples that were no more than 5 mm in thickness and preferably relatively flat. 10 mL of alginate was spread into glass dishes. Each sample was immersed in a solution of CaCl2 of concentrations rang- ing from 10% to 25%, allowed to cross-link for one hour and turned over once to ensure uniform cross-linking. An uncross-linked reference sample of bare alginate was also tested as control. As described by Russo, Malinconico and Santagata. [17], water may effectively mask the rela- tively weak glass transition shoulder of alginate in a DSC thermograph. In response, sheets of hydrated sample material were desiccated in a dry nitrogen box for a mi- nimum period of 24 hours prior to testing. Circular seg- ments were die-cut from the desiccated sheets, weighed, and sealed in high-purity aluminum crucibles. Specimen masses varied between 6 and 12 mg. All films were com- prised of an alginate concentration of 1.5% (w/v) MV alginate. As previously stated, this is the nominal re- ported molecular weight and concentration for cell en- capsulation [2]. 2.4.2. Measurements All testing was performed by BAE Systems in Santa Clara, CA, using a Mettler-Toledo DSC823e differential scanning calorimeter (DSC). Temperature and heat flow calibration were performed using NIST reference In, Hg and Zn. All specimens were tested for glass transition temperature characterization by DSC over a range of 30 to 200˚C at a rate of 10˚C/min. Dry nitrogen was used to purge the sample chamber at a flow rate of 40 mL/min. The glass transition region of each thermograph was eva- luated per ASTM E1356. The midpoint temperature, or the half-way point between upper and lower baselines, was reported at the glass transition temperature (Tg) in each case. 2.5. Macrocapsule Preparation Macrocapsules (MA) were fabricated using the atomiza- tion method [31]. A 1.5% MV sodium-alginate solution was jetted into a 1.5% (w/v) CaCl2 bath. The air (FA) and liquid (FL) flow rates were adjusted to 1.5 L/min and 0.5 mL/min, respectively. After jetting, capsules were allowed to cross-link in the CaCl2 solution for 1 hr. The calcified sodium-alginate beads were then washed with 0.9% NaCl twice. 2.6. Microcapsule Preparation Microcapsules (MI) were fabricated using Microfab’s Jetlab System using the methodology in reference [32]. The inkjet engine fires the 0.5% LV sodium alginate so- lution through the print head into a 20% (w/v) CaCl2 solution. After jetting, capsules were allowed to cross- link in the CaCl2 solution for 30 min. Then 1% (w/v) chitosan was added into the 20% CaCl2 solution to make the final chitosan concentration 0.5% (w/v). Capsules were coated for an additional 30 min. Next, the capsules were centrifuged at 8000 g for 5 min and washed with a 0.9% (w/v) NaCl solution 3 times. 2.7. Diffusivity Measurements and Modeling 2.7.1. Creatini n e Creatinine was used as test solute to determine inward diffusivity coefficients through MA according to previ- ously established methodology [33]. Calibration stock solutions ranging from 0 to 5 mg/mL were used. In this range, there was a linear relationship between absorbance and concentration that was subsequently used for con- centration interpolation. A 5 mL suspension of micro- capsules was poured into a 5 mL solution of solute at an initial concentration C0. The objective was to measure the amount of solute diffusing from the solution through the empty MA membrane. Every 30 s, the supernatant was tested for a change in solute concentration by meas- uring the absorbance at = 265 nm for creatinine using an Agilent 8453 UV-VIS spectrophotometer. Sampling  Cross-Linked Alginate Film Pore Size Determination Using Atomic Force Microscopy and Validation Using Diffusivity Determinations Copyright © 2013 SciRes. JSEMAT 5 stopped when no more absorbance/concentration changes were detected (dC/dt = 0). This concentration was taken as the equilibrium concentration (Ceq). 2.7.2. FIT C Dextrans FITC dextrans were used as test solutes to determine outward diffusivity coefficients through MA and MI ac- cording to previously established methodology [34]. Spec- trophotometric methods were not sensitive enough to de- tect transport across the MI membrane, therefore, fluo- rescence microscopy was used. Calibration stock solu- tions ranging from 0.1 to 15.1 mg/mL for each FITC- Dextran MW standard (4, 70, and 500 kDa dissolved in 0.9% (w/v) NaCl) were prepared. In this range, for each FITC-Dextran MW, there was a linear relationship be- tween intensity and the concentration of the fluorescent marker under observation, the results of which were subsequently used for concentration interpolation. 10 µL of MI or MA solution were incubated in 1 mL of FITC solution for 24 h prior to imaging. The solution was cen- trifuged at 8000 g for 5 min and washed once with a 0.9% (w/v) NaCl solution. Samples were then deposited onto a microscope slide and observed under the trans- mission microscope/camera (Nikon EclipseTi-S/Andor Technology Interline CCD camera). The FITC/Acridine Orange filter was chosen from the imaging software (NIS- Elements v.3.2.2) filter selection feature to accommodate the excitation and emission wavelengths of 468 and 520 nm of the FITC molecule. Images were captured every 30 s. Sampling stopped when no more intensity changes were detected (dI/dt = 0). This concentration was taken as the equilibrium concentration (Ceq). 2.7.3. Diffusivity Modelin g and Cal cul a tion of the Sieving Coefficient The analytical solution to Fick’s second law in spherical coordinates was used to determine diffusivity coeffi- cients from spectrophotometric and fluorescence meas- urements according to previously published methodology [29]. Residual sum of squares (RSS) minimization was conducted using MATLAB 2010a. The membrane re- flection coefficient ( ) was calculated using Equation (2), where is the ratio of the solute Stokes’ radius (α) and the average membrane pore size (r) [19]. 22 23 2 11 2110.163 3 (3) 3. Results 3.1. Atomic Force Microscopy As previously stated, AFM imaging was performed on spin-coated films prepared with varying concentrations of alginate and CaCl2 with and without a chitosan coating. Prior to imaging, the samples were slightly hydrated by a DI water rinse. AFM was chosen for imaging as it is an imaging method that provides nanometer resolution and three-dimensional surface imaging, requires minimal sample preparation and allows imaging in ambient and liquid conditions. In Figure 3, the apparent variation in pore size due to the increase in resolution is plotted as a function of scan area by film formulation. A decrease in average pore size is observed across all formulations with decreasing scan area. The calculated Stokes’ radius corresponding to a MWCO of 20 kDa for the standard dialysis tubing is 2.02 nm [19]. For an AFM scan area of 0.1 µm2, an average pore diameter of 4.9 nm was obtained for the standard sample. This value is the closest to the theoretical Stokes’ radius of 2.02 nm corresponding to a relative measure- ment error of 16.7%. Hence all subsequent analyses and comparisons will be conducted for the pore sizes ob- tained at this setting. Pore size measurements conducted using all scan areas are presented in Table 2. Shown in Figures 4-8 are the corresponding 2D views for multiple Figure 3. Variation in apparent pore size as a funct ion of sca n area. Figure 4. AFM images of 1.5% MV alginate and 1.5% CaCl2. Clockwise from top left: 2.5, 1.0, 0.5 and 0.15 µm2 scan area.  Cross-Linked Alginate Film Pore Size Determination Using Atomic Force Microscopy and Validation Using Diffusivity Determinations Copyright © 2013 SciRes. JSEMAT 6 Table 2. Effect of AFM scan area on apparent pore size. Sample CaCl2 % (w/v) Coating Pore Size Range (nm) at 0.5 µm2 Pore Size Range (nm) at 0.25 µm2 Pore Size Range (nm) at 0.15 µm2 Average Pore Size (nm) at 0.1 µm2 Alginate MV 0.5% (w/v) 1.5 N/A 11 - 23 7.0 - 16 5.0 - 11 8.4 ± 3.0 Alginate MV 1.0% (w/v) 1.5 N/A 26 - 44 9.0 - 16 7.0 - 15 4.5 ± 1.1 Alginate MV 1.5% (w/v) 1.5 N/A 13 - 35 12 - 28 6.0 - 10 5.2 ± 0.9 Alginate LV 0.5% (w/v) 20 N/A 6.0 - 19 6.0 - 12 4.0 - 18 7.2 ± 2.9 Alginate LV 0.5% (w/v) 20 Chitosan 17 - 24 7.0 - 19 5.0 - 11 7.0 ± 3.1 Dialysis Tubing N/A N/A 6.0 - 25 6.0 - 14 5.0 - 13 4.9 ± 3.0 Figure 5. AFM images of 0.5% LV alginate (left) and 0.5% LV alginate coated with chitosan (right): (top) Scan areas of 0.2 µm2 (left) and 0.15 µm2 (right); (middle) 0.25 µm2 (left) and 0.25 µm2 (right); (bottom): 1.0 µm2 (left) and 1.0 µm2 (right). scan areas and a 3D view for the 0.1 µm2 scan area for which the measured pore sizes are tabulated. For the purposes of comparing AFM images, the fol- lowing concentrations will be discussed: 1.5% MV/1.5% CaCl2, 0.5% LV/20% CaCl2, 0.5% LV/20% CaCl2 coated with 0.5% chitosan, and the dialysis membrane standard. Higher scan areas produced what appear to be surfaces with deep, indented features, as indicated by the darkest areas of the images. MV alginate (Figure 4) and coated LV alginate (Figure 5) appear to have more defined sur- face features, which are most likely attributed to tip- sample interaction due to the relative softness of the bare (a) (b) (c) Figure 6. AFM 3D (left) and 2D (right) views of (a) 1.5% MV alginate, 0.1 µm2 scan area; (b) 0.5% LV alginate, 0.1 µm2 scan area; and (c) 0.5% LV alginate coated with chito- san, 0.1 µm2 scan area. LV alginate. The layer of chitosan added to the LV algi- nate had some effect on film morphology. For example, chitosan-coated LV alginate displayed a structure with fewer features that were also of a smaller size than what was seen in the other films. This difference is due to the extra layer coating these features, effectively reducing the size of the pore openings. As previously mentioned, it was observed that de- creasing scan area also decreased the measured sizes of the pores. Since image resolution typically decreases as  Cross-Linked Alginate Film Pore Size Determination Using Atomic Force Microscopy and Validation Using Diffusivity Determinations Copyright © 2013 SciRes. JSEMAT 7 Figure 7. AFM images of dialysis tubing. Counterclockwise from top left: 5.0, 2.5, 1.5 and 0.15 µm2 scan area. Figure 8. AFM 3D view of dialysis tubing, 0.15 µm2 scan area. scan size approaches 0.1 µm2, this decrease in measured size appears counterintuitive. However, a decrease in scan area allows the ability to zoom into the deepest ar- eas of the image, which represents the smallest opening of the pores as seen in the 3D images in Figure 6. For AFM imaging of the dialysis tubing standard (Fig- ure 7), the standard appears to have tolerated the AFM tip as indicated by the greater resolution and lower in- stance of artifacts across the surface compared to the alginate images. A 3D image of the dialysis tubing at 0.1 µm2 provided further means of visual comparison be- tween a material of known porosity and the alginate po- rosity (Figure 8). The known porosity of the standard provided by the manufacturer lends feasibility to the use of the grayscale in estimating the pore size in the alginate material. 3.2. Differential Scanning Calorimetry Shown in Figure 9 are sample DSC thermograms with corresponding glass transition temperatures presented in Table 3. Shown in the thermogram of sodium alginate (Sample A) is endothermic decay at 112˚C due to re- moval of absorbed moisture (or nonstructural water). A Table 3. Effect of cross-linker concentration on transition temperature. Sample CaCl2 % (w/v) Coating Tg (˚C) A Alginate MV 1.5% (w/v)0 N/A 112.81 B Alginate MV 1.5% (w/v)10 N/A 115.44 C Alginate MV 1.5% (w/v)15 N/A 115.42 D Alginate MV 1.5% (w/v)20 N/A 124.57 E Alginate MV 1.5% (w/v)25 N/A 127.77 F Alginate MV 1.5% (w/v)20 Chitosan 123.16 G Alginate MV 1.5% (w/v)25 Chitosan 135.68 gradual increase in transition temperature and delayed endothermic shifts are observed with increasing CaCl2 concentration with an approximate step change of 9˚C between the 15% - 20% cross-linker concentration range (Samples C and D). Another marked increased is ob- served for sample G characterized by highest degree of cross-linking (25% (w/v) CaCl2) and chitosan coating. 3.3. Diffusivity Measurements Table 4 was generated by combining the results of diffu- sion experiments in MIs (d = 40 µm ± 5 µm) and MAs (d = 1000 µm ± 75 µm) and AFM measurements. As shown in Figure 10, solute diffusivity is inversely correlated to (R2 = 0.9835) and calculated in turn based on the AFM measurements. Assuming that the majority of pores are through pores, as the solute size approaches the pore size ( ≥ 1), the solute cannot be filtered through the mem- brane. Reflection coefficients equal to or exceeding unity in- dicate the lack of membrane permeability to the specific solute as reflected by the 103 - 104 fold reduction in dif- fusivity values as the marker MW was increased. 4. Discussion 4.1. Atomic Force Microscopy In terms of variability in pore measurement, the darkest areas using grayscale intensity were used to measure pore size. This method effectively used the smallest opening as the pore width. Although measurements of dialysis tubing AFM images using Gwyddion analysis tools yielded an average pore size of 4.9 nm, the actual pore size could not be definitively measured to less than 7 - 10 nm due to the manufacturer’s specification on the tip radius. However, based on consistently-measured dialy- sis tubing pores using grayscale intensity, the trend clearly indicated that the ability to resolve the pores in- creased with decreasing scan size. As the scan size de-  Cross-Linked Alginate Film Pore Size Determination Using Atomic Force Microscopy and Validation Using Diffusivity Determinations Copyright © 2013 SciRes. JSEMAT 8 Glass T rans ition Onset60. 19 °C Midpoint115.42 °C Left Limit52.04 °C Right Limit159.39 ° C Glas s T rans ition Ons et55.37 °C Midpoint112.81 ° C L e f t Limit48.63 ° C Right L imit144.05 ° C Glas s T rans ition Ons et85.75 °C Midpoint123.16 ° C L e f t Limit54.42 ° C Right L imit162.46 ° C Glass T rans ition Onset83. 77 °C Midpoint115.44 °C Left Limit56.81 °C Right Limit157.69 ° C Glass T rans ition Onset91. 47 °C Midpoint124.57 °C Left Limit62.69 °C Right Limit162.78 ° C Glas s T rans ition Onse t104.03 °C Midpoint127.70 ° C L e f t Limit62.69 ° C Right L imit162.78 ° C Glas s T rans ition Onse t114.60 °C Midpoint135.68 ° C L e f t Limit96.34 ° C Right L imit162.78 ° C Sam ple: [100807] DSC, B, 10% C a Cl2, 7 .5000 mg Sam ple: [100807] DSC, C, 15% Ca Cl2, 11.3200 mg Sam ple: [100807] DSC, D, 20% CaCl2, 7.28 00 mg Sam ple: [100807] DSC, A, Bare alginate , 8.9000 mg Sam ple: [100807] DSC, F, 20% CaCl2 w/ chitosa n, 6.180 0 m g Sample: [100807] DSC, E, 25% CaCl2, 11.8100 m g Sample: [100807] DSC, G, 25% Ca Cl2, w/ c hitosan, 11.8500 mg Wg^-1 2 °C20406080100 120 140 160 180 200220 240 260280 300 320340 360 380 Figure 9. DSC thermograms with corresponding glass transition temperatures. Table 4. Results of membrane diffusivity, pore size and reflection coefficient across different formulations and molecular weight markers. Membrane CaCl2 % (w/v) Coating Measurement Method MW Marker a (nm) r (nm) σ D (m2/s) Alginate MV 1.5% (w/v) 1.5 N/A Spectrophotometry Creatinine 0.36 2.6 0.4 7.20E−13 Alginate LV 0.5% (w/v) 20 Chitosan Fluorescence Microscopy FITC dextran 4 kDa1.18 3.5 0.4 7.70E−14 Alginate MV 1.5% (w/v) 1.5 N/A Fluorescence Microscopy FITC dextran 4 kDa1.18 2.6 0.5 1.81E−14 Alginate LV 0.5% (w/v) 20 Chitosan Fluorescence Microscopy FITC dextran 70 kDa3.07 3.5 1.0 3.02E−16 Alginate MV 1.5% (w/v) 1.5 N/A Fluorescence Microscopy FITC dextran 70 kDa3.07 2.6 1.0 5.95E−17 Alginate MV 1.5% (w/v) 1.5 N/A Fluorescence Microscopy FITC dextran 500 kDa5.92 2.6 2.6 0 Alginate LV 0.5% (w/v) 20 Chitosan Fluorescence Microscopy FITC dextran 500 kDa5.92 3.5 1.0 0 creased, the measured and calculated Stokes’ radius of the tubing began to converge, and these results lend con- fidence into this method of measurement. However, for the purposes of this study, the average pore size of 4.9 nm at a scan size of 0.1 µm2 is a relative measurement and requires further investigation with a tip of smaller radius or alternate imaging method. SEM facilities were available for this study; however, the equipment did not provide the desired resolution for pore measurements, with a limit of 100 nm on the given system. In addition, radiation generated by the SEM electron beam is known to cause cross-linking, which would have required further study in terms of potential effect on the alginate/CaCl2 porosity. Transmission elec- tron microscopy (TEM) has been used to image alginate in previous studies [26]; however sample preparation methods for both SEM and TEM include a number of fixing media including glutaraldehyde [10,26,35], the primary function of which is to provide structure by cross-linking biological materials prior to dehydration,  Cross-Linked Alginate Film Pore Size Determination Using Atomic Force Microscopy and Validation Using Diffusivity Determinations Copyright © 2013 SciRes. JSEMAT 9 Figure 10. Membrane diffusivity as a function of solute to membrane pore size. where changes to cross-linking in the alginate would not be desired. If fixation were not an issue with the alginate/ CaCl2, SEM and TEM samples would then be dehydrated after fixation using critical point drying [35] or lyophili- zation [36] and coated with a conductive coating or im- aged in low-vacuum SEM without a conductive coating; however, SEM images of samples prepared using these dehydration methods clearly indicate damage and shrink- age of the material [26] and are not a desired sample preparation method. Alcohol or acetone substitution could have been used with environmental SEM (ESEM) [35]; however, a cold stage was not available. A cold stage allows a hydrated sample to remain at the dew point in the SEM chamber. By varying the temperature or pressure in the chamber, the user can cause the sample to dehydrate in a controlled fashion so that some of the surface moisture sublimates but without completely dry- ing the surface, where with a wet surface, the SEM elec- tron beam would image the liquid instead of the sample surface. Lastly, scanning tunneling microscopy (STM) offers Ångström resolution; however, dehydration or fixing of the sample would have been required in order to apply a conductive coating on the sample for STM. Therefore, imaging in the native state using AFM with minimal sample preparation was preferable. Intermittent contact or tapping mode with the sample fully immersed in liquid generally reduces the likelihood of surface damage by the probe tip; however, in this study, intermittent contact mode did not provide the de- sired resolution. This problem may have been due to the stickiness of the sample interacting with the tip [26]. It was determined that the sample could be sufficiently imaged by AFM using contact mode with a low stiffness probe of 0.08 N/m to reduce damage to the surface. Other groups were found to have performed AFM imag- ing using a higher stiffness probe such as 0.12 N/m [27, 37]. In the case of the 0.5% LV alginate concentration, the initial samples were too soft for AFM imaging and required an increase in cross-linking concentration to stiffen the material. 4.2. Calorimetry Using ionotropic gelation by which all cross-linked sam- ples have been fabricated, at a given initial alginate con- centration, the degree of cross-linking can be varied by either modulating the CaCl2 concentration or modifying the G block content of the bio-polymer. The DSC analy- sis that was performed revealed that increasing the cross-linker concentration resulted in an increase in glass transition temperature (Tg). The increase in Tg can be attributed to the linking that could restrict the molecular response to temperature change as predicted by classical polymer theory [38]. As would be expected, higher CaCl2 concentrations have a more pronounced effect on free volume as an increase in CaCl2 ions provide more opportunities for creating tie points between polymer chains. Recent results of ther- mogravimetric (TGA) analysis on alginate films con- firmed the same trend [39]. It is known from the litera- ture that, there are three kinds of absorbed water in hy- drophilic polymers [40,41], free, freezing bound, and non-freezing bound. Whereas freezing bound water in- teracts weakly, non-freezing bound water forms hydro- gen bond to bind with the polymeric chain. As stated in the methodology section, since care was taken to remove the free water by desiccation, and alginate [42] and chi- tosan [43] decomposition occur at temperatures above 200˚C, it could be hypothesized that the shifts in transi- tion temperatures detected are due to the elimination of the freezing and non-freezing bound water. As for the increase in Tg, as a result of the chitosan coating at higher cross-linking concentrations, chitosan is classified as a stiff and rigid polyelectrolyte. Once adsorbed onto the bio-membrane, a more rigid and less fluid bio-membrane characterized by higher glass transition temperatures has been reported [44,45]. The results contradict findings of Russo, Malinconico and Santagata. In that study, an in- crease in the guluronic acid content of the alginate re- sulted in a decrease in glass transition temperatures measured by DSC. A higher G block content resulted in swelling and lower Tg for the cross-linked hydrogel. The authors hypothesize that, as expected, the cross-linking points represent a hindrance for the packing of chains; however, the chain segments between two consecutive cross-linking points experience an increased mobility because of the increase of the free volume due to swell- ing. 4.3. Diffusivity Measurements Whether using spectrophotometry or fluorescence mi- croscopy for diffusivity determination, experiments were  Cross-Linked Alginate Film Pore Size Determination Using Atomic Force Microscopy and Validation Using Diffusivity Determinations Copyright © 2013 SciRes. JSEMAT 10 designed to avoid the following interactions affecting pore size measurements: 1) the capsules had reached an equilibrium swollen state post-fabrication monitored by microscopy; 2) the MW markers chosen for the graph do not react with the pores; 3) the MW markers did not react with the membrane using electrostatic and hydrophobic interactions; 4) the solute was not present in excess at the membrane interface to generate concentration polariza- tion except for the 500 kDa marker to which the mem- brane is impermeable [46]; and 5) multiple sources place the 70 kDa marker at the MW cutoff of the membrane [33,46] so diffusion was not hindered for creatinine or the 4 kDa marker. Given these precautions and the diffu- sivity measurements, it could be hypothesized that a por- tion of the detected pores by AFM are through pores. 5. Conclusions The surface morphology of cross-linked alginate struc- tures was investigated through the use of DSC, AFM and diffusivity measurements using spectrophotometry and fluorescence microscopy. Through DSC measurements, successful cross-linking was established by correlating glass transition temperature and cross-linker concentra- tion. AFM experiments performed on alginate films yielded pore sizes for 1.5% CaCl2 and 0.5% (w/v) algi- nate/chitosan cross-linked with 20% CaCl2 to be 5.2 nm ± 0.9 nm and 7.0 nm ± 3.1 nm, respectively. Through measurements of inward diffusivity and outward diffu- sivity of MW marker, the presence of through pores in the alginate membrane was confirmed. Decreasing diffu- sivities and reflection coefficients approaching unity concur with previous findings that the molecular weight cutoff of the studied alginate bio-membranes is approxi- mately 70 kDa. Since it is difficult to confirm the accuracy of measur- ing pore sizes through the grayscale intensity method, the following improvements should be considered: 1) scan size should start at 0.1 µm2, and finer AFM probe tips should be investigated such as molecularly-functional- ized tips; 2) the number of pixels/line should be in- creased to improve resolution due to a slower scan rate; 3) the use of liquid imaging with tapping or intermittent contact mode should be re-evaluated, and a lower stiff- ness probe should be used to further reduce damage to the soft sample surface; and 4) high resolution field ef- fect SEM (FESEM) imaging [26] to the scale of 1 - 5 nm resolution [15] could be used in future work to quantify differences in pore size or shape between the microcap- sules and films if the material can be prepared for SEM without additional damage to the material from sample preparation. This further understanding of alginate morphology can potentially be helpful in determining how to fine-tune alginate pore sizes and to carefully regulate release ki- netics from alginate membranes. 6. Acknowledgements The authors would like to acknowledge the Davidson’s College of Engineering Faculty Development (“Inkjet Bioprinting”) and Junior Professorship Grants, the C- SUPERB Joint Venture Grant “Bio-Printing of Mam- malian Cells”, and the C-SUPERB Faculty-Student Col- laborative Research/New Investigator Grant Program “Encapsulated Hybrid P450 enzyme as novel light-driven biocatalyst” for funding this effort. Thermal characteri- zation of the samples could not have been executed without access to the DSC machine granted generously by BAE Systems, San Jose, CA. REFERENCES [1] T. R. Hoare and D. S. Kohane, “Hydrogels in Drug De- livery: Progress and Challenges,” Polymer, Vol. 49, No. 8, 2008, pp. 1993-2007. http://dx.doi.org/10.1016/j.polymer.2008.01.027 [2] T. M. S. Chang, “Artificial Cells: Biotechnology, Nano- medicine, Regenerative Medicine, Blood Substitutes, Bioencapsulation and Cell/Stem Cell Therapy—Vol. 1,” World Scientific Publishing Co. Pte. Ltd., Singapore City, 2007. [3] H. Li, “Smart Hydrogel Modelling,” Springer, Singapore City, 2009. http://dx.doi.org/10.1007/978-3-642-02368-2 [4] A. Paul, G. Chen, A Khan, V. T. Rao, D. Shum-Tim and S. Prakash, “Genipin-cross-linked Microencapsulated Hu- man Adipose Stem Cells Augment Transplant Retention Resulting in Attenuation of Chronically Infarcted Rat Heart Fibrosis and Cardiac Dysfunction,” Cell Trans- plantation, Vol. 21, No. 12, 2012, pp. 2735-2751. http://dx.doi.org/10.3727/096368912X637497 [5] M. Sridhar-Keralapura, S. Thirumalai and M. Mobed- Miremadi, “Structural Changes and Imaging Signatures of Acoustically Sensitive Microcapsules under Ultra- sound,” Ultrasonics, Vol. 53, No. 25, 2013, pp. 1044- 1057. http://dx.doi.org/10.1016/j.ultras.2013.02.001 [6] J. Zhu and R. E. Marchant, “Design Properties of Hy- drogel Tissue-engineering Scaffolds,” Expert Review of Medical Devices, Vol. 8, No. 5, 2011, pp. 607-626. http://dx.doi.org/10.1586/erd.11.27 [7] N. Wang, G. Adams, L. Buttery, F. H. Falcone and S. Stolnik, “Alginate Encapsulation Technology Supports Embryonic Stem Cell,” Journal of Biotechnology, Vol. 144, No. 4, 2009, pp. 304-312. http://dx.doi.org/10.1016/j.jbiotec.2009.08.008 [8] I. Braccini, R. P. Grasso and S. Pérez, “Conformational and Configurational Features of Acidic Polysaccharides and Their Interactions with Calcium Ions: A Molecular Modeling Investigation,” Carbohydrate Research, Vol. 317, No. 1, 1999, pp. 119-130. http://dx.doi.org/10.1016/S0008-6215(99)00062-2  Cross-Linked Alginate Film Pore Size Determination Using Atomic Force Microscopy and Validation Using Diffusivity Determinations Copyright © 2013 SciRes. JSEMAT 11 [9] H. Uludag, P. De Vos and P. A. Tresco, “Technology of Mammalian Cell Encapsulation,” Advanced Drug Deliv- ery Reviews, Vol. 42, No. 1, 2000, pp. 29-64. http://dx.doi.org/10.1016/S0169-409X(00)00053-3 [10] H. Zimmermann, F. Wählisch, C. Baier, N. Westhoff, R. Reuss, D. Zimmermann, M. Behringer, F. Ehrhart, A. Katsen-Globa, C. Giese, U. Marx, V. L. Sukhorukov, J. A. Vásquez, P. Jakob, S. G. Shirley and U. Zimmermann, “Physical and Biological Properties of Barium Cross- linked Alginate Membranes,” Biomaterials, Vol. 28, No. 7, 2006, pp. 1327-1345. http://dx.doi.org/10.1016/j.biomaterials.2006.11.032 [11] H. Chen, W. Ouyang, B. Lawuyi and S. Prakash, “Geni- pin Cross-Linked Alginate-Chitosan Microcapsules: Mem- brane Characterization and Optimization of Cross-Link- ing Reaction,” Biomacromolecules, Vol. 7, No. 7, 2006, pp. 2091-2098. http://dx.doi.org/10.1021/bm050862y [12] A. Tamayol, M. Akbari, N. Annabi, A. Paul, A. Kha- damhosseini and D. Juncker, “Fiber-Based Tissue Engi- neering: Progress, Challenges, and Opportunities,” Bio- technology Advances, Vol. 31, No. 5, 2012, pp. 669-687. http://dx.doi.org/10.1016/j.biotechadv.2012.11.007 [13] M. Mobed-Miremadi, “High Throughput Methods for Mi- niaturization of Implantable Artificial Cells,” In: T. M. S. Chan, Ed., Selected Topics in Nanomedicine: Regenera- tive Medicine, Artificial Cells and Nanomedicine—Vol. 3, World Scientific Publishing Co. Pte. Ltd., Singapore City, in Press. [14] Y. K. Demir, Z. Akan and O. Kerimoglu, “Sodium Algi- nate Microneedle Arrays Mediate the Transdermal Deliv- ery of Bovine Serum Albumin,” PLoS ONE, Vol. 8, No. 5, 2013, Article ID: e63819. http://dx.doi.org/10.1371/journal.pone.0063819 [15] W. R. Gombotz and S. Wee, “Protein Release from Algi- nate Matrices,” Advanced Drug Delivery Reviews, Vol. 31, No. 3, 1998, pp. 267-285. http://dx.doi.org/10.1016/S0169-409X(97)00124-5 [16] M. A. J. Mazumder, N. A. D. Burke, F. Shen, T. Chu, M. A. Potter and H. D. H. Stover, “Synthetic Reactive Polye- lectrolytes for Cell Encapsulation,” ACS Symposium Se- ries, Oxford University Press, Cary, 2010, pp. 131-159. http://dx.doi.org/10.1021/bk-2010-1053.ch007 [17] R. Russo, M. Malinconico and G. Santagata, “Effect of Cross-Linking with Calcium Ions on the Physical Proper- ties of Alginate Films,” Biomacromolecules, Vol. 8, No. 10, 2007, pp. 3193-3197. http://dx.doi.org/10.1021/bm700565h [18] S. Ahn, H. Lee, L. J. Bonassar and G. Kim, “Cells (MC3T3- E1)-Laden Alginate Scaffolds Fabricated by a Modified Solid-Freeform Fabrication Process Supplemented with an Aerosol Spraying,” Biomacromolecues, Vol. 13, No. 9, 2012, pp. 2997-3003. http://dx.doi.org/10.1021/bm3011352 [19] R. L. Fournier, “Basic Transport Phenomena in Biome- dical Engineering,” 3rd Edition, Taylor & Francis, Phila- delphia, 2011. [20] S. Amin, S. Rajabnezhad and K. Kohli, “Hydrogels as Potential Drug Delivery Systems,” Scientific Research and Essay, Vol. 3, No. 11, 2011, pp. 1175-1183. [21] N. W. Choi, M. Cabodi, B. Held, J. P. Gleghorn, L. J. Bonassar and A. D. Strook, “Microfluidic Scaffolds for Tissue Engineering,” Nature Materials, Vol. 6, No. 11, 2007, pp. 908-915. http://dx.doi.org/10.1038/nmat2022 [22] A. W. Chan and R. J. Neufeld, “Tuneable Semi-Synthetic Network Alginate for Absorptive Encapsulation and Con- trolled Release of Protein Therapeutics,” Biomaterials, Vol. 31, No. 34, 2010, pp. 9040-9047. http://dx.doi.org/10.1016/j.biomaterials.2010.07.111 [23] R. H. Li, D. H. Altreuter and F. T. Gentile, “Transport Characterization of Hydrogel Matrices for Cell Encap- sulation,” Biotechnology and Bioengineering, Vol. 50, No. 4, 1996, pp. 365-373. http://dx.doi.org/10.1002/(SICI)1097-0290(19960520)50: 4<365::AID-BIT3>3.0.CO;2-J [24] B. Wright, R. A. Cave, J. P. Cook, V. V. Khutoryansky, S. Mi, B. Chen, M. Leyland and C. J. Connon, “Enhanced Viability of Corneal Epithelial Cells for Efficient Trans- port/storage Using a Structurally Modified Calcium Algi- nate Hydrogel,” Regenerative Medicine, Vol. 7, No. 3, 2012, pp. 295-307. http://dx.doi.org/10.2217/rme.12.7 [25] A. Jejurikar, G. Lawrie, D. Martin and L. Grøndahl, “A Novel Strategy for Preparing Mechanically Robust Ioni- cally Cross-Linked Alginate Hydrogels,” Biomedical Ma- terials, Vol. 6., No. 2, 2011, Article ID: 025010. http://dx.doi.org/10.1088/1748-6041/6/2/025010 [26] S. X. Hsiong, P. H. Cooke, H. Kong, M. L. Fishman, M. Ericsson and D. J. Mooney, “AFM Imaging of RGD Pre- senting Synthetic Extracellular Matrix Using Gold Na- noparticles,” Macromolecular Bioscience, Vol. 8, No. 6, 2008, pp. 469-477. http://dx.doi.org/10.1002/mabi.200700313 [27] T. Schmid, J. Burkhard, B. Yeo, W. Zhang and R. Zenobi, “Towards Chemical Analysis of Nanostructures in Bio- films I: Imaging of Biological Nanostructures,” Analyti- cal and Bioanalytical Chemistry, Vol. 391, No. 5, pp 1899-1905. http://dx.doi.org/10.1007/s00216-008-2100-2 [28] A. Leal-Egaña, U. Braumann, A. Díaz-Cuenca, M. No- wicki and A. Bader, “Determination of Pore Size Distri- bution at the Cell-hydrogel Interface,” Journal of Nano- biotechnology, Vol. 9, No. 24, 2011, pp. 1-7. http://dx.doi.org/10.1186/1477-3155-9-24 [29] M. Mobed-Miremadi, B. Asi, J. Parasseril, E. Wong, M. Tat and Y. Shan, “Comparative Diffusivity Measurements for Alginate-Based Atomized and Inkjet-Bioprinted Arti- ficial Cells Using Fluorescence Microscopy,” Artificial Cells, Nanomedicine, and Biotechnology, Vol. 41 No. 3, 2013, pp. 196-201. http://dx.doi.org/10.3109/10731199.2012.716064 [30] M. Mobed-Miremadi and S. Dharba, “Immobilization of R. Erythropolis in Alginate-Based Artificial Cells for Simulated Plaque Degradation in Aqueous Media,” Tay- lor & Francis, Philadelphia. http://dx.doi.org/10.3109/02652048.2013.814726 [31] S. Prakash and T. M. S. Chang, “Preparation and In-Vitro  Cross-Linked Alginate Film Pore Size Determination Using Atomic Force Microscopy and Validation Using Diffusivity Determinations Copyright © 2013 SciRes. JSEMAT 12 Analysis of Genetically Engineered E. coli DH5 Cells Microencapsulated in Artificial Cells for Urea and Am- monia Removal,” Biotechnology and Bioengineering, Vol. 46, No. 6, 1995, pp. 621-626. http://dx.doi.org/10.1002/bit.260460615 [32] M. Mobed-Miremadi, E. Acks, S. Polsaward and D. Chen, “High Throughput Miniaturization of Artificial Cells,” Artificial Cells, Nanomedicine, and Biotechnology, Vol. 39, No. 5, 2011, pp. 310-316. http://dx.doi.org/10.3109/10731199.2011.574637 [33] M. F. A. Goosen, “Fundamentals of Animal Cell: Encap- sulation and Immobilization,” CRC Press, Boca Raton, 1993. [34] Y. Shan, “Viability of Microencapsulation of E. coli DH5 for Urea Removal Using Inkjet Bio-Printing,” Masters Project Report, San Jose State University, San Jose, 2011. http://generalengineering.sjsu.edu/docs/pdf/mse_prj_rpts/ fall2011/VIABILITY_OF_MICROENCAPSULATION_ OF_E.COLI_DH5_FOR_UREA.pdf [35] L. Muscariello, F. Rosso, G. Marino, A. Giordano, M. Barbarisi, G. Cafiero and A. Barbarisi, “A Critical Over- view of ESEM Applications in the Biological Field,” Journal of Cellular Physiology, Vol. 205, No. 3, 2005, pp. 328-334. http://dx.doi.org/10.1002/jcp.20444 [36] M. Rubert, M. Monjo, S. P. Lyngstadaas and J. M. Ramis, “Effect of Alginate Hydrogel Containing Polyproline- Rich Peptides on Osteoblast Differentiation,” Biomedical Materials, Vol. 7, No. 5, 2012, Article ID: 055003. http://dx.doi.org/10.1088/1748-6041/7/5/055003 [37] Z. Keresztes, T. Rigo, J. Telegdi and E. Kalman, “Inves- tigation of Biopolymer Networks by Means of AFM,” Applied Physics A, Materials Science & Processing, Vol. 72, Suppl. 1, 2001, pp. S113-S116. http://dx.doi.org/10.1007/s003390100680 [38] S. K. H. Gulrez, S. Al-Assaf and G. O. Phillips, “Hy- drogels: Methods of Preparation, Characterisation and Appliation,” In: A. Carpi, Ed., Progress in Molecular and Environmental Bioengineering—From Analysis and Mo- deling to Technology Applications, Intech Europe, Croatia, 2011, pp. 117-150. http://www.intechopen.com/books/progress-in-molecular and-environmental-bioengineering-from-analysis-and-mo delng-to-technology-applications/hydrogels-methods-of-p reparation-characterisation-and-applications [39] V. Urquiza, K. Turner, O. Perales Pérez and M. Gálvez Saldaña, “Effect of the Cross-Linking with Calcium Ions on the Structural and Thermo-Mechanical Properties of Alginate Films,” MRS Proceedings, Vol. 1355, No. 1, Cambridge University Press, Cambridge, 2011. http://dx.doi.org/10.1557/opl.2011.1136 [40] S. J. Kim, S. G. Yoon and S. I. Kim, “Synthesis and Cha- racteristics of Interpenetrating Polymer Network Hydro- gels Composed of Alginate and Poly (Diallydimethyl- ammonium Chloride),” Journal of Applied Polymer Sci- ence, Vol. 91, No. 6, 2004, pp. 3705-3709. http://dx.doi.org/10.1002/app.13615 [41] K. Nakamura, T. Hatakeyama and H. Hatakeyama, “Rela- tionship between Hydrogen Bonding and Bound Water in Polyhydroxystyrene Derivatives,” Polymer, Vol. 24, No. 7, 1983, pp. 871-876. http://dx.doi.org/10.1016/0032-3861(83)90206-9 [42] T. S. Pathak, J. H. Yun, J. Lee and K. J. Paeng, “Effect of Calcium Ion (Cross-Linker) Concentration on Porosity, Sur- face Morphology and Thermal Behavior of Calcium Algi- nates Prepared from Algae (Undaria pinnatifida),” Car- bohydrate Polymers, Vol. 81, No. 3, 2010, pp. 633-639. http://dx.doi.org/10.1016/j.carbpol.2010.03.025 [43] S. Shabbear, S. Ramanamurthy and K. V. Ramanamurthy, “Formulation and Evaluation of Chitosan Sodium Algi- nate Microcapsules of 5-Fluorouracil for Colorectal Can- cer,” International Journal of Research in Pharmacy and Chemistry, Vol. 2, No. 1, 2012, pp. 7-19. http://dx.doi.org/10.1186/2194-0517-2-1 [44] S. J. Florczyk, D. J. Kim, D. L. Wood and M. Zhang, “Influence of Processing Parameters on Pore Structure of 3D Porous Chitosan-Alginate Polyelectrolyte Complex Scaffolds,” Journal of Biomedical Materials Research Part A, Vol. 98, No. 4, 2011, pp. 614-620. http://dx.doi.org/10.1002/jbm.a.33153 [45] J. Shaji, V. Jain and S. Lodha, “Chitosan: A Novel Phar- maceutical Excipient,” International Journal of Pharma- ceutical Excipient and Applied Sciences, Vol. 1, No. 1, 2010, pp. 11-28. [46] S. Prakash and C. Martoni, “Toward a New Generation of Therapeutics,” Applied Biochemistry and Biotechnology, Vol. 128, No. 1, 2006, pp. 1-22. http://dx.doi.org/10.1385/ABAB:128:1:001
|