Open Journal of Geology, 2013, 3, 7-12
doi:10.4236/ojg.2013.32B002 Published Online April 2013 (http://www.scir p.org/journal/ojg)
Copyright © 2013 SciRes. OJG
Integration of Seismic Refraction and 2D Electrical
Resistivity in Locating Geological Contact
Nisa’ Ali, Ro sl i Saad, M. M. Nordiana
Geophysics Sectio n, School of Physics, Universit i Sain s Malaysia, Pen ang, Malaysia
Email: nisa_ali_89@yahoo.com
Received 2013
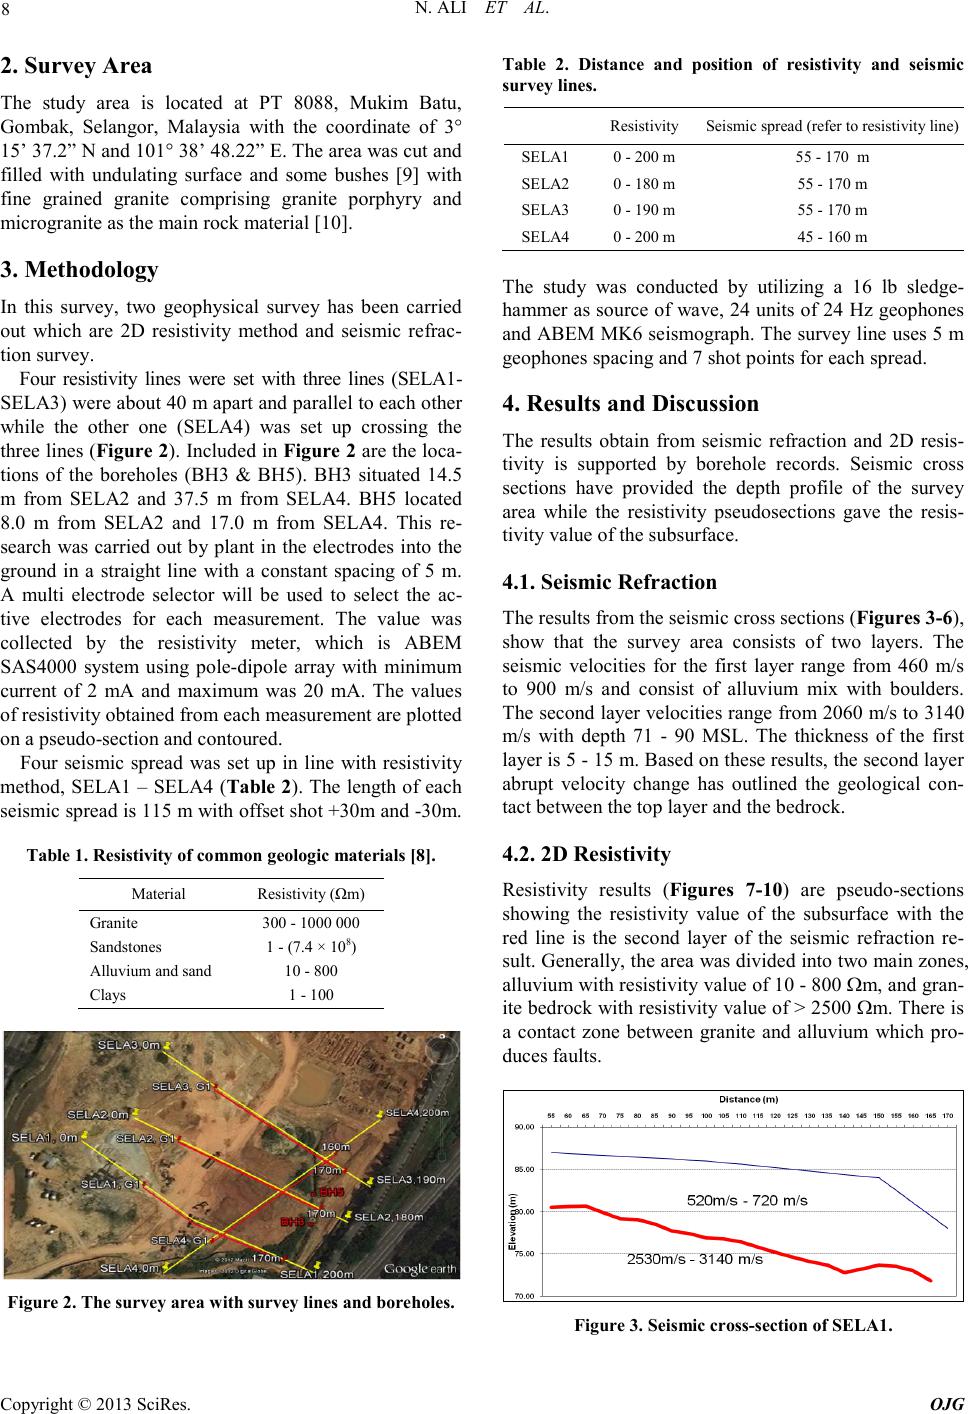
ABSTRACT
The aim of this research is to locate the geological contact for engineering purpose appl ying seismic refraction and 2D
electrical re sistivity method. Resistivit y and seismic re fraction method was conducted on four survey lines with 3 lines
runni ng from NW to SE whic h about pa rallel t o each ot her and 40 m apa rt while the fourth li ne was run ning fro m SW
to NE. The 2D resistivity survey used minimum electrode spacing of 5 m and the survey used pole-dipole array with
mini mum c urr ent was 2 mA a nd maxi mum was 2 0 mA. The seismic refraction survey used 5 m geophone spacing with
offset shot was + 30 m and - 30 m. Resistivity results generally show the area was divided into two main zones, allu-
vium wit h resisti vity value of 10 - 800 ohm-m, and granite bedro ck with resistivi ty value of > 2500 o hm-m. There is a
geological contact between granite and alluvium. The seismic results show the area consists of two layers. The first
layer (top layer) with velocity of 460 - 900 m/s which was alluvium mixed wit h b oulders. The second layer wit h veloc-
ity of 2060 - 3140 m/s with depth 71 - 90 MSL. The thickness of the overburden is 5 - 15 m.
Keywords: Geological Contact; 2D Elec tr ic a l Resistivit y; Seismic Re fra c tion
1. Introduction
A geological contact is a boundary between two units
that is identified on t he basi s o f a co mpositio nal, text ural,
structural, or temporal difference between units [1]. The
ways in whic h rock bodies fit together are deduced from
geologic mapping, supplemented wherever possible by
drilling and geophysical data [2].
The 2D electrical resistivity method is most suitable
for interpreting geological structures in subsurface while
seismic method is valuable for mapping depth of bedrock
and fracture zones but fail to indicate the depth or dip
direction of the zone as 2D resistivity method could [3].
Thus, integration of seismic refraction and 2D electrical
resistivity met hod will give useful a nd better information
on delineating contact and faults for engineering purpose.
The refraction seismic method depends on seismic ray
paths being bent at velocity discontinuities. A compres-
sional wave that impinges on a boundary separating two
media with different acoustic impedances is partially
reflected and partially refracted into the lower medium
[4]. Measurements of travel-time as a function of range
can be transformed into a graph of velocity as a function
of depth. Velocity boundaries usually coincide with geo-
logical boundaries and a cross-section on which velocity
interfaces are plotted may therefore resemble the geo-
logical cross-section, although the two are not necessari-
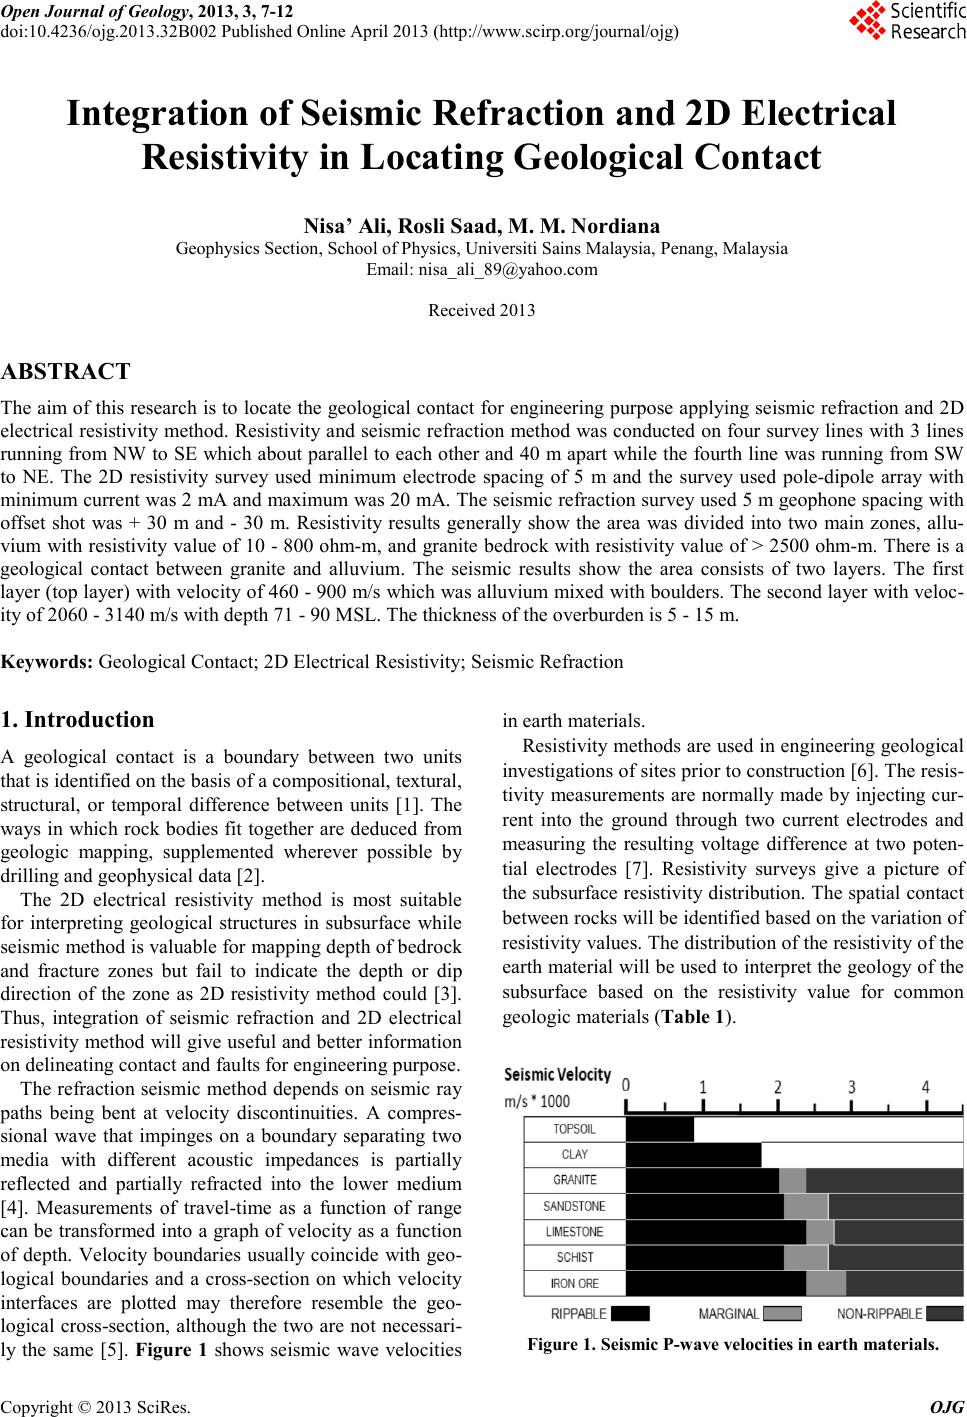
ly the same [5]. Figure 1 shows seismic wave velocities
in earth materials.
Resistivity methods are used in engineering geological
investigatio ns o f sites pr ior to co nstructio n [6]. The resis-
tivity measurements are normally made b y injecting cur-
rent into the ground through two current electrodes and
measuring the resulting voltage difference at two poten-
tial electrodes [7]. Resistivity surveys give a picture of
the subsurface resistivity distrib ution. The spatial contact
between rocks will be identified based on the variation of
resi stivi ty va lues . The d istribu tion of the re sistivit y o f the
earth material will be used to interpret the geolog y of the
subsurface based on the resistivity value for common
geologic mater ia ls ( Tabl e 1).
Figure 1 . Seismic P-wave velocities in earth materials.