Paper Menu >>
Journal Menu >>
 Applied Mathematics, 2011, 2, 131-140 doi:10.4236/am.2011.21015 Published Online January 2011 (http://www.SciRP.org/journal/am) Copyright © 2011 SciRes. AM Mathematical Modeling and Analysis of Tumor Therapy with Oncolytic Virus Manju Agarwal, Archana S. Bhadauria Department of Mathematics and Astronomy, Lucknow University, Lucknow, India E-mail: manjuak@yahoo.com, archanasingh93@yahoo.co.in Received October 1, 2010; revised December 2, 2010; accepted November 5, 2010 Abstract In this paper, we have proposed and analyzed a nonlinear mathematical model for the study of interaction between tumor cells and oncolytic viruses. The model is analyzed using stability theory of differential equa- tions. Positive equilibrium points of the system are investigated and their stability analysis is carried out. Moreover, the numerical simulation of the proposed model is also performed by using fourth order Runge- Kutta method which supports the theoretical findings. It is found that both infected and uninfected tumor cells and hence tumor load can be eliminated with time, and complete recovery is possible because of virus therapy, if certain conditions are satisfied. It is further found that the system appears to exhibit periodic limit cycles and chaotic attractors for some ranges of the system parameters. Keywords: Tumor, Oncolytic Virus, Limit Cycles, Chaotic Behavior, Attractors, Asymptotic Stability 1. Introduction A connection between cancer and viruses has long been theorized and case reports of cancer regression (cervical cancer, Burkitt lymphoma, Hodgkin lymphoma) after immunization or infection with an unrelated virus ap- peared at the beginn ing of the 20th cen tury [1 ]. Efforts to treat cancer through immunization or deliberate infection with a virus began in the mid 20th century [1,2]. As the technology for creating a custom virus did not exist, all early efforts focused on finding natural oncolytic viruses. During the 1960s, promising research involved in using poliovirus [3], adenovirus [1], Coxsackie virus [4], and others [2]. The early complications were occasional cas- es of uncontrolled infection, resulting in significant mor- bidity and mortality; the very frequent development of an immune response, while harmless to the patient [1], de- stroyed the virus and thus prevented it from destroying the cancer [3]. In a number of cases, cancer cells exposed to viruses have experienced widespread necrosis, which cannot be entirely accounted for by viral replication alone. Cytotoxic T-cell responses directed against virus- infected cells have been identified as an important factor in tumor necrosis. However, since viruses are normal human pathogens, they induce an immune response, which reduces the effectiveness of viruses. For example, increased antibody could deactivate viruses before the tumor has been destroyed. This can be overcome by us- ing parental viruses that are not normal human pathogens, thereby avoiding any pre-existing immunity. However, this does not avoid subsequent antibody generation. Al- ternatively, the viral vector can be coated with a polymer such as po lyethylene glycol, sh ielding it from antib odies, but this also preven ts viral coat proteins adhering to host cells. Deactivation of the immune syste m is not desirable, since it has a positive effect on tumor necrosis. Even when a response was seen, these responses were neither complete nor durable [1]. With the later development of advanced genetic engi- neering techniques, researchers gained the ability to de- liberately modify existing viruses, or to create new ones. All modern research on oncolytic viruses involves vi- ruses that have been modified to be less susceptible to immune suppression, to more specifically target particu- lar classes of cancer cells, or to express desired cancer- suppressing genes. The first Oncolytic virus to be ap- proved by a regulatory agency was a genetically modi- fied adenovirus named H101 by Shanghai Sunway Bio- tech. It gained re gulatory approval in 2005 fro m China’s State Food and Drug Administration (SFDA) for the treatment of head and neck cancer [5,6 ]. Sunway’s H101 and the very similar Onyx-15 have been engineered to remove a viral defense mechanism that interacts with a  M. AGARWAL ET AL. Copyright © 2011 SciRes. AM 132 normal human gene p53, which is very frequently dere- gulated in cancer cells [6]. Onyx-015 is a adenovirus th at was developed in 1987 with the function of the E1B gene knocked out, meaning cells infected with Onyx-015 are incapable of blocking p53’s function. If Onyx-015 in- fects a normal cell, with a functioning p53 gene, it will be prevented from multiplying by the action of the p53 transcription factor. However if Onyx-015 infects a p53 deficient cell it should be able to survive and replicate, resulting in selective destruction of cancer cells [7,8]. The interaction between the growing tumor and the replicating oncolytic virus are highly complex and non- linear. Thus to precisely define the conditions that are required for successful therapy by this approach, mathe- matical models are needed. Several mathematical models that describe the evolution of tumors under viral injection were recently developed [9-11]. Other mathematical mo- dels for tumor-virus dynamics are, mainly, spatially ex- plicit models, described by systems of partial differen- tial equations (which is an obvious and necessary ex- tension of ordinary differential equations models in as much as most solid tumors have distinct spatial structure), the local dynamics is usually modeled by systems of or- dinary differential equations that bear close resemb- lance to a basic model of virus dynamics [12]. Wu et al. modeled and compared the evolution of a tumor under different initial cond itions [13]. Friedman and Tao (2003) presented a rigorous mathematical analysis of somewhat different model [14]. Our model builds upon the model of Artem S. Novozhilov [9] with a modified functional response between the cells. Novozhilov presented a ma- thematical model that describes the interaction between two types of tumor cells (the cells that are not infected but are susceptible so far as they have the cancer pheno- type) with ratio dependent functional response between them. We consider a more realistic type of functional re- sponse with saturation effect of virus–cell interaction as even when a virus is oncolytic and it punches a hole in a tumor, the immune respon se of the ind ividu al to the viru s occurs so fast that the effects are quickly wiped out and the tumor continues to grow. We discuss the linear sta- bility analysis of the biologically feasible equilibrium states of this model. The ranges of the system parameters for which the system has chaotic behavior is found. Some authors discussed the problem of chaos and stabil- ity analysis of some biological models such as cancer and tumor model, genital herpes epid emic, stochastic lat- tice gas prey–predator model and many other models, see, for example, [15-19]. The problem of optimal control of the unstable equilibrium states of cancer self-remission and tumor system using a feedback control approach is studied by Sarkar and Banerjee and El-Gohary [15,19]. The objective of present work is to study the interaction between growing tumor and the replicating Oncolytic virus with a functional response with saturation effect. The saturation effect accounts for the fact that the num ber of contacts an individual cell reaches some maxi- mal value as our immune system evolves to stop virus just as the virus evolves to enter cells and replicate. Our model exhibits that complete elimination of tumor is possible with the help of oncolytic virus therapy in the treatment of tumor. This paper is organized as follows: In Section 2, we outline our model. In Section 3, Boundedness of solu- tions of the system is studied. Section 4, gives a review of equilibrium points of the system. Sections 5, deals with stability analysis of equilib rium points. In Section 6, we have determined conditions for global stability of in- terior equilibrium point. It is further followed by nume- rical simulation in Section 7. Lastly, a short discussion is represented in Secti on 8. 2. Mathematical Model The model considers two types of tumor cells x and y growing in logistic fashion. x is the size of the un- infected tumor cell population andyis the size of in- fected tumor cell population. It is assumed that onco lytic viruses enter tumor cells and replicate. These tu mor cells, infected with oncolytic viruses, fu rther cause infection in other tumor cells. Oncolytic virus preferentially infects and lysis cancer cells both by direct destruction of the tumor cells, and, if modified, as vectors enabling genes expressing anticancer proteins to be delivered specifically to the tumor site. Based on these assumption model tak es the following form: 1 2 1, 1, dxx ybxy rx dtKxy a dyx ybxy ry y dtKxy a (2.1) With initial conditions: 0 00xx and 0y 00y. Here 1 r and 2 r are the maximum per capita growth rates of uninfected and infected cells correspondingly; K is the carrying capacity , b is the transmission rate (this parameter also includes the replication rate of the viruses) ; The expression by x ya, displays a satura- tion effect accounting for the fact that the number of contacts an individual cell reaches some maximal value as our immune system evolves to stop virus just as the viruses evolve to enter cells and replicate. a is the measure of the immune response of the individual to the viruses which prevents it from destroying the cancer and is the rate of infected cell killing by the viruses (cy-  M. AGARWAL ET AL. Copyright © 2011 SciRes. AM 133 totoxicity). All the parameters of the model are supposed to be nonnegative. 3. Boundedness of Solutions Boundedness may be interpreted as a natural restriction to grow because of limited resources. To establish the biological validity of the model system, we have to show that the solutions of system (2.1) are bounded for this we find the region of attraction in the following lemma. Lemma 1.: All the solutions of (2.1) starting in the positive orthant 2 0 R either approaches, enter or re- main in the subset of 2 0 R defined by 2 0 ,:0 x yR xyK where 2 0 R denote the non-negative cone of 2 R in- cluding its lower dimensional faces. Proof: From system (1) we get: 12 1xy x tyt rxryy K 1 x y xtytx yK where 12 max ,rr then by usual comparison theorem, we get the following expression as ,t limsup t x tytK Thus, it suffices to consider solution s in the region . Solutions of the initial valu e problem starting in and defined by (2.1) exist and are unique on a maximal in- terval [20]. Since solutions remain bounded in the posi- tively invariant region , the maximal interval is well posed both mathematically and epidemiologically. 4. Existence and Uniqueness of Equilibrium Points An equilibrium point is a point at which variables of a system remain unchanged over time. System (2.1) pos- sesses the following equ ilibria: 00,0E, 1,0EK , 20,Ey and 3,Exy , where 2 2 K yr r and 22 2 4 2 MM rN yfx r where 22 2 2MxrarKr and 2 222 2 .Nrxxr aKrKbKar Existence of 00,0E. The existence of trivial equi- librium point 00,0Eis obv iou s. This eq uilibriu m point implies the complete elimination of tumor. Biologically, it means that both infected and uninfected tumor cells can be eliminated with time, and complete recovery is possible because of the virus therapy. Existence of 1,0EK . The existence of equilibrium point 1,0EK is obvious. This equilibrium implies the failure of virus therapy. Biologically, it means that both infected and uninfected tumor cells tend to the same state, as they would have been reached without virus admini- stration. Existence of 20,Ey. It can be checked out that the equilibrium point 20,Ey exists if 2 r . This equi- librium implies complete infection of tumor cells and stabilization of tumor load to a finite minimal size y 2 2 . Kr r Biologically, it gives a real life situation in which tumor load can be reduced to lower size if tumor is detected at initial stage. Existence of 3,Exy . To see the existence of in- terior equilibrium point 3,Exy we note that , x y are positive solutions of the system of alge- braic equations given below: 110 xy by rKxya (4.1) 210 xy bx rKxya (4.2) Now substituting the value of y in Equation (4.1), we get 10rK xfxxfxaKbfx (4.3) To show existence of x , it suffices to show that Eq- uation (4.3) has a unique positive solution. Taking 1 GxrKxf xxf xaKbf x We note that 1 00000GrKf faKbf provided 12 2 0 and 0.rrb r (4.4) or 12 1 rr b (4.5) and 10GKfK rKfKabK provided . bK K a (4.6)  M. AGARWAL ET AL. Copyright © 2011 SciRes. AM 134 Thus, there exist a x in the interval 0 x K such that 0Gx For x to be unique, we must have 1122 0, dG rfxxfxaKKbfx dx (4.7) Corresponding value of y is given by yfx . Thus if all the three conditions (4.5)-(4.7) hold an uni- que interior equilibrium always exists. However, these conditions depend upon the parameter values so they do not always hold. We will show further that if Equation (4.5) and Equation (4.6) does not hold other equilibrium points of the system become locally asymptotically sta- ble. 5. Local Stability Analysis of Equilibrium Points An equilibrium point is locally asymptotically stable if all solutions of the system approaches it as t. To discuss the local stability of equilibrium points we com- pute the variational matrix of system (2.1). The signs of the real parts of the eigenvalues of the variational matrix evaluated at a given equilibria determine its stability. The entries of general variational matrix are given by differ- entiating the right hand side of system (2.1) with respect to , x y. The matrix is given by A B VE CD where 1 12 1rx x ybybxy Ar KKxya x ya 12 rx bx bxy BKxya x ya 22 ry by bxy CKxya x ya 2 22 1ry x ybxbxy Dr KKxya xya We denote the variational matrix corresponding to i E by i VE , 0,1,2,3i 5.1. Local Stability Analysis of 00,0E To explore local stability o f trivial equilibrium point, we compute variational matrix of 0 E. The variational ma- trix of equilibrium point 0 E is given by 1 02 0 0 r VE r (5.1) Eigenvalues of 0 VE are given by,r 2.r 0 E is an unstable equilibrium point since both the ei- genvalues of the matrix are positive. 5.2. Local Stability Analysis of 1,0EK Now, to study the stability behavior of 1 E, we compute the variational matrix 1 VE corresponding to 1 E as follows: 11 10 bK rr K a VE bK Ka (5.2) From Equation (5.2) we observe that eigenvalues of the matrix 1 VE are given by 1 r and bK Ka . Thus, 1 VE has negative eigenvalues and 1 E is stable equilibrium point if bK K a , con- sequently 1 E is a saddle point if bK K a . Biological interpretation: Inequality bK K a im- plies that equilibrium point 1 E is locally asymptotically stable if death rate of infected cells due to the virus at- tack is larger than the rate of transmission of infection from virus to the uninfected cells if measure of the im- mune response of the individual to the viruses is very less as compared to carrying capacity of the cells. Stabil- ity of this equilibrium point suggests that infected cells would die without having time to infect other cells and tumor grows unaffectedly. Remark: 1 E is stable if interior equilibrium point does not exist . 5.3. Local Stability Analysis of 20, E y The variational matrix of equilibrium point 20,Ey where 2 2 K yr r is given by 2 1 22 2 2 2 22 22 0 bK r r rKr ar MbK r rr Kr ar (5.3)  M. AGARWAL ET AL. Copyright © 2011 SciRes. AM 135 From Equation (5.3) we observe that eigenvalues of the matrix 1 VE are given by 2 1 222 bK r r rKr ar and 2.r Thus 2 VE has negative eigenvalues and 2 E is stable equilibrium point if 2 1 22 2 bK r r rKr ar or 221 12 Kr abrr rr consequently 2 E is a saddle point if 221 12 Kr abrr rr . Biological interpretation: Local asymptotic stability of 2 E implies that 21 br r , Since a is a positive parameter and it cannot be less than a negative quantity, so 2 E is locally asymptotically stable point if 21 rr b together with 21 r or 21 max 1 rr ,b . Hence 2 E is locally asymptotically stable under any of the two situa- tions: 1) If net growth rate of uninfected cells is less than the rate of transmission of virus infection than growth rate of infected cells must be greater than the death rate of in- fected cells caused by the viruses. 2) If net growth rate of uninfected cells is more than the rate of transmission of virus infection then the ratio of net growth rate of uninfected cells to the death rate of infected cells caused by the v iruses is more than the ratio of net growth rate of uninfected cells to rate at which they become infective. Remark: 2 E is stable if interior equilibrium point does not exist . 5.4. Local Stability Analysis of , 3 E xy Variational matrix of 3,Exy is given by 3 A B VE CD (5.4) where 1 1 2 1 rx xy by Ar KK x ya bx y xya 12 rx bxbx y BKxya x ya 22 ry bybx y CKxya x ya 2 2 2 1 ry xy bx Dr KK x ya bx y xya From variational matrix 3 VE , we find that eigen- values are where 12 22 12 12 3 2 14 2 rx ry K bx yrr rx ryab x y KxyaK xya The signs of the real parts of and are nega- tive. This implies that 3 E is always locally asymptoti- cally stable if it exists. 6. Global Stability of Interior Equilibrium Point An equilibrium point is globally asymptotically stable if system always approaches it regard less of its initial posi- tion. We construct Lyapunov functions that enable us to find biologically realistic conditions sufficient to ensure existence and uniqueness of a globally asymptotically stable equilibrium state. Global stability of the interior equilibrium point of system (2.1) is determined in the theorem 6 given below: Theorem 6.: If the following inequality holds 2 12 4 by axy a rr by bx KK axy aKaxya then 3 E is globally asymptotically stable with respect to the solutions initiating in the interior of the positive orthant . Proof: Consider the following positive definite func- tion abou t 3 E ln ln x y Wxxxyy y x y . Computing the derivative of W with respect to t and after some algebraic manipulations, we get 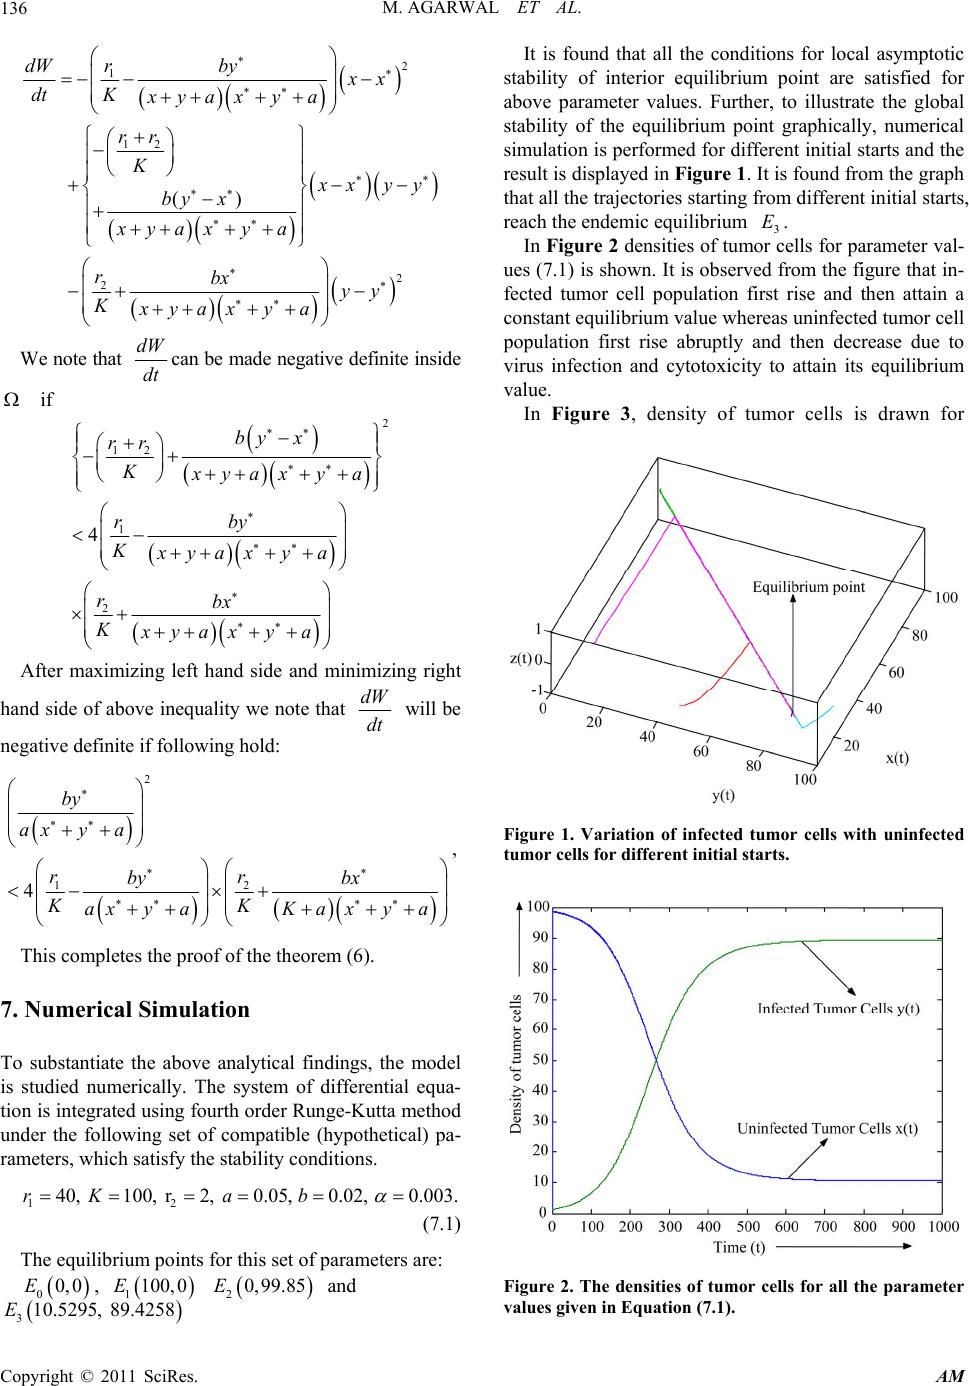 M. AGARWAL ET AL. Copyright © 2011 SciRes. AM 136 2 1 12 2 2 () r dWby xx dtK xyaxya rr K x xyy by x xyaxya rbx yy Kxyaxya We note that dW dt can be made negative definite inside if 2 12 1 2 4 by x rr Kxyaxya rby Kxyaxya rbx Kxyaxya After maximizing left hand side and minimizing right hand side of above in equality we note that dW dt will be negative definite if following hold: 2 12 4 by axy a rr by bx KK axy aKaxya , This completes the proof of the theorem (6). 7. Numerical Simulation To substantiate the above analytical findings, the model is studied numerically. The system of differential equa- tion is integrated using fourth order Runge-Kutta method under the following set of compatible (hypothetical) pa- rameters, which satisfy the stability conditions. 12 40, 100, r2, 0.05, 0.02, 0.003.rKab (7.1) The equilibrium points for this set of parameters are: 00,0E, 1100,0E 20,99.85E and 310.5295, 89.4258E It is found that all the conditions for local asymptotic stability of interior equilibrium point are satisfied for above parameter values. Further, to illustrate the global stability of the equilibrium point graphically, numerical simulation is performed for different initial starts an d the result is displayed in Figure 1. It is found from the gr aph that all the trajectories starting from different initial starts, reach the endemic equilibrium 3 E. In Figure 2 densities of tumor cells for parameter val- ues (7.1) is shown. It is observed from the figure that in- fected tumor cell population first rise and then attain a constant equilibrium value whereas uninfected tumor cell population first rise abruptly and then decrease due to virus infection and cytotoxicity to attain its equilibrium value. In Figure 3, density of tumor cells is drawn for Figure 1. Variation of infected tumor cells with uninfected tumor cells for different initial starts. Figure 2. The densities of tumor cells for all the parameter values given in Equation (7.1).  M. AGARWAL ET AL. Copyright © 2011 SciRes. AM 137 0.3 and other parameters remaining same as in Eq- uation (7.1). This figure implies that the system con- verges to equilibrium point 1100,0E when death rate of infected tumor cells due to the viruses increases from 0.003 to 0.3 . Figure 4 shows the density of tumor cells for 06.0b and other parameters remain- ing same as in Equation (7.1). It demonstrates the con- vergence of the system to equilibrium point 20,99.85E for higher infectivity of the oncolytic virus. Numerically it is found that tumor load decreases when per capita growth rate of infected cells (2 r) is less than or equal to the death rate of infected cells due to virus ( ) for high replication rate of viruses in the cells. Figure 5 shows variation of tumor load with time for different transmission rate of virus infection (b). It is Figure 3. Convergence of the system to the equilibrium point 1100,0E, for 0.3 and other parameters re- maining same as in Equation (7.1). Figure 4. Convergence of the system to the equilibrium point 20,99.85Efor 0.06band other parameters re- maining same as in Equation (7.1). found from the graph that for 2 r2 , tumor load decreases with the increase in b for all 1b and van- ishes for 50b, other parameters remaining same as in Equation (7.1). Figure 6 display the formation of limit cycle in the system. It is observed from numerical simu- lation that stable limit cycles are formed for 1035b and for 35b no limit cycles are formed. However, when 2 r i.e. for parameter values2 r1, 2 and other parameters remaining same as (7.1), we have found that stable limit cycles are formed for 1040b . Figure 7 shows stable limit cycle for 30band keep- ing other parameters fixed as above. However, when 40b, tumor load decreases and strange chaotic attrac- tors are obtained. Figure 8 display chaotic attractor for this range. Figure 5. Variation of tumor load with time for different transmission rate of infection from virus and parameters 140r, 100K , 2 r2 , 0.05a, 2 . Figure 6. Stable limit cycles for parameter values, 140r, 100K , 2 r2 , 0.05a , 2 , 20b initial values 01,y01x . 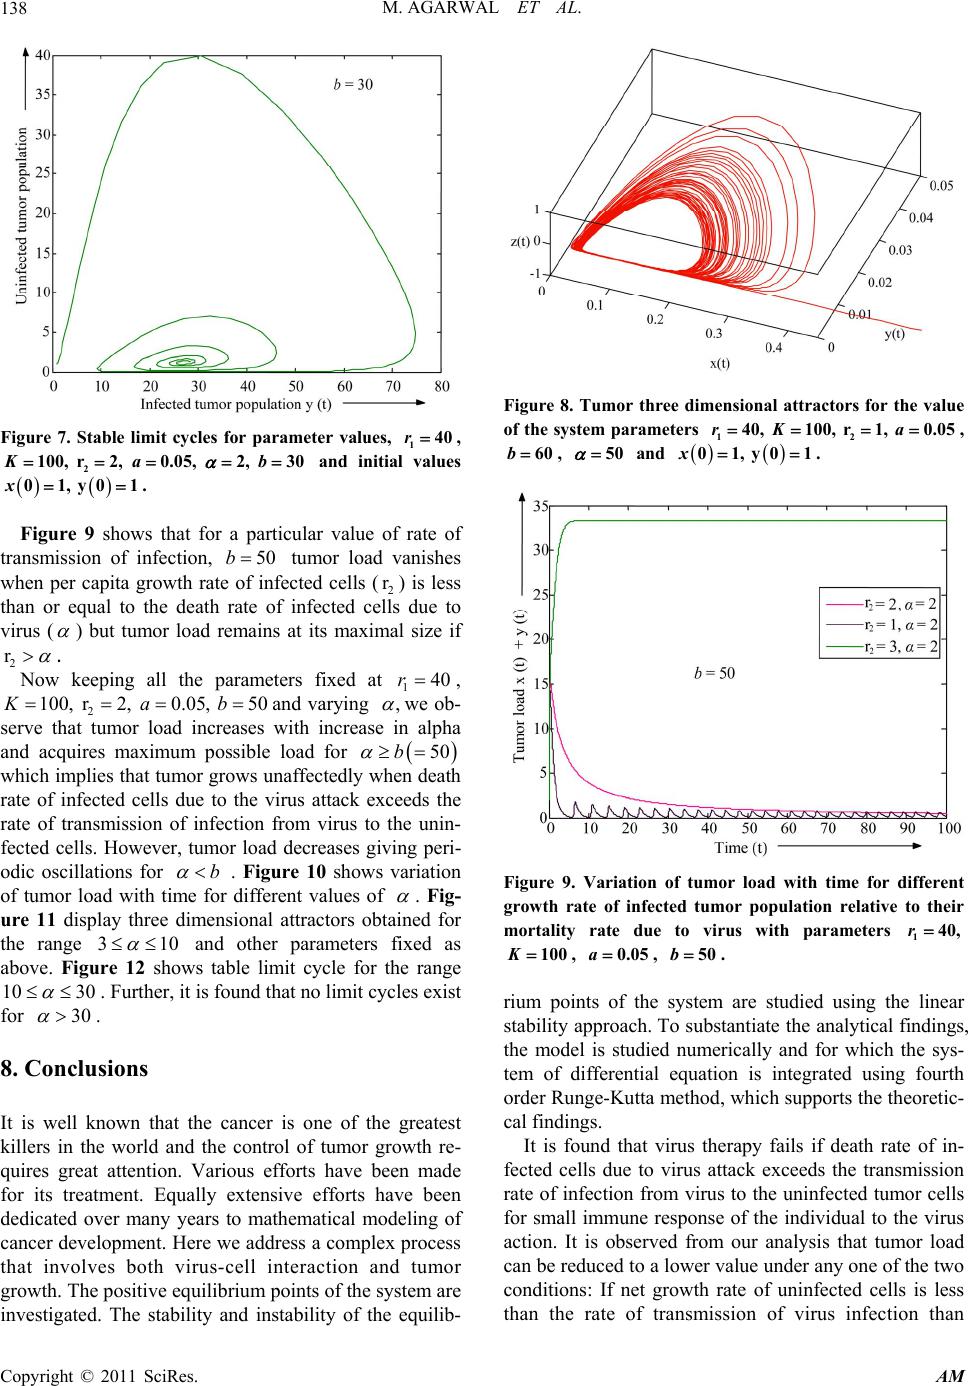 M. AGARWAL ET AL. Copyright © 2011 SciRes. AM 138 Figure 7. Stable limit cycles for parameter values, 140r, 100,K2 r2,0.05,a2, 30b and initial values 01,y01x . Figure 9 shows that for a particular value of rate of transmission of infection, 50b tumor load vanishes when per capita growth rate of infected cells (2 r) is less than or equal to the death rate of infected cells due to virus ( ) but tumor load remains at its maximal size if 2 r . Now keeping all the parameters fixed at 140r , 100,K2 r2,0.05,a50band varying , we ob- serve that tumor load increases with increase in alpha and acquires maximum possible load for 50b which implies that tumor grows unaffectedly when death rate of infected cells due to the virus attack exceeds the rate of transmission of infection from virus to the unin- fected cells. However, tumor load decreases giving peri- odic oscillations for b . Figure 10 shows variation of tumor load with time for different values of . Fig- ure 11 display three dimensional attractors obtained for the range 310 and other parameters fixed as above. Figure 12 shows table limit cycle for the range 10 30 . Further, it is found that no limit cycles exist for 30 . 8. Conclusions It is well known that the cancer is one of the greatest killers in the world and the control of tumor growth re- quires great attention. Various efforts have been made for its treatment. Equally extensive efforts have been dedicated over many years to mathematical modeling of cancer development. Here we address a complex process that involves both virus-cell interaction and tumor growth. The positive equilibrium points of the system are investigated. The stability and instability of the equilib- Figure 8. Tumor three dimensional attractors for the value of the system parameters 140,r 100,K2 r1,0.05a , 60b , 50 and 01,y01x . Figure 9. Variation of tumor load with time for different growth rate of infected tumor population relative to their mortality rate due to virus with parameters 140,r 100K , 0.05a , 50b . rium points of the system are studied using the linear stability approach. To substantiate the analytical findings, the model is studied numerically and for which the sys- tem of differential equation is integrated using fourth order Runge-Kutta method, which supports the theoretic- cal findings. It is found that virus therapy fails if death rate of in- fected cells due to virus attack exceeds the transmission rate of infection from virus to the uninfected tumor cells for small immune response of the individual to the virus action. It is observed from our analysis that tumor load can be reduced to a lower value under any one of the two conditions: If net growth rate of uninfected cells is less than the rate of transmission of virus infection than  M. AGARWAL ET AL. Copyright © 2011 SciRes. AM 139 Figure 10. Variation of tumor load with time for different values of and parameters 140,r100,K2 r1, 0.05a, 50b. Figure 11. Tumor three dimensional attractors for the value of the system parameters 140,r100,K2 r2,0.05,a 50b, 5 and initial values 01x, y0 1 . growth rate of infected cells must be greater than the death rate of infected cells caused by the viruses and if net growth rate of uninfected cells is more than the rate of transmission of virus infection then the ratio of net growth rate of uninfected cells to the death rate of in- fected cells caused by the viruses must exceed the ratio of net growth rate of uninfected cells to rate at which they become infective. Further it is found from our anal- ysis that interior equilibrium point of the system exists under certain condition which is always locally asympto- tically stable if we assume that rate of growth of unin- fected tumor cells is more than the growth rate of in- fected tumor cells. From numerical simulation it is found that tumor load decreases when per capita growth rate of infected cells is Figure 12. Stable limit cycle for the set of parameters: 140r , 100K , 2 r2 , 0.05a, 50b, 20 and 01,y01x . less than or equal to the death rate of infected cells due to virus for high replication rate of viruses in the cells. However, tumor grows unaffectedly when death rate of infected cells due to the virus attack exceeds the rate of transmission of infection from virus to the uninfected cells. The system appears to exhibit different attractors and stable limit cycles for some ranges of the system parameters. 9. References [1] D. Kuruppu and K. K. Tanabe, “Viral Oncolysis by Herpes Simplex Virus and Other Viruses,” Cancer Biol- ogy and Therapy, Vol. 4, No. 5, May 2005, pp. 524-31, doi:10.4161/cbt.4.5.1820 [2] M. K. Voroshilova, “Potential Use of Nonpathogenic En- teroviruses for Control of Human Diseases,” Progress in Medical Virology, Vol. 36, 1989, pp. 191-202. [3] A. R. Pond and E. E. Manuelidis, “Oncolytic Effect of Poliomyelitis Virus on Human Epidermoid Carcinoma (HeLa tumor) Heterologously Transplanted to Guinea Pigs,” The American Journal of Pathology, Vol. 45, No. 2, August 1964, pp. 233-49. [4] C. M. Kunin, “Cellular Susceptibility to Enteroviruses,” Bacteriological Reviews, Vol. 28, No. 4, December 1964, pp. 382-90. [5] S. E. Frew, S. M. Sammut and A. F. Shore, “Chinese Health Biotech and the Billion-Patient Market,” Nature Biotechnology, Vol. 26, No. 1, January 2008, pp. 37-53. doi:10.1038/nbt0108-37 [6] K. Garber, “China Approves World’s First Oncolytic Virus Therapy for Cancer Treatment,” Journal of the Na- tional Cancer Institute, Vol. 98, No. 5, March 2006, pp. 298-300. doi:10.1093/jnci/djj111  M. AGARWAL ET AL. Copyright © 2011 SciRes. AM 140 [7] F. McCormick, “Cancer Specific Viruses and the Deve- lopment of ONYX-015,” Cancer Biology and Therapy, Vol. 2, No. 4, 2003, pp. 157-160. [8] D. Barker and A. J. Berk, “Adenovirus Proteins from Both E1B Reading Frames are Required for Transforma- tion of Rodent Cells by Viral Infection and DNA Trans- fection,” Virology, Vol. 156, No. 1, 1987, pp. 107-121. doi:10.1016/0042-6822(87)90441-7 [9] A. S. Novozhilov, F. S. Berezovskaya, E. V. Koonin and G. P. Karev, “Mathematical Modeling of Tumor Therapy with Oncolytic Viruses: Regimes with Complete Tumor Elimination within the Framework of Deterministic Models,” Biology Direct, Vol. 1, No. 1, 2006, p. 6. doi: 10.1186/1745-6150-1-6 [10] D. Wodarz and N. Komarova, “Computational Biology of Cancer,” Lecture notes and Mathematical Modeling, World Scientific Publishing Company, Singapore, 2005. doi:10.1142/9789812701367 [11] D, Wodarz, “Viruses as Antitumor Weapons: Defining Conditions for Tumor Remission,” Cancer Research, Vol. 61, No. 8, 2001, pp. 3501-3507. [12] M. A. Nowak and C. R. Bhangham, “Population Dynam- ics of Immune Responses to Persistent Viruses,” Science, Vol. 272, No. 5258, 1996, pp. 74-79. doi:10.1126/ science.272.5258.74 [13] J. T. Wu, H. M. Byrne, D. H. Kirn and L. M. Wein, “Modeling and Analysis of a Virus that Replicates Selec- tively in Tumor Cells,” Bulletin of Mathematical Biology, Vol. 63 No. 4, 2001, pp.731-768. doi:10.1006/bulm.2001. 0245 [14] A. Freedman and Y. Tao, “Analysis of a Model of a Vi- rus that Replicates Selectively in Tumor Cells,” Journal of Mathematical Biology, Vol. 47, No. 5, 2003, pp. 391-423. doi:10.1007/s00285-003-0199-5 [15] R. Sarkar and S. Banerjee, “Cancer and Self Remission and Tumor Stability—A Stochastic Approach,” Mathe- matical Biosciences, Vol. 196, No. 1, 2005, pp. 65-81. doi:10.1016/j.mbs.2005.04.001 [16] Y. Kuang, “Biological Stocichiometry of Tumor Dynam- ics: Mathematical Models and Analysis,” Discrete and Continuous Dynamical Systems, Series B, Vol. 4, No. 3, pp. 221-240. [17] A. El-Gohary and I. A. Alwasel, “The Chaos and Optimal Control of Cancer Model with Complete Unknown Pa- rameters,” Chaos, Solitons and Fractals, Vol. 42, No. 5, 2009, 2865-2874. doi:10.1016/j.chaos.2009.04.028 [18] A. El-Gohary, “Chaos and Optimal Control of Cancer Self-Remission and Tumor System Steady States,” Chaos, Solitons and Fractals, Vol. 37, No. 5, 2008, pp. 1305-1316. doi:10.1016/j.chaos.2006.10.060 [19] A. El-Gohary and A. Al-Ruzaiza, “Chaos and Adaptive Control in Two Prey, Ane Predator System with Nonli- near Feedback,” Chaos, Solitons and Fractals, Vol. 34, no. 2, 2007, pp. 443-53. doi:10.1016/j.chaos.2006.03.101 [20] J. K. Hale, “Ordinary Differential Equations,” 2nd Editon, Kriegor, Basel, 1980. |