Paper Menu >>
Journal Menu >>
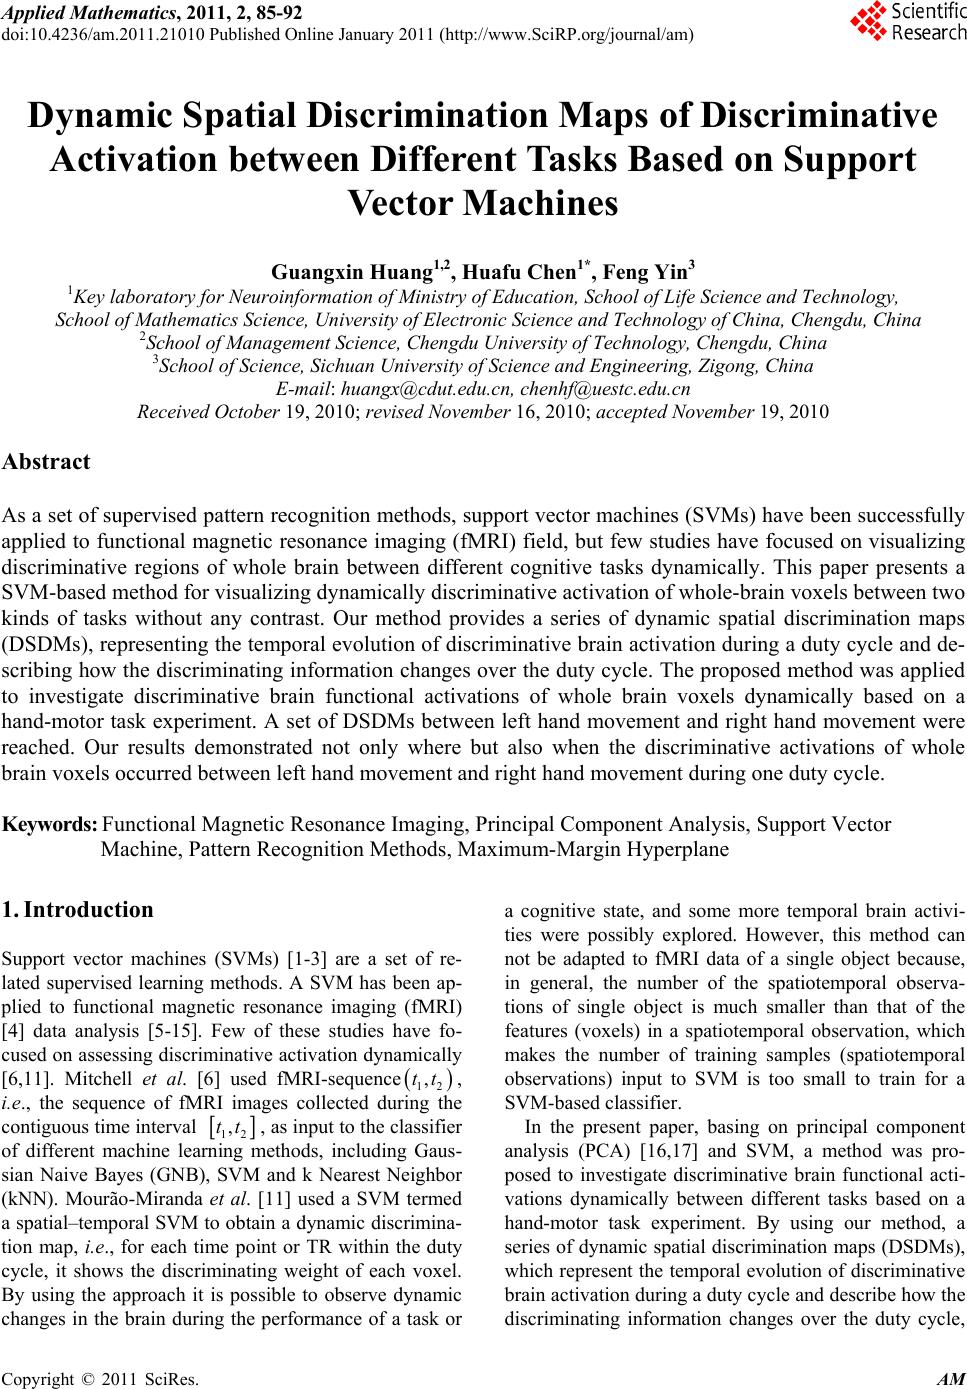 Applied Mathematics, 2011, 2, 85-92 doi:10.4236/am.2011.21010 Published Online January 2011 (http://www.SciRP.org/journal/am) Copyright © 2011 SciRes. AM Dynamic Spatial Discrimination Maps of Discriminative Activation between Different Tasks Based on Support Vector Machines Guangxin Huang1,2, Huafu Chen1*, Feng Yin3 1Key laboratory for Neuroinformation of Ministry of Education, School of Life Science and Technology, School of Mathematics Science, University of Electronic Science and Technology of China, Chengdu, China 2School of Management Science, Chengdu University of Technology, Chengdu, China 3School of Science, Sichuan University of Science and Engineering, Zigong, China E-mail: huangx@cdut.edu.cn, chenhf@uestc.edu.cn Received October 19, 2010; revised November 16, 2010; accepted November 19, 2010 Abstract As a set of supervised pattern recognition methods, support vector machines (SVMs) have been successfully applied to functional magnetic resonance imaging (fMRI) field, but few studies have focused on visualizing discriminative regions of whole brain between different cognitive tasks dynamically. This paper presents a SVM-based method for visualizing dynamically discriminative activation of whole-brain voxels between two kinds of tasks without any contrast. Our method provides a series of dynamic spatial discrimination maps (DSDMs), representing the temporal evolution of discriminative brain activation during a duty cycle and de- scribing how the discriminating information changes over the duty cycle. The proposed method was applied to investigate discriminative brain functional activations of whole brain voxels dynamically based on a hand-motor task experiment. A set of DSDMs between left hand movement and right hand movement were reached. Our results demonstrated not only where but also when the discriminative activations of whole brain voxels occurred between left hand movement and right hand movement during one duty cycle. Keywords: Functional Magnetic Resonance Imaging, Principal Component Analysis, Support Vector Machine, Pattern Recognition Methods, Maximum-Margin Hyperplane 1. Introduction Support vector machines (SVMs) [1-3] are a set of re- lated supervised learning methods. A SVM has been ap- plied to functional magnetic resonance imaging (fMRI) [4] data analysis [5-15]. Few of these studies have fo- cused on assessing discriminative activation dynamically [6,11]. Mitchell et al. [6] used fMRI-sequence 12 ,tt , i.e., the sequence of fMRI images collected during the contiguous time interval 12 ,tt , as input to the classifier of different machine learning methods, including Gaus- sian Naive Bayes (GNB), SVM and k Nearest Neighbor (kNN). Mourão-Miranda et al. [11] used a SVM termed a spatial–temporal SVM to obtain a dynamic discrimina- tion map, i.e., for each time point or TR within the duty cycle, it shows the discriminating weight of each voxel. By using the approach it is possible to observe dynamic changes in the brain during the performance of a task or a cognitive state, and some more temporal brain activi- ties were possibly explored. However, this method can not be adapted to fMRI data of a single object because, in general, the number of the spatiotemporal observa- tions of single object is much smaller than that of the features (voxels) in a spatiotemporal observation, which makes the number of training samples (spatiotemporal observations) input to SVM is too small to train for a SVM-based classifier. In the present paper, basing on principal component analysis (PCA) [16,17] and SVM, a method was pro- posed to investigate discriminative brain functional acti- vations dynamically between different tasks based on a hand-motor task experiment. By using our method, a series of dynamic spatial discrimination maps (DSDMs), which represent the temporal evolution of discriminative brain activation during a duty cycle and describe how the discriminating information changes over the duty cycle, 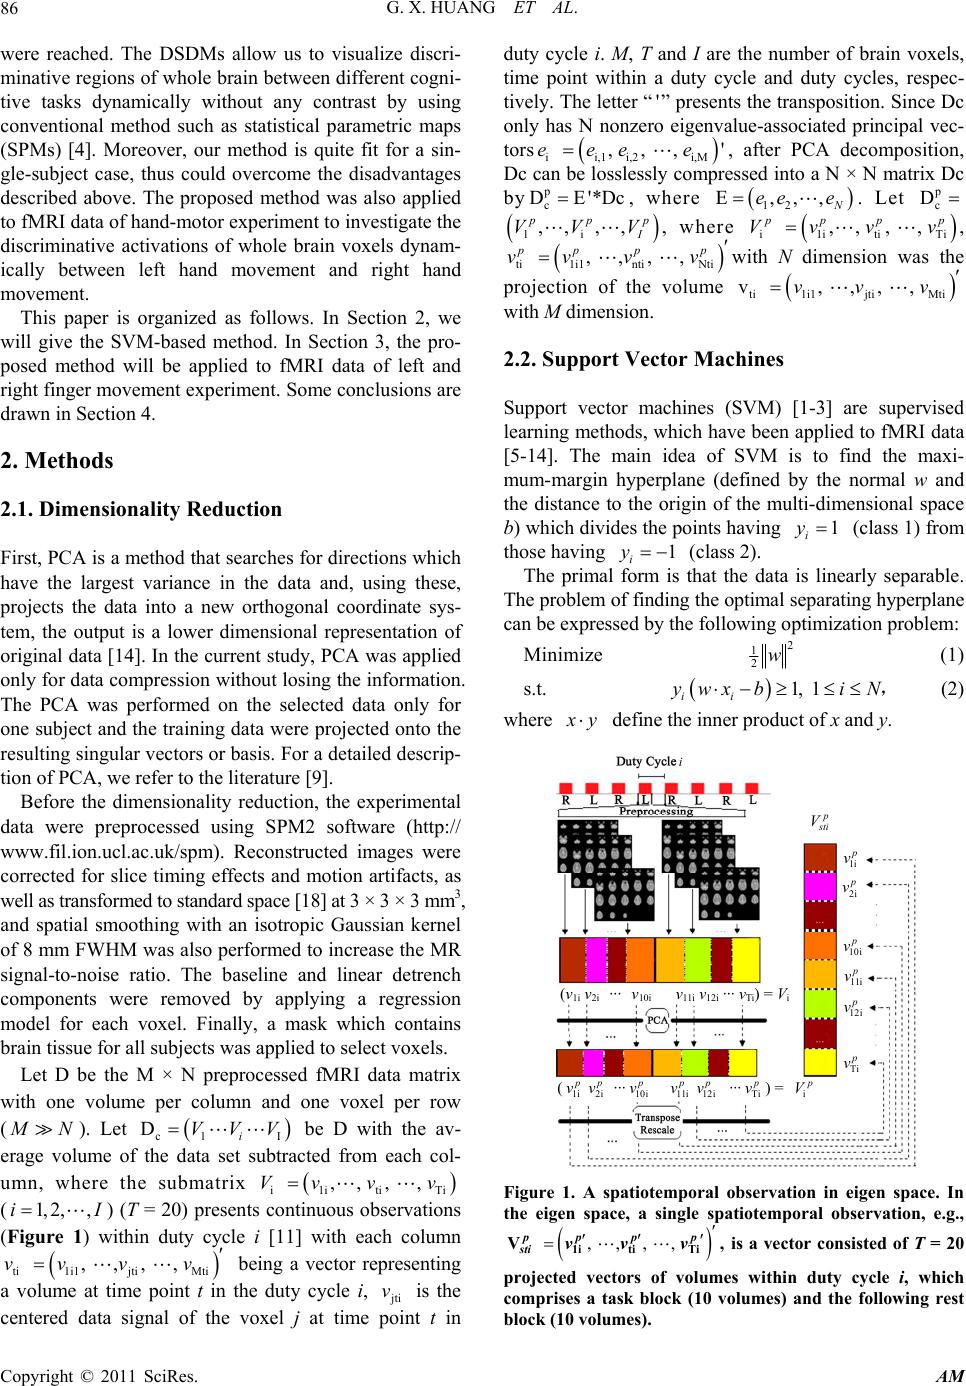 G. X. HUANG ET AL. Copyright © 2011 SciRes. AM 86 were reached. The DSDMs allow us to visualize discri- minative regions of whole brain between different cogni- tive tasks dynamically without any contrast by using conventional method such as statistical parametric maps (SPMs) [4]. Moreover, our method is quite fit for a sin- gle-subject case, thus could overcome the disadvantages described above. The proposed method was also applied to fMRI data of hand-motor experiment to investigate the discriminative activations of whole brain voxels dynam- ically between left hand movement and right hand movement. This paper is organized as follows. In Section 2, we will give the SVM-based method. In Section 3, the pro- posed method will be applied to fMRI data of left and right finger movement experiment. Some conclusions are drawn in Section 4. 2. Methods 2.1. Dimensionality Reduction First, PCA is a method that searches for directions which have the largest variance in the data and, using these, projects the data into a new orthogonal coordinate sys- tem, the output is a lower dimensional representation of original data [14]. In the current study, PCA was applied only for data compression without losing the information. The PCA was performed on the selected data only for one subject and the training data were projected onto the resulting singular vectors or basis. For a detailed descrip- tion of PCA, we refer to the literature [9]. Before the dimensionality reduction, the experimental data were preprocessed using SPM2 software (http:// www.fil.ion.ucl.ac.uk/spm). Reconstructed images were corrected for slice timing effects and motion artifacts, as well as transformed to standard space [18] at 3 × 3 × 3 mm3, and spatial smoothing with an isotropic Gaussian kernel of 8 mm FWHM was also performed to increase the MR signal-to-noise ratio. The baseline and linear detrench components were removed by applying a regression model for each voxel. Finally, a mask which contains brain tissue for all subjects was applied to select voxels. Let D be the M × N preprocessed fMRI data matrix with one volume per column and one voxel per row ( M N). Let c1 I Di VVV be D with the av- erage volume of the data set subtracted from each col- umn, where the submatrix i1i tiTi ,, , , Vv vv (1, 2,,iI) (T = 20) presents continuous observations (Figure 1) within duty cycle i [11] with each column ti 1i1jtiMti , ,, , vv vv being a vector representing a volume at time point t in the duty cycle i, jti v is the centered data signal of the voxel j at time point t in duty cycle i. M, T and I are the number of brain voxels, time point within a duty cycle and duty cycles, respec- tively. The letter “ ' ” presents the transposition. Since Dc only has N nonzero eigenvalue-associated principal vec- tors ii,1 i,2i,M , , , 'eee e, after PCA decomposition, Dc can be losslessly compressed into a N × N matrix Dc by p c DE'*Dc, where 12 E,,, N ee e. Let p c D 1i ,, ,, ppp I VVV , where i1itiTi ,, , , ppp p Vvvv, ti 1i1ntiNti , ,, , pp pp vv vv with N dimension was the projection of the volume ti 1i1jtiMti v , ,, , vv v with M dimension. 2.2. Support Vector Machines Support vector machines (SVM) [1-3] are supervised learning methods, which have been applied to fMRI data [5-14]. The main idea of SVM is to find the maxi- mum-margin hyperplane (defined by the normal w and the distance to the origin of the multi-dimensional space b) which divides the points having 1 i y (class 1) from those having 1 i y (class 2). The primal form is that the data is linearly separable. The problem of finding the optimal separating hyperplane can be expressed by the following optimization problem: Minimize 2 1 2w (1) s.t. 1, 1 ii y wxbi N , (2) where x y define the inner product of x and y. (v 1i v 2i ··· v 10i v 11i v 12i ··· v Ti ) = V i ( 1i p v2i p v ··· 10i p v 11i p v12i p v ··· Ti p v ) = i p V p s ti V 1i p v 2i p v 10i p v 11i p v 12i p v Ti p v i Figure 1. A spatiotemporal observation in eigen space. In the eigen space, a single spatiotemporal observation, e.g., , ,, , 1i tiTi V pp pp sti vv v, is a vector consisted of T = 20 projected vectors of volumes within duty cycle i, which comprises a task block (10 volumes) and the following rest block (10 volumes).  G. X. HUANG ET AL. Copyright © 2011 SciRes. AM 87 In the general case of overlapping classes the problem of finding the optimal separating hyperplane that max- imizes the distance to the nearest training points of the two classes is defined as the following optimization problem: Minimize 2 1 2i i wC (3) s.t. 1, 1 ii i y wx bi N (4) and i0, 1.iN (5) where i0, 1iN are slack variables that account for training errors and C is a positive real constant ap- pearing only as an additional constraint on the Lagran- gian multipliers. Both cases above can be translated into their uncon- strained dual form. By using Lagrangian multiplier me- thod, the solution can be found as [2]: 1 , N iii i wyx (6) where 0 i is the Lagrangian multiplier, which is constrained by 0 ii y . The points with 0 i are called “support vectors”, which lie in the supporting hyperplane. For any other points, 0 i . In fMRI neu- roimaging field, w represents a map of the most discri- minating regions, i.e., a discriminating volume [9,10] or a spatial discriminance map [12]. Given two classes, task 1 and task 2, with the labels +1 and −1, a positive value in the map means that this voxel has higher activity dur- ing task 1 than during task 2 in the training examples that contribute most to the overall classification, i.e., the support vectors; negative value means lower activation during task 1 than task 2. For a detailed theory of SVM, we refer to the literatures [1-3,19]. In the present work, a linear SVM is used to determine a weight vector p w (corresponding to a hyperplane in eigen space) comprising discriminative information of spatiotemporal observations in eigen space. The input to SVM is the examples of the form , ii x y, where i x represents a spatiotemporal observation in eigen space (see Figure 1) and i y is the task label (1 i y for right hand movement task cycle (task 1) and 1 i y for left hand movement task cycle (task 2)). A spatiotemporal observation in eigen-space is de- scribed in Figure 1. In the eigen space, a single spati- otemporal observation, .g., p 1i tiTi ',, ', , ' ppp sti Vv vv , is a vector consisted of 20T projected vectors of volumes within duty cycle i, which comprises a task block (10 volumes) and the following rest block (10 vo- lumes). The spatiotemporal data are represented by a 12 dd matrix 2 1,,,, ppp p st ststistd DVVV called spa- tiotemporal observation matrix, where 1*dTN is the number of voxels in a spatiotemporal observation and 21dI is the number of the spatiotemporal observa- tions. 2.3. Dynamic Spatial Discrimination Maps Once the weight vector p wis trained, let p w 12 ,, pp p T ww w ,, we can project 12 ,, p pp T ww w, back into the original fMRI data space by 12 T ww w 12 ** P pp p T WEWEwww . Each i1, ,wi T represents a map of the most discriminating regions, i.e., a discriminating volume [9,10] or a spatial discriminance map (SDM) [12]. All weight vectors 12 T ww w were normalized to have the same scale. Thus, we obtained a dynamic spatial discrimination maps (DSDMs) 12 ,,, T ww w. As a nonparametric technique, permutation test [20] has been previously applied to fMRI data analysis. This technology was used to determine the threshold of the DSDMs. Firstly, we applied the proposed method to the training data, i.e., the spatiotemporal observations in ei- gen space, and obtain the normalized weight vector w (Figure 2), which contained the DSDMs 12 ,,, T ww w as its sub-blocks. Then under the null hypothesis of no relationship between the class labels and the global structure of the spatiotemporal observations in eigen space, the class labels were permuting 2000 times ran- domly and each time our method was applied to the spa- tiotemporal observations with this permutation of labels to produce a normalized weight vector *1,, 2000 i wi. These produced normalized weight vectors *1,, 2000 i wi were used to evaluate the null distribution of w. Lastly, for each element ij w (related to a voxel) in the weight vector w, count the number of elements at the j-th posi- tion of all * i w which are greater (in absolute values) than ij w. This result divided by 2000 is regarded as the p-value for this voxel. All significant voxels under p-values < 0.001 were displayed in the DSDMs (corres- ponding to the scaled weight vectors 12 ,,, T ww w) by the values in the weight vector w. c D p c D p s t D p w 1 p w p W p cc D ED p T w 1 pp T ww W W 0 W 0 = EW p w 1 w 01 w T w 0 T w 1 ··· w T w 01 ··· w 0T v 11 v T1 v 17 v T7 Figure 2. Steps for obtaining dynamic spatial discrimina- tion maps (DSDMs).  G. X. HUANG ET AL. Copyright © 2011 SciRes. AM 88 The performance of the classifier was estimated using the conventional leave-one-out cross-validation test [21]. Leave-one-out cross-validation test was applied to test the performance of SVM-classifier in some previous fMRI studies [9-14]. In the present work, 50 percent of all the spatiotemporal observations in eigen space are used for training the classifier and the rest is used for evaluating the classier. Our method described above can be summarized in Figure 2. 3. Application to fMRI Dataset 3.1. Hand Movement Dataset Four male and two female subjects with age range 19-25 years participated in this fMRI study after giving in- formed consent approved by local Institutional Review Board approval. All subjects were right-handed with normal or corrected-to-normal visual acuity. None had a history of any neuropsychiatric disorders. The experiment was conducted at the University of Texas Health Science Center in San Antonio, Texas, with Siemens 3-T Magnetom Trio. The echo planar im- aging (EPI) settings were as follows: repetition time = 2000 ms; matrix size = 64 × 64; voxel size = 3.75 × 3.75 × 4 mm; echo time = 30 ms; flip angle = 90. The first four scans of each run were discarded to allow for mag- netic saturation effects. 3.2. Experimental Design Stimuli were presented in a blocked fashion. There were two different active conditions: left hand movement and right hand movement,and a control condition (rest). The subjects were required to concentrate on the fixation cross in control condition and to move their right hand only when the symbol R was presented but to move their left hand only when the symbol L was presented. Each run comprised 16 blocks and each block lasted 20 seconds (20 seconds for rest, 20 seconds for right hand movement, 20 seconds for rest, 20 seconds for left hand movement, orderly and alternately). Before the fMRI experiment, subjects were trained for about 1 hour to ensure that they could perform the task correctly. 4. Results 4.1. Statistic Parametric t-Maps (SPMt) The results of statistical parametric t-maps between left hand movement and right hand movement block (right hand movement > left hand movement) were obtained by performing the general linear model (GLM) [4] analysis using SPM2 (http://www.fil.ion.ucl.ac.uk/spm). All vox- els with the absolute t-value above the threshold 5.85 (p < 0.001, corrected) were shown in Figure 3 with color scale (light/dark blue for negative values and red/orange for positive values). Correspondingly, the active regions, the Talairach coordinates of voxel with maximum t-value, cluster size and the Brodman area of active voxels for left hand movement and right hand movement were de- scribed in Table 1, where the regions only with cluster size > 10 were displayed. 4.2. Dynamic Spatial Discrimination Maps For each of the six subjects, our method was applied to produce a sequence of 20 dynamic spatial weight vectors (scaled to the range from –1.0 to 1.0 by each element of Figure 3. SPM t-maps (right hand movement > left hand movement). All voxels with absolute t-value above of 5.85 (p < 0.001, corrected) are shown in color scale (light/dark blue for negative values and red/orange for positive values). Table 1. Active regions in SPM t-maps (right hand move- ment > left hand movement). Regions only with absolute t-value > 5.85 (p < 0.001, corrected) and cluster size >10 are displayed. TDRN TAL BA CSVPVW R Cerebelum _4_5_R 18, –50, –15 18 19 30 37 60 9.4338 Cerebelum _6_R 21, –50, –18 18 19 37 71 9.2102 Fusiform_R 27, –53, –12 19 37 19 7.2989 Lingual_R 9, –64, –7 17 18 31 8.2081 Postcentral_L–36, –18, 51 3 4 6 10710.7905 Precentral_L–33, –17, 67 3 4 6 40014.5783 Vermis_4_5 6, –62, –7 18 11 8.1849 Vermis_6 6, –64, –7 17 18 24 8.1835 L Postcentral_R39, –26, 65 3 4 6 131–11.1386 Precentral_R42, –23, 65 3 4 6 268–11.5902 Abbreviations: R = Right hand movement; L = Left hand movement; T = Task; DRN = Discriminative regions name; CSV=Cluster size (voxels); PVW = Peak value (weight); TAL = Talairach coordinates; BA = Brodman area.  G. X. HUANG ET AL. Copyright © 2011 SciRes. AM 89 a vector dividing the maximum absolute value of all the weight vectors), which can be termed as “dynamic spa- tial discrimination maps” (DSDMs) to differ “dynamic discrimination map” [11]. Figures 4(a), (b), (c) and (d) showed the DSDMs of a single subject. All Voxels with p-value < 0.001 are shown in color scale corresponding to the values in each weight vector i1, ,wi T. The color scale identifies the most discriminating regions for each time point (light/dark blue for negative values, i.e., relatively more activation for left hand movement, and red/orange for positive values, i.e., relatively more acti- vation for right hand movement). The first 10 rows (Figures 4(a) and (b)) correspond to time points during left hand movement and right hand movement (Figure 4(a): 2-12s, Figure 3(b): 14-20s) and the following 10 rows (Figures 4(c) and (d)) correspond to time points during rest condition. The DSDMs described how the discriminating infor- mation changes over one duty cycle. It can be seen from Figure 4 that no voxels with a highly discriminating weight were found at 2 s. At 4s the first discriminating areas between left hand movement and right hand movement appear in red and blue, increase continuously until the fifth or sixth TR and decrease after the end of the image presentation. At 26 s few discriminating vox- els in primary motor cortex appeared and disappeared completely at 28 s until 40 s. There is a 4-6 s BOLD sig- nal delay (Figure 4(c)). (a) (b) (c) (d) Figure 4. Dynamic spatial discrimination maps (DSDMs) of a single subject between left hand movement and right hand movement. All voxels with p-value < 0.001 are shown in color scale corresponding to the values in the weight vector (light/dark blue for negative values, i.e., relatively more activation for left hand movement, and red/orange for positive values, i.e., relatively more activation for right hand movement).  G. X. HUANG ET AL. Copyright © 2011 SciRes. AM 90 It is possible to observe how the primary motor cortex discriminates between left hand movement and right hand movement through time. Figure 5 shows that more discriminating voxels for right hand movement than those for left hand movement appear at all time points from 2 s to 24 s, which suggests asymmetrical cortical activities in left and right hemispheres of brain in a way. 4.3. Performance of Classifier Repeating the leave-one-out cross-validation test [21] 1000 times, we got the classifier performance of 88 ± 5.1%. 5. Discussion In this paper, a new neuroscience imaging method de- scribed in Figure 2 was proposed to investigate discri- minative brain functional activations of whole brain vox- els dynamically based on a hand-motor task experiment. Our method could produce a set of DSDMs representing the temporal evolution of discriminative brain activation during a duty cycle dynamically. The proposed method extended the ability of present SVM-based methods not only on visualizing discriminative brain regions between different tasks but also being suit to a case of single sub- ject. Our method focuses on the discriminative activa- tions of whole brain voxels between two different cogni- tive or motor tasks dynamically. There are two main advantages in our method. One is that a set of so called DSDMs could be reached by our method. The DSDMs allow us visualizing dynamically regions of whole-brain discriminative activation between two kinds of tasks without any contrast by using conven- tional method such as SPMs [4,22]. Basing on fitting a GLM to each voxel’s time series independently, SPMs [4,22] shows differences in blood oxygenation level- dependent (BOLD) response between tasks and the esti- mated significance of these differences. The SPM t-con- trast was performed between left hand movement and right hand movement (right hand movement > left hand movement). The SPM t-maps (Figure 3) between left hand movement and right hand movement were obtained and the active regions were displayed in Table 1. The other is that our method is fit for a single subject case. By using PCA-based dimension reduction, the spa- tiotemporal observations in eigen space (Figure 1) of a single subject allow SVM to train a classifier. Previous method constructed a spatiotemporal observation in saw data space [11]. However, this method can not be adapted to fMRI data of a single object because, in gen- eral, the number of the spatiotemporal observations of single object is much smaller than that of the features (voxels) in a spatiotemporal observation, which makes the number of training samples input to SVM is too small to train for the classifier of SVM. The proposed method could overcome this disadvantage. For the just reason, we only display the results of a single subject instead of that of multi-subjects. A spatial and temporal response factorization was also performed similar to the method described by Mourão- Miranda et al. [11]. Some previous studies have assessed formally the issue of separability [11,23]. Spatiotemporal factorization is an assumption implicit in conventional unsupervised approaches like ICA. The spectrum of ei- genvalues obtained by PCA decomposition of the spati- otemporal weight vectors (corresponding to DSDMs) is presented in Figure 6. The first mode is higher than the second, the second mode is higher than the third, the Figure 5. The number of discriminative voxels in primary motor cortex with left hand movement and right hand movement during one duty cycle . Figure 6. Normalized eigenvalues of the spatiotemporal weight vectors.  G. X. HUANG ET AL. Copyright © 2011 SciRes. AM 91 third mode is higher than the fourth and the fourth mode is higher than the fifth, the latter is higher than others, which suggest some degree of space time separability between the first five dynamic spatial discrimination maps. The results suggest that joint spatiotemporal anal- ysis yields significant extra information over the separate spatial and temporal analysis. The proposed method was applied to fMRI data of hand movement experiment. A series of DSDMs (Figure 4) were reached, which display discriminative regions over one duty cycle between left hand movement and right hand movement dynamically with p-value < 0.001. The DSDMs contains a lot of discriminating information between left hand movement and right hand movement. Firstly, the DSDMs demonstrated when the discrimina- tive activations of whole brain voxels occurred and dis- appeared between left hand movement and right hand movement during one duty cycle. There were no discri- minating voxels at 2 s. At 4s the first discriminating areas between left hand movement and right hand move- ment appeared (Figure 4(a)). Secondly, the DSDMs also demonstrated where the discriminative activations of whole brain voxels occurred. The main discriminating areas were primary motor cortex (M1). There were more activations in M1 of the right hemisphere when left hand movement while more activations in M1 and cerebelum of the left hemisphere when right hand movement. There were no discriminative activations in the supplementary motor area (SMA). This result is consistent with that by Sato et al. [14]. In addition, the DSDMs described how the discriminating information changes over one duty cycle. The discriminating areas between left hand move- ment and right hand movement increased continuously from the second TR to the fifth or sixth TR and de- creased after the end of the image presentation and dis- appeared completely at 28 s until 40 s (Figures 4(c) and (d)). There was also a 4-6 s BOLD signal delay (Figures 4(a) and (c)). The discriminative regions in the 5th spatial discrimi- nation map (at 10 s) with p-value < 0.001 and cluster size of voxels > 10 between left hand movement and right hand movement are also given in Table 2. It is possible to observe how the primary motor cortex discriminates between left hand movement and right hand movement through time. Figure 5 shows that more discriminating voxels for right hand movement than those for left hand movement appear at all time points from 2 s to 24 s, which suggests asymmetrical cortical activities in left and right hemispheres of brain in a way. Furthermore, the asymmetrical cortical activities in left and right hemispheres of brain [24] were implied in the DSDMs. It can be observed from Figure 5 that there are more discriminating voxels for right hand movement Table 2. Brain discriminative regions in the 5th spatial dis- crimination map (at 10 s) between left hand movement and right hand movement. The regions only with p < 0.001 and cluster size > 10 are displayed. TDRN TAL BA CSVPVW R Cerebelum_6_R 33, –68, –14 18 19 41 0.3897 Cerebelum_Crus1_L -30, –85, –13 18 19 22 0.2529 Cerebelum_Crus1_R 36, –82, –14 18 19 22 0.3132 Frontal_Sup__L –30, –5, 67 6 14 0.2732 Fusiform_R 33, –68, –12 18 19 70 0.5181 Lingual_L –21, –88, –11 18 19 22 0.2532 Lingual_R 36, –85, –11 17 18 19 74 0.3506 Occipital_Inf_R 36, –67, –7 18 19 36 0.3291 Paracentral_Lobule_L –15, –11, 72 3 4 5 6 29 0.461 Parietal_Sup_L –24, –46, 69 1 2 5 7 40 59 0.356 Postcentral_L –45, –15, 56 1 2 3 4 6 7 127 0.5403 Precentral_L –33, –14, 67 3 4 6 368 1 Precuneus_L –6, –43, 68 1 3 5 7 116 0.3354 Vermis_6 6, –64, -4 17 18 10 0.2647 L Postcentral_R 39, –26, 65 1 2 3 4 6 133 –0.588 Precentral_R 39, –23, 65 3 4 6 163 –0.5268 Abbreviations: R = Right hand movement; L = Left hand movement; T = Task; DRN = Discriminative regions name; CSV = Cluster size (voxels); PVW = Peak value (weight); TAL = Talairach coordinates; BA = Brodman area. than for left hand movement at all time points from 2 s to 24 s. In conclusion, a SVM-based method presented in this paper could produce a set of DSDMs, which allow visua- lizing discriminative activation of whole-brain voxels dynamically between different tasks over a duty cycle without any contrast by using conventional method such as SPM [4,22]. Moreover, our method is adapted to fMRI data of a single-subject. The results can be further input to a population inference [24]. The proposed me- thod is useful to detect the discriminative brain function- al activations between complex cognitive tasks dynami- cally without any contrast. 6. Acknowledgements The authors are grateful to the anonymous referee for the constructive and helpful comments. This work was fi- nancially supported by NSFC, 9082006 and 30770590, Key research project of science and technology of MOE (107097) and 863 Program No: 2008AA02Z4080.  G. X. HUANG ET AL. Copyright © 2011 SciRes. AM 92 7. References [1] V. Vapnik, “The Nature of Statistical Learning Theory,” Springer-Verlag, New York, 1995. [2] V. Vapnik, “Statistical Learning Theory,” John Wiley and Sons Inc., New York, 1998. [3] C. J. C. Burges, “A Tutorial on Support Vector Machines for Pattern Recognition,” Data Mining and Knowledge Discovery, Vol. 2, No. 2, 1998, pp. 121-167. doi:10.1023/ A:1009715923555 [4] K. J. Friston, A. P. Holmes, K. J. Worsley, J. P. Poline, C. D. Frith and R. S. J. Frackowiak, “Statistical Parametric Maps in Functional Imaging: A General Linear Ap- proach,” Human Brain Mapping, Vol. 2, No. 4, 1995, pp. 189-210. doi:10.1002/hbm.460020402 [5] D. D. Cox and R. L. Savoy, “Functional Magnetic Re- sonance Imaging (fMRI) “Brain Reading”: Detecting and Classifying Distributed Patterns of fMRI Activity in Hu- man Visual Cortex,” NeuroImage, Vol. 19, No. 2, 2003, pp. 261-270. doi:10.1016/S1053-8119(03)00049-1 [6] T. M. Mitchell, R. Hutchinson, R. S. Niculescu, F. Pereira and X. Wang, “Learning to Decode Cognitive States from Brain Images,” Machine Learning, Vol. 57, No. 1-2, 2004, pp. 145-175. doi:10.1023/B:MACH.0000035475.85309.1b [7] C. Davatzikos, K. Ruparel, Y. Fan, D. G. Shen, M. Acharyya and J. W. Loughead, “Classifying Spatial Pat- terns of Brain Activity with Machine Learning Methods: Application to Lie Detection,” NeuroImage, Vol. 28, No. 3, 2005, pp. 663-668. doi:10.1016/j.neuroimage.2005.08. 009 [8] S. LaConte, S. Strother, V. Cherkassky, J. Anderson and X. Hu, “Support Vector Machines for Temporal Classifi- cation of Block Design fMRI Data,” NeuroImage, Vol. 26, No. 2, 2005, pp. 317-329. doi:10.1016/j.neuroimage. 2005.01.048 [9] J. Mourão-Miranda, A. L. W. Bokde, C. Born, H. Hampel and S. Stetter, “Classifying Brain States and Determining the Discriminating Activation Patterns: Support Vector Machine on Functional MRI Data,” NeuroImage, Vol. 28, No. 4, 2005, pp. 980-995. doi:10.1016/j.neuroimage.2005. 06.070 [10] J. Mourão-Miranda, E. Reynaud, F. McGlone, G. Calvert and M. Brammer, “The Impact of Temporal Compression and Space Selection on SVM Analysis of Single-Subject and Multi-Subject fMRI Data,” NeuroImage, Vol. 33, No. 4, 2006, pp. 1055-1065. doi:10.1016/j.neuroimage.2006. 08.016 [11] J. Mourão-Miranda, K. Friston and M. Brammer, “Dy- namic Discrimination Analysis: A Spatial-Temporal SVM,” NeuroImage, Vol. 36, No. 1, 2007, pp. 88-99. [12] Z. Wang, A. R. Childress, J. Wang and J. A. Detre, “Support Vectormachine Learning-Based fMRI Data Group Analysis,” NeuroImage, Vol. 36, No. 4, 2007, pp. 1139- 1151. doi:10.1016/j.neuroimage.2007.03.072 [13] J. R. Sato, J. Mourão-Miranda, M. G. M. Martin, E. Amaro Jr., P. A. Morettin and M. J. Brammer, “The Im- pact of Functional Connectivity Changes on Support Vector Machines Mapping of fMRI Data,” Journal of Neuroscience Methods, Vol. 172, No. 1, 2008, pp. 94- 104. doi:10.1016/j.jneumeth.2008.04.008 [14] J. R. Sato, A. Fujita, C. E. Thomaz, M. G. M. Martin, J. Mourão-Miranda, M. J. Brammer and E. Amaro Jr., “Evaluating SVM and MLDA in the Extraction of Dis- criminant Regions for Mental State Prediction,” NeuroI- mage, Vol. 46, No. 1, 2009, pp. 105-114. doi:10.1016/j. neuroimage.2009.01.032 [15] J. D. Haynes and G. Rees, “Predicting the Orientation of Invisible Stimuli from Activity in Human Primary Visual Cortex,” Nature Neuroscience, Vol. 8, No. 5, 2005, pp. 686-691. doi:10.1038/nn1445 [16] K. J. Friston, C. Frith, F. P. Liddle and R. S. J. Frack- owiak, “Functional Connectivity: The Principal-Compo- nent Analysis of Large (PET) Data Sets,” Journal of Ce- rebral Blood Flow & Metabolism, Vol. 13, No. 1, 1993, pp. 5-14. [17] E. T. Bullmore, S. Rabe-Hesketh, R. G. Morris, S. C. R. Williams, L. Gregory, J. A. Gray and M. J. Brammer, “Functional Magnetic Resonance Image Analysis of a Large-Scale Neurocognitive Network,” NeuroImage, Vol. 4, No. 1, 1996, pp. 16-33. doi:10.1006/nimg.1996.0026 [18] P. Talairach and J. Tournoux, “A Stereotactic Coplanar Atlas of the Human Brain,” Thieme Publishers, Stuttgart, 1988. [19] B. Schölkopf and A. Smola, “Learning with Kernels: Support Vector Machines, Regularization, Optimization, and Beyond,” MIT Press, Cambridge, 2002. [20] T. Nichols and A. Holmes, “Nonparametric Permutation Tests for Functional Neuroimaging: A Primer with Ex- amples,” Human Brain Mapping, Vol. 15, No. 1, 2002, pp. 1-25. doi:10.1002/hbm.1058 [21] D. M. Allen, “The Relationship between Variable Selec- tion and Data Augmentation and a Method for Predic- tion,” Technometrics, Vol. 16, No. 1, 1974, pp. 125-127. doi:10.2307/1267500 [22] K. J. Friston, “Statistical Parametric Mapping and Other Analysis of Functional Imaging Data. Brain Mapping: The Methods,” Academic Press, Cambridge, 1996. [23] M. P. Eckert, G. Buchsbaum and A. B. Watson, “Separa- bility of Spatiotemporal Spectra of Image Sequences,” IEEE Transactions on Pattern Analysis and Machine In- telligence, Vol. 14, No. 12, 1992, pp. 1210-1213. doi:10. 1109/34.177387 [24] L. Zeng, H. F. Chen, L. Ouyang, D. Z. Yao and J. H. Gao, “Quantitative Analysis of Asymmetrical Cortical Activity in Motor Areas during Sequential Finger Movement,” Magnetic Resonance Imaging, Vol. 25, No. 10, 2007, pp. 1370-1375. doi:10.1016/j.mri.2007.03.024 |