S. A. KHAN ET AL.
Copyright © 2013 SciRes. EPE
428
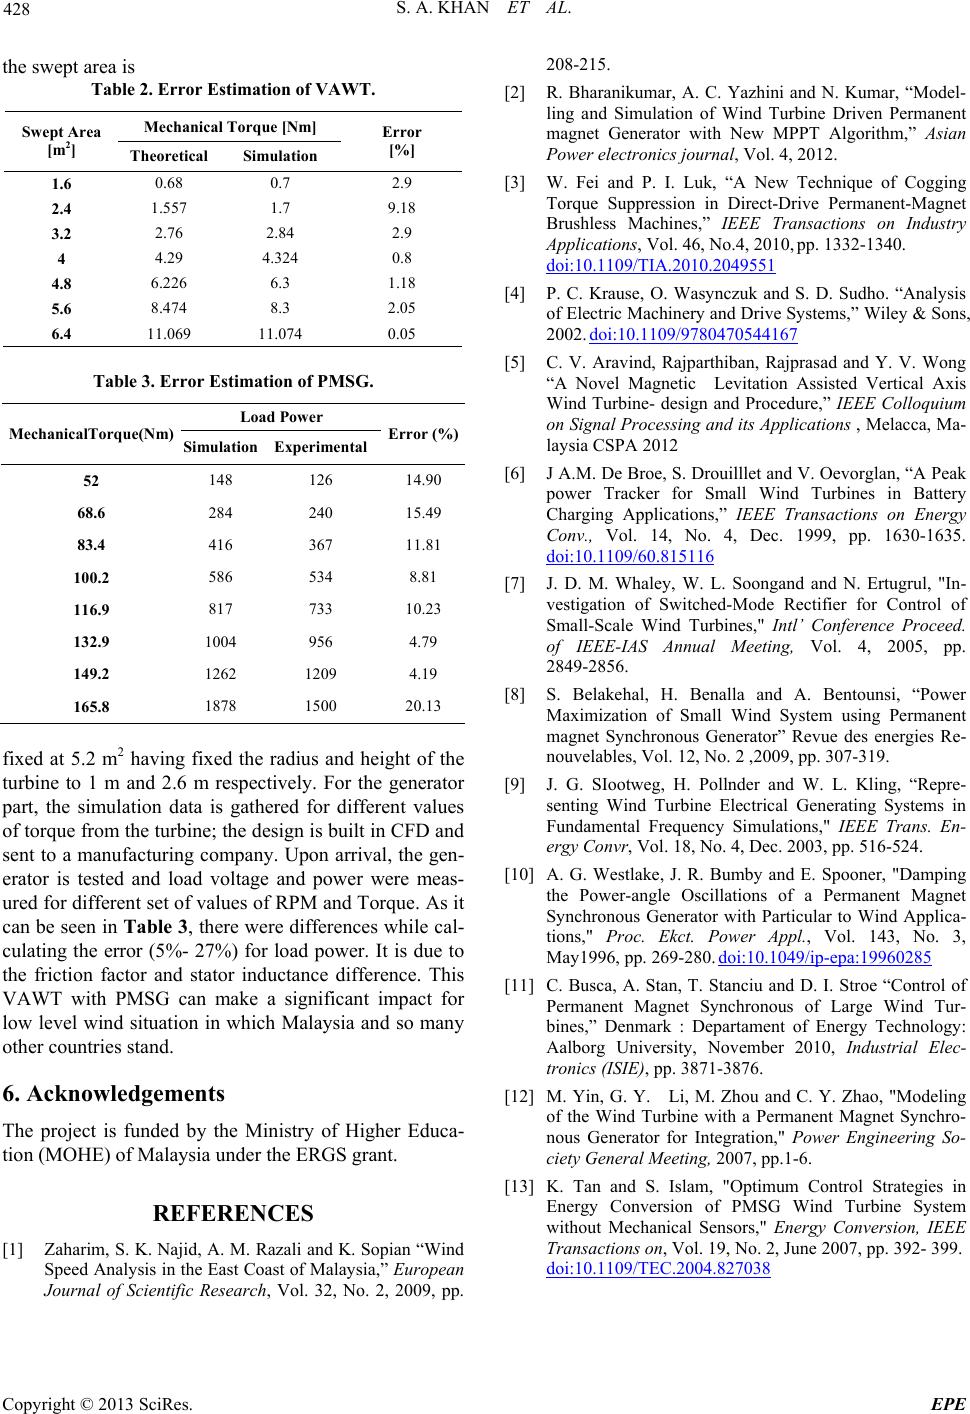
the swept area is
Table 2. Error Estimation of VAWT.
Mechanical Torque [Nm]
Swept Area
[m2] Theoretical Simulation
Error
[%]
1.6 0.68 0.7 2.9
2.4 1.557 1.7 9.18
3.2 2.76 2.84 2.9
4 4.29 4.324 0.8
4.8 6.226 6.3 1.18
5.6 8.474 8.3 2.05
6.4 11.069 11.074 0.05
Table 3. Error Estimation of PMSG.
Load Power
MechanicalTorque(Nm) Simulation Experimental Error (%)
52 148 126 14.90
68.6 284 240 15.49
83.4 416 367 11.81
100.2 586 534 8.81
116.9 817 733 10.23
132.9 1004 956 4.79
149.2 1262 1209 4.19
165.8 1878 1500 20.13
fixed at 5.2 m2 having fixed the radius and height of the
turbine to 1 m and 2.6 m respectively. For the generator
part, the simulation data is gathered for different values
of torque from the turbine; the design is built in CFD and
sent to a manufacturing company. Upon arrival, the gen-
erator is tested and load voltage and power were meas-
ured for different set of values of RPM and Torque. As it
can be seen in Table 3, there were differences while cal-
culating the error (5%- 27%) for load power. It is due to
the friction factor and stator inductance difference. This
VAWT with PMSG can make a significant impact for
low level wind situation in which Malaysia and so many
other countries stand.
6. Acknowledgements
The project is funded by the Ministry of Higher Educa-
tion (MOHE) of Malaysia under the ERGS grant.
REFERENCES
[1] Zaharim, S. K. Najid, A. M. Razali and K. Sopian “Wind
Speed Analysis in the East Coast of Malaysia,” European
Journal of Scientific Research, Vol. 32, No. 2, 2009, pp.
208-215.
[2] R. Bharanikumar, A. C. Yazhini and N. Kumar, “Model-
ling and Simulation of Wind Turbine Driven Permanent
magnet Generator with New MPPT Algorithm,” Asian
Power electronics journal, Vol. 4, 2012.
[3] W. Fei and P. I. Luk, “A New Technique of Cogging
Torque Suppression in Direct-Drive Permanent-Magnet
Brushless Machines,” IEEE Transactions on Industry
Applications, Vol. 46, No.4, 2010, pp. 1332-1340.
doi:10.1109/TIA.2010.2049551
[4] P. C. Krause, O. Wasynczuk and S. D. Sudho. “Analysis
of Electric Machinery and Drive Systems,” Wiley & Sons,
2002. doi:10.1109/9780470544167
[5] C. V. Aravind, Rajparthiban, Rajprasad and Y. V. Wong
“A Novel Magnetic Levitation Assisted Vertical Axis
Wind Turbine- design and Procedure,” IEEE Colloquium
on Signal Processing and its Applications , Melacca, Ma-
laysia CSPA 2012
[6] J A.M. De Broe, S. Drouilllet and V. Oevorglan, “A Peak
power Tracker for Small Wind Turbines in Battery
Charging Applications,” IEEE Transactions on Energy
Conv., Vol. 14, No. 4, Dec. 1999, pp. 1630-1635.
doi:10.1109/60.815116
[7] J. D. M. Whaley, W. L. Soongand and N. Ertugrul, "In-
vestigation of Switched-Mode Rectifier for Control of
Small-Scale Wind Turbines," Intl’ Conference Proceed.
of IEEE-IAS Annual Meeting, Vol. 4, 2005, pp.
2849-2856.
[8] S. Belakehal, H. Benalla and A. Bentounsi, “Power
Maximization of Small Wind System using Permanent
magnet Synchronous Generator” Revue des energies Re-
nouvelables, Vol. 12, No. 2 ,2009, pp. 307-319.
[9] J. G. SIootweg, H. Pollnder and W. L. Kling, “Repre-
senting Wind Turbine Electrical Generating Systems in
Fundamental Frequency Simulations," IEEE Trans. En-
ergy Convr, Vol. 18, No. 4, Dec. 2003, pp. 516-524.
[10] A. G. Westlake, J. R. Bumby and E. Spooner, "Damping
the Power-angle Oscillations of a Permanent Magnet
Synchronous Generator with Particular to Wind Applica-
tions," Proc. Ekct. Power Appl., Vol. 143, No. 3,
May1996, pp. 269-280. doi:10.1049/ip-epa:19960285
[11] C. Busca, A. Stan, T. Stanciu and D. I. Stroe “Control of
Permanent Magnet Synchronous of Large Wind Tur-
bines,” Denmark : Departament of Energy Technology:
Aalborg University, November 2010, Industrial Elec-
tronics (ISIE), pp. 3871-3876.
[12] M. Yin, G. Y. Li, M. Zhou and C. Y. Zhao, "Modeling
of the Wind Turbine with a Permanent Magnet Synchro-
nous Generator for Integration," Power Engineering So-
ciety General Meeting, 2007, pp.1-6.
[13] K. Tan and S. Islam, "Optimum Control Strategies in
Energy Conversion of PMSG Wind Turbine System
without Mechanical Sensors," Energy Conversion, IEEE
Transactions on, Vol. 19, No. 2, June 2007, pp. 392- 399.
doi:10.1109/TEC.2004.827038