Journal of Signal and Information Processing, 2013, 4, 132-137
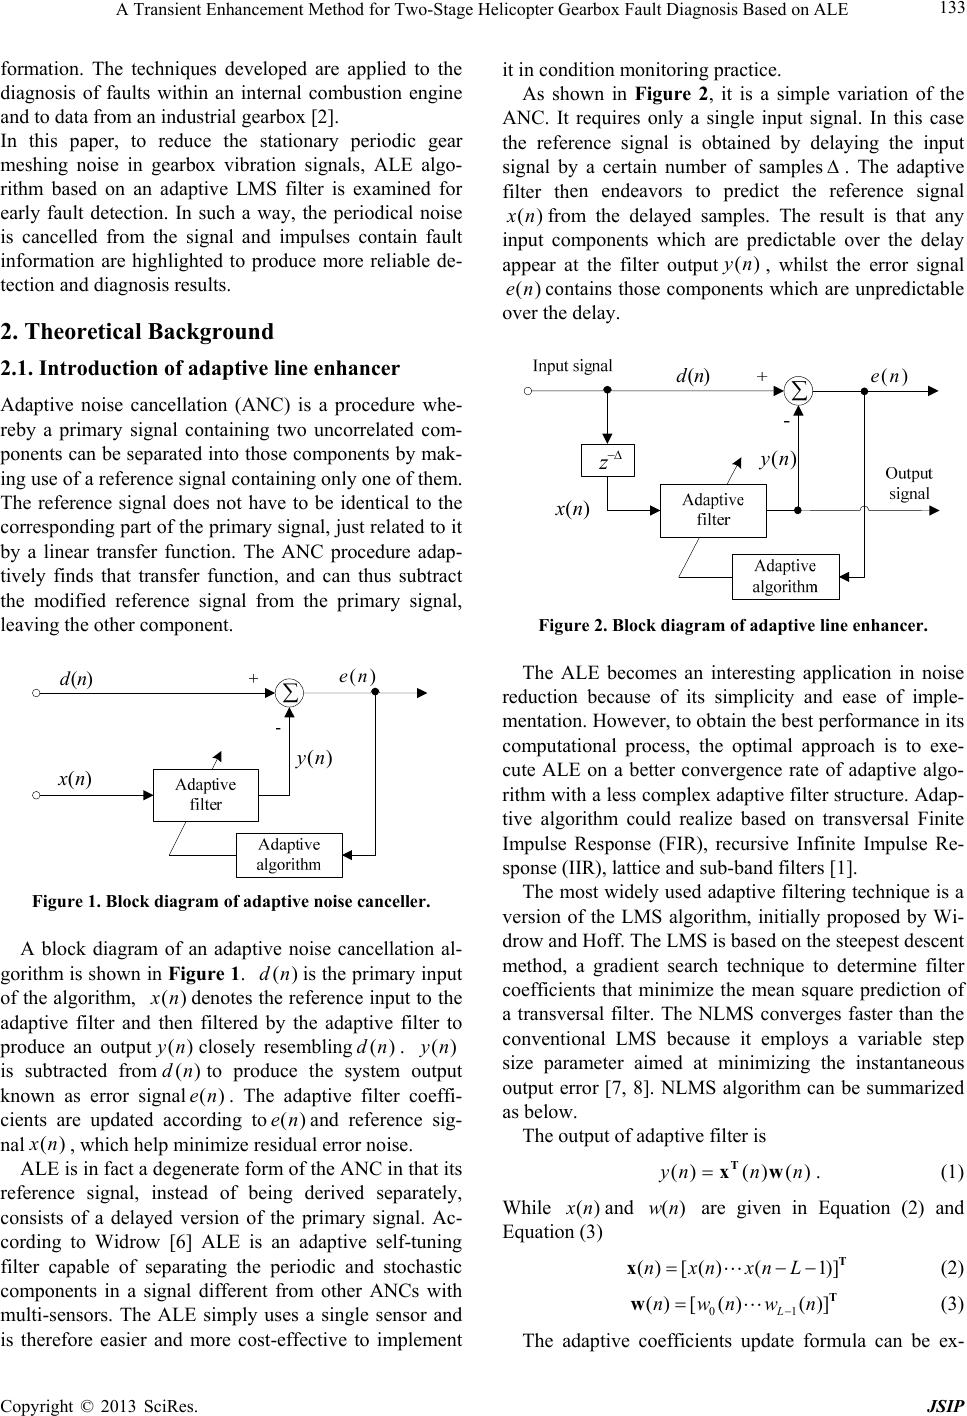
doi:10.4236/jsip.2013.43B023 Published Online August 2013 (http://www.scirp.org/journal/jsip)
A Transient Enhancement Method for Two-Stage
Helicopter Gearbox Fault Diagnosis Based on ALE
Xiange Tian1, Tie Wang2, Zhi Chen2, Fengshou Gu1, Andrew Ball1
1Centre for Efficiency and Performance Engineering, University of Huddersfield, Huddersfield, UK; 2Department of Vehicle Engi-
neering, Taiyuan University of Technology Taiyuan, Shanxi Province, China.
Email: F.Gu@hud.ac.uk, u1178848@hud.ac.uk
Received April, 2013.
ABSTRACT
Periodical impulse component is one of typical fault characteristics in vibration signals from rotating machinery. How-
ever, this component is very small in the early stage of the fault and masked by various noises such as gear meshing
components modulated by shaft frequency, which make it difficult to extract accurately for fault detection. The adaptive
line enhancer (ALE) is an effective technique for separating sinusoidals from broad-band components of an input signal
for detecting the presence of sinusoids in white noise. In this paper, ALE is explored to suppress the periodical gear
meshing frequencies and enhance the fault feature impulses for more accurate fault diagnosis. The results obtained from
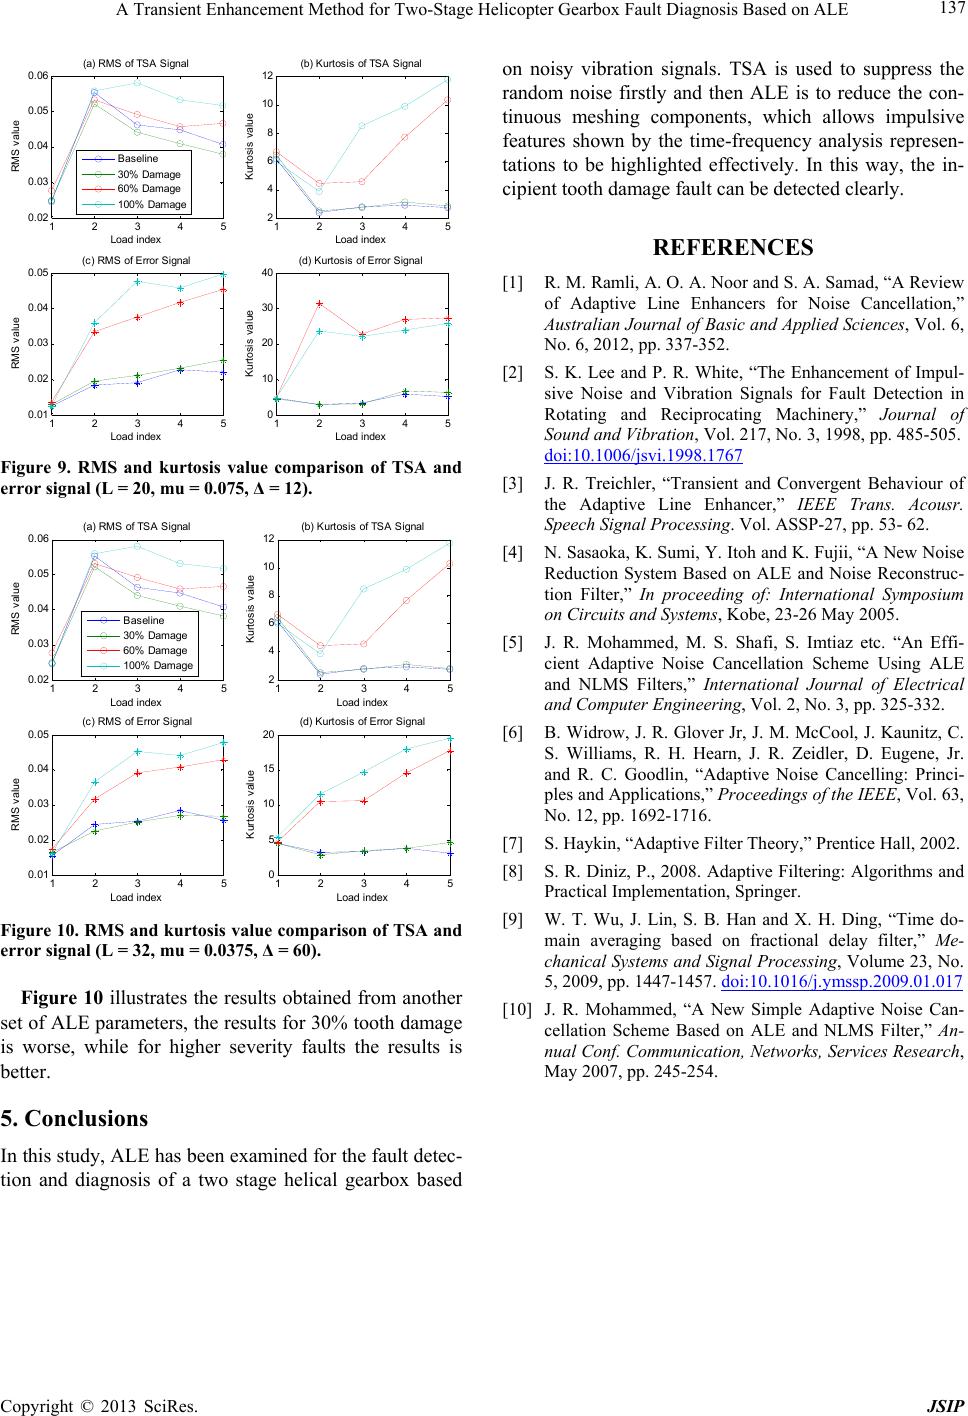
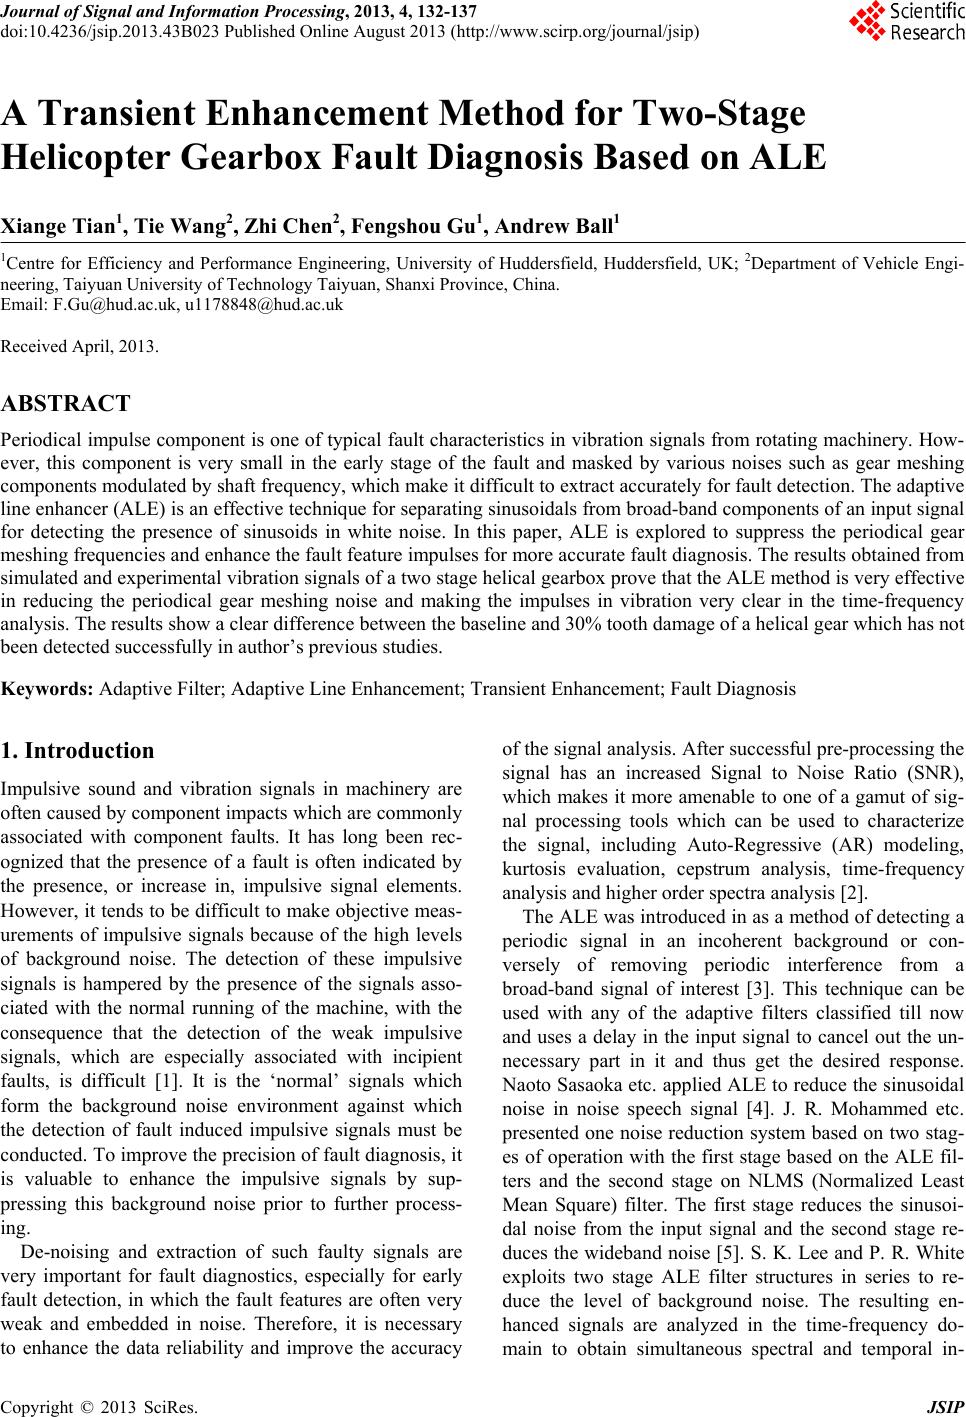
simulated and experimental vibration signals of a two stage helical gearbox prove that the ALE method is very effective
in reducing the periodical gear meshing noise and making the impulses in vibration very clear in the time-frequency
analysis. The results show a clear difference between the baseline and 30% tooth damage of a helical gear which has not
been detected successfully in author’s previous studies.
Keywords: Adaptive Filter; Adaptive Line Enhancement; Transient Enhancement; Fault Diagnosis
1. Introduction
Impulsive sound and vibration signals in machinery are
often caused by component impacts which are commonly
associated with component faults. It has long been rec-
ognized that the presence of a fault is often indicated by
the presence, or increase in, impulsive signal elements.
However, it tends to be difficult to make objective meas-
urements of impulsive signals because of the high levels
of background noise. The detection of these impulsive
signals is hampered by the presence of the signals asso-
ciated with the normal running of the machine, with the
consequence that the detection of the weak impulsive
signals, which are especially associated with incipient
faults, is difficult [1]. It is the ‘normal’ signals which
form the background noise environment against which
the detection of fault induced impulsive signals must be
conducted. To improve the precision of fault diagnosis, it
is valuable to enhance the impulsive signals by sup-
pressing this background noise prior to further process-
ing.
De-noising and extraction of such faulty signals are
very important for fault diagnostics, especially for early
fault detection, in which the fault features are often very
weak and embedded in noise. Therefore, it is necessary
to enhance the data reliability and improve the accuracy
of the signal analysis. After successful pre-processing the
signal has an increased Signal to Noise Ratio (SNR),
which makes it more amenable to one of a gamut of sig-
nal processing tools which can be used to characterize
the signal, including Auto-Regressive (AR) modeling,
kurtosis evaluation, cepstrum analysis, time-frequency
analysis and higher order spectra analysis [2].
The ALE was introduced in as a method of detecting a
periodic signal in an incoherent background or con-
versely of removing periodic interference from a
broad-band signal of interest [3]. This technique can be
used with any of the adaptive filters classified till now
and uses a delay in the input signal to cancel out the un-
necessary part in it and thus get the desired response.
Naoto Sasaoka etc. applied ALE to reduce the sinusoidal
noise in noise speech signal [4]. J. R. Mohammed etc.
presented one noise reduction system based on two stag-
es of operation with the first stage based on the ALE fil-
ters and the second stage on NLMS (Normalized Least
Mean Square) filter. The first stage reduces the sinusoi-
dal noise from the input signal and the second stage re-
duces the wideband noise [5]. S. K. Lee and P. R. White
exploits two stage ALE filter structures in series to re-
duce the level of background noise. The resulting en-
hanced signals are analyzed in the time-frequency do-
main to obtain simultaneous spectral and temporal in-
Copyright © 2013 SciRes. JSIP
A Transient Enhancement Method for Two-Stage Helicopter Gearbox Fault Diagnosis Based on ALE 133
formation. The techniques developed are applied to the
diagnosis of faults within an internal combustion engine
and to data from an industrial gearbox [2].
In this paper, to reduce the stationary periodic gear
meshing noise in gearbox vibration signals, ALE algo-
rithm based on an adaptive LMS filter is examined for
early fault detection. In such a way, the periodical noise
is cancelled from the signal and impulses contain fault
information are highlighted to produce more reliable de-
tection and diagnosis results.
2. Theoretical Background
2.1. Introduction of adaptive line enhancer
Adaptive noise cancellation (ANC) is a procedure whe-
reby a primary signal containing two uncorrelated com-
ponents can be separated into those components by mak-
ing use of a reference signal containing only one of them.
The reference signal does not have to be identical to the
corresponding part of the primary signal, just related to it
by a linear transfer function. The ANC procedure adap-
tively finds that transfer function, and can thus subtract
the modified reference signal from the primary signal,
leaving the other component.
)(ny
)(nd
)(ne
)(nx
Figure 1. Block diagram of adaptive noise canceller.
A block diagram of an adaptive noise cancellation al-
gorithm is shown in Figure 1. is the primary inpu t
of the algorithm, ()dn
()
x
n
()yn
(dn
denotes the reference input to the
adaptive filter and then filtered by the adaptive filter to
produce an outputclosely resembling.
is subtracted from to produce the system output
known as error signal. The adaptive filter coeffi-
cients are updated according toand reference sig-
nal
()dn ()yn
)
(en)(en)
()
x
n, which help minimize residual error noise.
ALE is in fact a degenerate form of the ANC in that its
reference signal, instead of being derived separately,
consists of a delayed version of the primary signal. Ac-
cording to Widrow [6] ALE is an adaptive self-tuning
filter capable of separating the periodic and stochastic
components in a signal different from other ANCs with
multi-sensors. The ALE simply uses a single sensor and
is therefore easier and more cost-effective to implement
it in condition monitoring practice.
As shown in Figure 2, it is a simple variation of the
ANC. It requires only a single input signal. In this case
the reference signal is obtained by delaying the input
signal by a certain number of samples. The adaptive
filter then endeavors to predict the reference signal
()
x
n
()en
from the delayed samples. The result is that any
input components which are predictable over the delay
appear at the filter output, whilst the error signal
contains those components which are unpredictable
over the delay.
()yn
)(ny
)(nd
)(ne
)(nx

z
Figure 2. Block diagram of adaptive line enhancer.
The ALE becomes an interesting application in noise
reduction because of its simplicity and ease of imple-
mentation. However, to obtain th e best perfor mance in its
computational process, the optimal approach is to exe-
cute ALE on a better convergence rate of adaptive algo-
rithm with a less complex adaptive filter structure. Adap-
tive algorithm could realize based on transversal Finite
Impulse Response (FIR), recursive Infinite Impulse Re-
sponse (IIR), lattice and sub-band filters [1].
The most widely used adaptive filtering technique is a
version of the LMS algorithm, initially proposed by Wi-
drow and Hoff. The LMS is based on the steepest descent
method, a gradient search technique to determine filter
coefficients that minimize the mean square prediction of
a transversal filter. The NLMS converges faster than the
conventional LMS because it employs a variable step
size parameter aimed at minimizing the instantaneous
output error [7, 8]. NLMS algorithm can be summarized
as below.
The output of adaptive filter is
()() ()ynn nT
xw
. (1)
While ()
x
nand are given in Equation (2) and
Equation (3) ()wn
() [()(1)]nxnxnL
Τ
x
Τ
(2)
01
() [()()]
L
nwnwn
w (3)
The adaptive coefficients update formula can be ex-
Copyright © 2013 SciRes. JSIP
A Transient Enhancement Method for Two-Stage Helicopter Gearbox Fault Diagnosis Based on ALE
134
pressed as
2
()( 1)()()
()
nn ne
n

ww x
xn
()() ()endn yn
(4)
(5)
where the error signalis given by Equation (5),
()en
is
the step size parameter which controls the convergence
speed and the stability of the filter and
is a small con-
stant in order to prevent division by zero in case no input
signal is present.
2.2. Time Synchronous Average
In experimental vibration, there are high levels of ran-
dom noises which will affect the accuracy of fault diag-
nosis, especially random impulses which can confuse the
periodicity of fault impulses. In this study, time syn-
chronous aver age (TSA) technique is applied to supp ress
the random noises. TSA resamples the vibration data
synchronously according to the angle of rotation. When
taken over many machine cycles, this technique removes
background noise and nonsynchronous events such as
transients and meshing components from other gear
transmission stages) in the vibration signal. This tech-
nique is extremely useful where multiple shafts those are
operating at only slightly different speeds and in close
proximity to one another are being monitored. A refer-
ence signal (usually from a tachometer) is always needed.
However, it can be inefficient at reducing some tonal
components of the background noise, i.e., those that are
commensurate (or nearly commensurate) with the rota-
tional frequency.
Assuming a signal ()
x
n consists of a periodic signal
()
T
x
n
()
T
and a noisy component, the period of ()vn
x
nis 0 whose corresponding frequency isT0
f
, thus
the signal can be expressed [9].
()() ()
T
nxnvn (6)
The synchronou s av er age of the signal()
x
nby using TSA
can be expressed as
1
0
1
1
()( )
M
i
y
nxt
M

iT (7)
where
M
is the number of the average segments, is
the averaged signal. ()yn
3. Signal Processing Methods
3.1. Denoising Scheme
The principle of the ALE [10] used to reduce sinusoids
will be described in this section based on the block dia-
gram given in Figure 2.
The primary input and reference input signals of the
system are given by
() () ()dn snn
(8)
()()()(xn dnsnn)
 
)
(9)
where (
s
nis the fault impulse signal, ()n
represents
the sinusoidal noise and
is time delay factor. Since the
short time duration of impulses, the autocorrelation of
impulses fades as
increases. On the other hand, the
delayed sinusoidal noise(n)
 is correlated with()n
.
Thus, when the adaptive filter stable, ()n
may be esti-
mated by the output of adaptive filterand the im-
pulse components in error signalare enhanced com-
paring with desired signal.
()yn
()en
()dn
()() ()
ˆ
() ()
ˆ
() () ()
endn yn
dn n
s
nnn



(10)
The cost function of NLMS algorithm is defined as

 

2
2
() () ()
()2()(() ())
() ()
Esnn yn
EsnEsnnyn
Enyn

 

2
2
2
()() ()Ee nEdnyn



(11)
Since the fault signal is uncorrelated with noise,
()(()())0nnyn
Es
. Then, Equation (11) becomes
22
2()()() ()Ee nEsnEnyn



2
[()]Ee n
(12)
Minimize is equivalent to minimize
. Therefore, the convergence of algo-
rithm will causeto be the minimum mean-square
estimation of
2
)]n()yn
()n
[() (Eny
.
There are three important parameters in ALE, the step
size
, the length of filter and the number of delay sam-
ples.
is the step size parameter controlling the conver-
gence rate within its suitable range. The step size value
affects the convergence behavior of an LMS filter; a too
low value of
leads to extremely long convergence time
of the algorithm, whereas a too high value of
causes
the algorithm to diverge, thus degrading the error per-
formance of the adaptive filter. Therefore, choosing a
suitable value for the step size is necessary when imple-
menting the LMS algorithm as an adaptive filter.
The periodic nature of the impulsive signal lays open
the possibility that the first stage of the scheme will iden-
tify them with the narrowband components and in doing
so attenuate them. To avoid such an eventuality care over
the choice of the parametersand must be exercised.
From reference [5], the length of filter must satisfy the
condition in Equation (14), where
L
p
Tis the period of the
Copyright © 2013 SciRes. JSIP
A Transient Enhancement Method for Two-Stage Helicopter Gearbox Fault Diagnosis Based on ALE 135
signal. 2
p
LT (14)
3.2. Parameters Selection Method
In this part, the selection method of ALE parameters ap-
plied in this paper is introduced.
05 10 15 20
2
4
6
8
10
12
14
Delay factor
Kurto s is v alue
L=16
05 10 15 20
0
5
10
15
20
Delay factor
Kurto s is v alue
L=32
05 10 15 20
0
5
10
15
20
Delay factor
Kurtosis v alue
L=64
05 10 15 20
0
5
10
15
20
Delay factor
Kurtosis v alue
L=128
0.05
0.1
0.3
0.5
0.7
0.9
Figure 3. Kurtosis values under varies parameters.
Figure 4. Time-frequency analysis results.
Kurtosis is used in engineering for detection of fault
symptoms because it is sensitive to sharp variant struc-
tures, such as impulses. The bigger the impulse in signal,
the larger the kurtosis is. The kurtosis value comparison
of signals after ALE processing based on different pa-
rameter sets are shown in Figure 3. The green line indi-
cates the kurtosis value of signal before ALE processing.
Different line colors and style represent different
val-
ues, L indicates the length of adaptive filter and delay
factor is
.
From Figure 3, it is obvious that kurtosis values are
increased after ALE. To compare the impulse enhance-
ment effects, the parameter sets which corresponding to
maximum kurtosis under each L is selected for compari-
son. Then, the signals are analyzed in time-frequency
domain.
Figure 4 illustrates the time-frequency analysis com-
parison between original signal and signals after ALE
based on four different parameter sets. Figure 4(a) plots
the original signal and Figures 4(b)-(e) give out the ALE
results while the parameters are selected by maximum
kurtosis criteria in Figure 3 under the four filter length
16, 32, 64 and 128, separately. It can be seen that the
main periodic components at 1500Hz and 2500Hz are
reduced greatly after ALE and the other components
which are smaller can be observed clearly. It is obviously
that the result in Figure 4(e), which corresponds to the
maximum kurtosis value parameter set in Figure 3, can
reveal the nonstationary components better than other
three parameter sets. So the kurtosis maximization crite-
rion is applied to choose ALE parameters in the follow-
ing machine fault diagnosis.
4. Signal Processing Results
The practical gearbox experimental vibration signals
collected when the gearbox operated under five different
loads and four cases (Healthy, 30% tooth break, 60%
tooth break and 100% tooth break).
00.05 0.10.15 0.2
-1
0
1
Tim e(s)
A cceleration(m /s
2
)
Baseline
00.05 0.10.15 0.2
-1
0
1
Tim e(s)
Acceleration(m/s
2
)
30% Damage
00.05 0.10.15 0.2
-1
0
1
Tim e(s)
Acceleration(m/s
2
)
60% Damage
00.05 0.10.15 0.2
-1
0
1
Tim e(s)
Acceleration(m/s
2
)
100% Damage
Figure 5. Raw vibration signal in time domain.
Copyright © 2013 SciRes. JSIP
A Transient Enhancement Method for Two-Stage Helicopter Gearbox Fault Diagnosis Based on ALE
136
00.05 0.10.15 0.2
-0. 5
0
0.5
Time(s)
Acceleration(m/s2)
Baseline
00.05 0.10.15 0.2
-0. 5
0
0.5
Time(s)
Accel eration(m /s2)
30% Damage
00.05 0.10.15 0.2
-0. 5
0
0.5
Time(s)
Acceleration(m/s2)
60% Damage
00.05 0.10.15 0.2
-0. 5
0
0.5
Time(s)
Acceleration(m/s2)
100% Damage
Figure 6. TSA vibration signal in time domain.
Figure 5 gives out the raw vibration data for four cas-
es under load 3, where the baseline is the healthy case.
Figure 6 shows the TSA results of the vibration signals
given out in Fig. 3 for five revolutions of the input shaft.
It can be seen that the impulse components of the vibra-
tion signals are highlighted for all the test conditions.
TSA signals show much clearer indication of the 60%
and 100% tooth damage compared with the baseline and
30% tooth damage. However the signals between the
baseline and 30% tooth damage cannot be observed with
noticeable differences.
To evaluate the denoise effect of ALE algorithm, Fig-
ure 7 and Figure 8 give out the time-frequency analysis
results comparison , take the signal under the 4th load as
example, signals under other loads have similar per-
formance.
As shown in Figure 8, there are several periodical
modulation frequencies generated by rotation of machine
and can be seen as background noise at about 1500Hz,
3000Hz and 4500Hz. The purpose of ALE is to remove
these frequencies. The TSA signals also contain impulse
components which are short duration and periodical con-
tents for certain frequencies which are spread over the
time direction. These components carry the fault infor-
mation of gearbox tooth break damage. Figure 8 shows
the results after the ALE processing. It can be seen that
the modulation frequencies are reduced significantly. The
results show that ALE is effective in reducing sinusoids
and extract impulses from wide band periodical noises.
For a detailed comparison, two common feature pa-
rameters: root mean square (RMS) and kurtosis are cal-
culated from the TSA vibration signals ALE errors sig-
nals. As shown in Figure 9(a), RMS is not able to sepa-
rate the four cases over different loads. Comparing with
the baseline and 30% tooth damage, in Figure 9(b), the
kurtosis values of 60% tooth damage and 100% tooth
damage is clearly separated from the other two cases
except the first load. However, the difference between
the baseline and 30% tooth damage is not very obvious
for fault separation. Figure 9(c) and Figure 9(d) illus-
trate the RMS and kurtosis value comparison from the
error signal which is the signal after ALE denoising
processing. From the RMS value comparison of error
signal, there are differences between all loads except the
first and all four fault cases which gives out clear differ-
ence compared with TSA signal. The kurtosis value of
error signal is much higher than that of TSA signal, when
means the proportion of impulses is enhanced. But the
difference between kurtosis values of different fault cases
is not so clearly as the RMS value of error signal.
Figure 7. TSA vibration signals in time-frequency domain.
Figure 8. Signals after ALE in time-frequency domain.
Copyright © 2013 SciRes. JSIP
A Transient Enhancement Method for Two-Stage Helicopter Gearbox Fault Diagnosis Based on ALE
Copyright © 2013 SciRes. JSIP
137
12345
0. 02
0. 03
0. 04
0. 05
0. 06
Load inde x
RM S valu e
(a) RMS of TSA Si gnal
Baseline
30% Dam age
60% Dam age
100% Dam age
12345
2
4
6
8
10
12
Load inde x
Kurtosis value
(b) Kurt osis of TSA Si gnal
12345
0. 01
0. 02
0. 03
0. 04
0. 05
Load inde x
RM S value
(c ) RMS of E rror S i gnal
12345
0
10
20
30
40
Load inde x
Kurtosis v alue
(d) K urtosis o f Erro r S i gn al
Figure 9. RMS and kurtosis value comparison of TSA and
error signal (L = 20, mu = 0.075, Δ = 12).
1 2 3 45
0. 02
0. 03
0. 04
0. 05
0. 06
Load index
RMS value
(a) RMS of TSA Signal
Baseline
30% Damage
60% Damage
100% Damage
12 34 5
2
4
6
8
10
12
Load index
Kurtosis value
(b) K urto si s of TSA Si g nal
1 2 3 45
0. 01
0. 02
0. 03
0. 04
0. 05
Load index
RMS value
(c) RM S of E rror Si gnal
12 34 5
0
5
10
15
20
Load index
Kurtosis value
(d) K urtosi s of E rro r S i gn al
Figure 10. RMS and kurtosis value comparison of TSA and
error signal (L = 32, mu = 0.0375, Δ = 60).
Figure 10 illustrates the results obtained from another
set of ALE parameters, the results for 30% tooth damage
is worse, while for higher severity faults the results is
better.
5. Conclusions
In this study, ALE has been examined for the fault detec-
tion and diagnosis of a two stage helical gearbox based
on noisy vibration signals. TSA is used to suppress the
random noise firstly and then ALE is to reduce the con-
tinuous meshing components, which allows impulsive
features shown by the time-frequency analysis represen-
tations to be highlighted effectively. In this way, the in-
cipient tooth damage fault can be detected clearly.
REFERENCES
[1] R. M. Ramli, A. O. A. Noor and S. A. Samad, “A Review
of Adaptive Line Enhancers for Noise Cancellation,”
Austral ian Jou rnal of Basi c and Appl ied Sci ences, Vol. 6,
No. 6, 2012, pp. 337-352.
[2] S. K. Lee and P. R. White, “The Enhancement of Impul-
sive Noise and Vibration Signals for Fault Detection in
Rotating and Reciprocating Machinery,” Journal of
Sound and Vibration, Vol. 217, No. 3, 1998, pp. 485-505.
doi:10.1006/jsvi.1998.1767
[3] J. R. Treichler, “Transient and Convergent Behaviour of
the Adaptive Line Enhancer,” IEEE Trans. Acousr.
Speech Signal Processing. Vol. ASSP-27, pp. 53- 62.
[4] N. Sasaoka, K. Sumi, Y. Itoh and K. Fujii, “A New Noise
Reduction System Based on ALE and Noise Reconstruc-
tion Filter,” In proceeding of: International Symposium
on Circuits and Systems, Kobe, 23-26 May 2005.
[5] J. R. Mohammed, M. S. Shafi, S. Imtiaz etc. “An Effi-
cient Adaptive Noise Cancellation Scheme Using ALE
and NLMS Filters,” International Journal of Electrical
and Computer Engineering, Vol. 2, No. 3, pp. 325-332.
[6] B. Widrow, J. R. Glover Jr, J. M. McCool, J. Kaunitz, C.
S. Williams, R. H. Hearn, J. R. Zeidler, D. Eugene, Jr.
and R. C. Goodlin, “Adaptive Noise Cancelling: Princi-
ples and Applications,” Proceedings of the IEEE, Vol. 63,
No. 12, pp. 1692-1716.
[7] S. Haykin, “Adaptive Filter Theory,” Prentice Hall, 2002.
[8] S. R. Diniz, P., 2008. Adaptive Filtering: Algorithms and
Practical Implementation, Springer.
[9] W. T. Wu, J. Lin, S. B. Han and X. H. Ding, “Time do-
main averaging based on fractional delay filter,” Me-
chanical Systems and Signal Processing, Volume 23, No.
5, 2009, pp. 1447-1457. doi:10.1016/j.ymssp.2009.01.017
[10] J. R. Mohammed, “A New Simple Adaptive Noise Can-
cellation Scheme Based on ALE and NLMS Filter,” An-
nual Conf. Communication, Networks, Services Research,
May 2007, pp. 245-254.