 Energy and Power Engineering, 2013, 5, 398-403 doi:10.4236/epe.2013.54B077 Published Online July 2013 (http://www.scirp.org/journal/epe) The Maximum Power Tracking Method and Reactive Compensation Simulation Research Based on DIgSILENT* Wei Guo, Dong-mei Zhao College of Electrical and Electronic Engineering, North China Electric Power University, Beijing, China Email: guowei890628@163.com Received March, 2013 ABSTRACT This paper studies about the mechanical part of wind turbine and wind generator operation stability.1) It makes a com- parative study of two control methods for maximum power tracking: curve fitting method and hill climbing algorithm, sets up improved control modules in DIgSLIENT and makes comparison research, thus gets the conclusion that the im- proved control modules of hill climbing algorithm has good effect on MPPT, and it is more desirable in the condition of steady wind. 2) This paper sets up SVC and STATCOM models and improved control modules in DIgSLIENT, which are connected to wind power system, verifying the validity of SVC and STATCOM models, and verifying its influence on wind power plant and system. The results of the study show that STATCOM is more helpful in voltage recovery when large disturbance of three-phase short-circuit happened in wind power grid, reactive compensation is more effec- tive. Keywords: Maximum Power Tracking; Hill Climbing Algorithm; SVC; STATCOM; DIgSLIENT 1. Introduction With the rapid development of large wind power genera- tion research, it is more focused that variable speed con- stant-frequency doubly-fed wind power generation tech- nology has the feature of variable speed within compara- bly wide range in maximum power tracking. [7] Dis- cusses a new and simple control method for maximum power tracking in a variable speed wind turbine by using a step-up dc-dc converter [8]. Analyze the wind machine characteristics and maximum wind power captured prin- ciple, proposes a control strategy without measuring wind speed. [5] Reviews the existing maximum wind energy extraction algorithm and develops an intelligent maximum power extraction algorithm. In China, the area that is suitable for large-scale de- velopment of wind power is in a network terminal. The power grid structure in this area is comparably weak, so once connected to grid, large-scale wind power may ap- pear a series of problems, such as voltage decline, in- creasing system short circuit capacity, system transient stability change, etc. Therefore, reactive compensation for power factor improvement is of great practical sig- nificance to voltage stability and improving transmission efficiency. The principle structures and controller models and dynamic compensation effects of SVC and STAT- COM have been discussed in [9-11]. 2. Mathematical Model 2.1. Wind Turbine Model Wind turbine is the component that converting winds energy into mechanical energy. With a certain speed and angle, the effect of wind makes the paddle rotating, and thereby the wind energy turns into mechanical energy, which drives the generator. The process that wind turbine turn wind energy into mechanical energy is a complex aerodynamics process, which is quiet difficult to accu- rately describe. According to Betz' Law, the mechanical power of wind turbine capture is: 32 0.5 p C R (1) In (1), P is the power of wind turbine capture, ρ is air density, R is radius of the turbine blade, and v is wind speed. CP is the wind power utilization coefficient of wind turbine, and its physical meaning is: the percentage of energy absorbed from natural wind by wind rotor and the wind energy contained in undisturbed air within rotor swept area. CP is the function of tip speed ratio λ and pitch angle β . It could be simulated in the following nonlinear function [1]. *The National High Technology Research and Development of China 863 Program (2012AA050201). Copyright © 2013 SciRes. EPE  W. GUO, D.-M. ZHAO 399 12.5/ 1 3 116 (,) 0.22(0.45.0) 10.035 [] 0.08 1 i Pi i Ce R v (2) 2.2. Shaft Model Shaft drive system mainly includes a wind turbine, over- drive gearbox and drive shaft, but generally, overdrive gearbox and wind turbine are equivalent to one mass, doubly-fed generator is one mass, thus shafting drive model with two masses is built. As shown in Figure 1: Two masses model [2] () () GG GGGG wG G ww wwww wG w dw dt dwTw k dt J dw d dwTw k dJ (3) In (3), “w”“G”respectively stand for turbine and generator: θ is the torsion angle of shaft, K is stiffness coefficient, Jw and JG are the inertia time constant of wind turbine and generator, δw andδG are the damping coefficient of wind turbine and generator rotor, Tw is the mechanical torque of wind rotor and TG is the mechani- cal torque effected on rotor shaft of generator. It is known that two masses model of differential variables have four, this will increase the workload, so that influ- ence the simulation speed, therefore we need to simplify the shaft model, a simplified model is that the two inertia time constant are equal to one: W eq G JJN (4) where: N stand for Gear box of variable ratio. So that one mass model equation: G eqw GG dw TT w dt (5) Figure 1. Shaft model diagram.. 2.3. Wind Turbine Model Considering DFIG stator transient process and transient state of system, the increasing of system order is time- consuming, it is necessary to lower the order of generator. As electromagnetic transient state of stator is much rapid than that of rotor, and have less effect on transient stabil- ity of generator, so transient process of stator is ignored, that is, the change of the stator magnetic chain is zero. The voltage equation of DFIG in the two phase synchro- nous speed rotating coordinate system is converted as[3,4]: sdssqs sd sqssds sq rdrdsrqr rq rqrqsrdrrq uRi uRi up sRi up sRi (6) Equation (5) and (6) are combined, a third order equa- tion of wind generator is set. As a third Order model could fully reflect the characteristics of wind power gen- eration in system transient state, precision is acceptable, and calculation speed is fast, and In the DIgSLIENT, wind generator mechanical and electrical transient model is to use the third order model. 3. Wind Energy Capture 3.1. Method Introduced The common control method of MPT could be classified into three types [5]: Tip Speed Ratio, Power Signal Feedback, and Hill-climbing Search. This paper tries to compare wind MPPT control by listing two different realization methods in DIgSLIENT. Method 1[6]: curve fitting method, the optimal power curve of the wind turbine is fitted to the wind turbine speed ω as the independent variable, Power P is the po- lynomial expression of the speed ω, the generator rota- tional speed ω and the power P is a one-to-one relation- ship. Back stepping the actual active output of the wind generation, we can get the corresponding optimal speed as the speed reference value, input the value to speed controller to get the optimal power reference value, and then input to the active control system of doubly-fed generation as the reference active power value. Speed controller role: the difference of the speed reference val- ue and the measured values of the generator speed is the error value, the value input PI controller to obtain active power reference value. If the actual speed is equal to ref- erence speed value, speed controller input signal is 0 which means it doesn't work; if not, speed controller will conduct continuous control until the wind generator out- put the corresponding optimal power. So the realization of the function the maximum wind power capture is in turn depend on the maximum power tracking module, Copyright © 2013 SciRes. EPE  W. GUO, D.-M. ZHAO 400 speed controller and doubly-fed motor power control. As shown in Figure 2: Method 2[7, 8]: constant step hill climbing algorithm is local optimization algorithm, The specific algorithm is as follows: First of all, the initial reference motor speed ω and active power P are given. Secondly, by observing the changes in P and ω, compare with previous P and ω to get the trend of the P and ω to decide positive and negative of the step: If the trends of the two variables are the same, then the calculated out step is positive. At last, the current step plus the previous cycle of reference value will get a new reference value. Implementation: in the control cycle interval n and n-1 time in the control cycle, Sampling the P and ω and Ob- servation of the current P and ω. If P increases, main- taining step ωstep direction, or else makes the step length ωstep inverting. Finally, the current ωstep plus the previous cycle of reference speed command will obtain a new ref- erence value, the reference speed value input to speed controller and reference active power value is obtained by the PI controller, and then input to the active power controller of the DFIG. As shown in Fi gure 3: Calculation △P,△ωand the next moment of refer- ence speed: ()( 1) ()( 1) ()(1)()( ) ref refstep dP Pn Pn dw wnwn wnwnsignPsignww (7) where: if x≥0,sign(x) = 1; if x<0,sign(x) = -1. Repeating the appeal process: change generator speed, until the unit output power is no longer sensitive to sys- tem parameter. Figure 2. MPT and Speed controller model structure. Figure 3. hill climbing algorithm structure diagram. If power change is zero, the system has achieved the current wind speed of the maximum power point. 3.2. Example Comparison 1) The MPPT condition in constant wind speed 13 m/s, the comparison of two MPPT results: Conclusion: The coordinate system in the above two graphs ranges from 0.8984 to 0.8992. Results can be seen that the precision of the two methods has met the re- quirements, because the interval range retains 3 digits after the decimal point. In the curve fitting method, out- put power reference still presents approximate linear in- crease in a very small range; while in the hill climbing algorithm, the reference presents slight fluctuations. It is obvious that the wave output in the hill climbing algo- rithm is more stable, making the active output of wind turbine followed active power reference more stable, which solve the problem that power is output fast and smoothly in the stable wind speed condition. 2) The MPPT condition: 0 s -17 s wind speed keeps 10 m/s, 17 s wind speed jump to 15 m/s, the comparison of two MPPT results: Conclusion: Large changes in wind speed, hill climb- ing algorithms fluctuations are much larger than the curve fitting method from the Figure 6 and Figure 7. At Figure 4. Pref value output by curve fitting method. Figure 5. Pref value output by hill climbing algorithm. Figure 6. Pref value output by curve fitting method. Copyright © 2013 SciRes. EPE  W. GUO, D.-M. ZHAO 401 Figure 7. Pref value output by hill climbing algorithm. 17 s, the wind speed suddenly increases. In the hill climbing algorithm, the output power reference value fluctuations from 0.9p.u. to 0.975 p.u., however, in the curve fitting method, the output reference value just fluctuations from 0.899p.u. to 0.92 p.u.. But, in the hill climbing algorithm, over time is short, and it takes ap- proximately 30 seconds to reaches a steady state, while in the curve fitting method it’s about 40 seconds to reach a steady state. So it can be concluded that the constant step hill climbing algorithm applies winds less volatile condition, and the wind turbine of the inertia can not be too large, otherwise not timely tracking to the best power point. 4. Reactive Compensation In the short circuit fault process, the wind generator will trigger rotor protection, which will make the wind gen- erator asynchronous running in a short time. Thus, the continuous wind generator running need to absorb a large amount of reactive power, which can reduce the grid stability and the power factor of system, and in addition, the increase of line loss. Therefore, reactive compensa- tion will have a great practical significance of improving the steady-state and dynamic performance of wind power generation system. This paper will make brief introduc- tion and analog simulation of the control of two reactive compensation devices SVC and STATCOM which are widely applied. 4.1. STATCOM The STATCOM's basic principle is the self-commutated bridge circuit that is connected with capacitor, through resistance and reactance or direct connects to the grid. According to the DC voltage of the capacitance and AC voltage of the access point, properly adjust the amplitude and phase of the AC output voltage of the bridge circuit to make absorption or generation reactive current of the circuit meet the system requirements, thus achieve the purpose of dynamic reactive power compensation. As Figure 8 shown, observing the amplitude and the phase of the AC voltage signal of the STATCOM con- nected bus. The amplitude difference with the set refer- ence value, differences through the PI control become the signal which can control the PWM, but firstly the signal need connect to a limiter, then input to the PWM. At the same time, the phase angle of the phase-locked loop measurements that is use to make modulation wave syn- chronized with the system. Both of them control PWM, so that the phase of the PWM output modulated wave change to Trigger fully controlled devices (GTO/IGBT) which is in each leg of the three-phase inverter bridge off or on. So the AC side of STATCOM changes its reactive current to follow the command current Iref. 4.2. SVC (Static Var Compensator) The SVC system is a combination of a shunt capacitor bank and a thyristor controlled shunt reactance (TCR). The capacitors in the capacitor bank could be switched with thyristors (TSC) or could be permanently connected (MSC). Through TSC, reactive power compensation is into reasonable classification, get a hierarchical reactive power change. In addition, TCR can absorb continuous reactive power. If absorbing the whole reactive power is needed, disconnect all TSCs. For coordinated control TSC and TCR, the system can get continuous reactive power output. As Figure 9 shown, The SVC bus is installed voltage measurement, the measuring voltage is in turn sent to Lead lag correction link、Proportional lead lag correction link and inertial element, through the selector compari- son with output results of a comparator, select one to input to the SVC interface and output the firing angle which can open or close the TCR and signal to control the number of TSC. In DIgSLIENT, we need to set out Figure 8. STATCOM control block diagram. Figure 9. SVC control block diagram. Copyright © 2013 SciRes. EPE  W. GUO, D.-M. ZHAO 402 the minimum and maximum reactive power and control mode of the Static Var Components system separately. 4.3. Example Using DIgSLIENT simulation, Wake effect between the various units of the wind farm is not considered in the simulation, and the assumption that wind conditions which is loaded into each wind turbine is same, so that 10 wind driven generations can be equivalent to 1. In wind farms, wind turbines whose rated voltage are 690 V, through the terminal transformer step up to 10 kV, and then connect to the Low voltage bus of wind farm, through the 1 km transmission lines to wind farms booster station and stepped up to 110 kV, finally using 20 km transmission cable connect to the external power grid, as shown below: As shown in Figure 10, wind farms 10 kV low voltage bus respectively access the same capacity of the two kinds of reactive power compensation equipment, but separate simulation run. In a condition of given wind speed of 13 m/s, the short-circuit fault occurs in the mid- dle of the transmission line which is on the second booster station 110 kV side, and set the fault type three- phase short-circuit fault: voltage drops to 0.39 p.u., fault starts at 5 s, continued 100ms till the fault is cleared, this paper mainly observes the bus voltage, reactive power compensation equipment issued and compares and ana- lyzes the results. 1) STATCOM reactive power compensation (Figures 11,12) 2) SVC reactive power compensation (Figures 13,14) Figure 10. Single-line schematic diagram of the system. Figure 11. bus bar voltage waveform after compensation. Figure 12. Reactive power of compensation. Figure 13. Bus bar voltage waveform after compensation. Figure 14. Reactive compensation(amount in absolute value). The results of simulation analysis: 1) Compared with without compensation equipment situation, during the fault,STATCOM improves the voltage from 0.39 p.u. to 0.503 p.u., and generates a large amount of reactive power about 20 Mvar. In the fault clearing time 5.2 s, reactive power has a great impact, because the voltage recovery needs a lot of reactive power. STATCOM dynamic compensation prevent the wind driven generator which run as a asynchronous gen- erator due to the low voltage protection action, absorp- tion power grid more reactive power and make the volt- age stability variation. 2) SVC output reactive power is proportional to the square of the connected bus voltage. Therefore, during the fault, bus bar voltage reduction makes SVC compen- sating reactive power reduction, Voltage is just raised from 0.39 p.u. to 0.403 p.u. Once the fault clearance, SVC will improve the compensation capacity from 14.35 Mvar rise to about 20 Mvar, so as to help the system re- covery voltage. Copyright © 2013 SciRes. EPE  W. GUO, D.-M. ZHAO Copyright © 2013 SciRes. EPE 403 3) From the chart, we know that SVC and STATCOM can control reactive power, effectively maintain system voltage stability, improve the system power factor, etc. In contrast, STATCOM has obvious advantages: STAT- COM compensation effect is better, more amount of compensation and Since the SVC is group for cut, after fault clearance, longer time is need to compensating re- active power. But the control of STATCOM is more complicated, and the cost of the frequency converter is higher. 5. Conclusions This paper finishes two parts on the DigSILENT: 1) It sets up two kinds of methods for the MPT mod- eling simulation: the curve fitting method and hill climb- ing algorithm, and improves the hill climbing algorithm control, the conclusion is: output in the hill climbing al- gorithm is more stable and converges faster so that the hill climbing algorithm is better than the curve fitting method. 2) It sets up the SVC and STATCOM modeling simu- lation, compare and analyze these two kinds of equip- ment in the power grid fault cases, and the dynamic re- sponse of STATCOM compensation capacity is bigger, the effect is more apparent. This conclusion has certain reference and guidance for practical engineering application. REFERENCES [1] S. Heier, “Grid Integration of Wind Energy Conversion System,” John Wiley & Sons Ltd, Chichester, 1998. [2] Y. D. Song, B. Dhinakaran and X. Y. Bao, “Variable Speed Control of Wind Turbines Using Nonlinear and Adaptive Algorithms,” Journal of Wind Engineering and Industrial Aerodynamics, Vol. 85, No. 3, 2000, pp. 293-308. doi:10.1016/S0167-6105(99)00131-2 [3] C. Hamon, “Doubly-fed Induction Generator Modeling and Control in DIgSILENT Power Factory,” Master’s Thesis, KTH School of Electrical Engineering, 2010. [4] Q. H. Liu, “The Investigation of Operation and Control for a Variable-Speed Constant-Frequency Wind Power GenerationSystem,” Ph.D. Thesis, Zhejiang University, 2005. [5] Q. Wang and L. C. Chang, “An Intelligent Maximum Power Extraction Algorithm for Inverter-based Variable Speed Wind Trubine Systems,” IEEE Transactions on Energy Conversion, Vol. 19, No. 5, 2004, pp. 1242-1249. [6] Y. N. Chi, “Studies on the Stability Issues about Large Scale Wind Farm Grid Integration,” Ph.D. Thesis, China Electric Power Research Institute, 2006. [7] R. Esmaili, L. Xu and D. K. Nichols, “A New Control Method of Permanent Magnet Generator for Maximum Power Tracking in Wind Turbine Application,” IEEE Power Engineering Society General Meeting, Vol. 8, No. 3, 2002, pp. 26-33. [8] X. L. Zhu and L. Wu, “Research on MPPT Control Method for Doubly-fed Wind Power Generation Sys- tems,” Power Electronics, Vol. 46, No. 1, 2012, pp. 1-3. [9] AN. M. Noroozi, A. N. Petersson and B. Thorvaldson, “Benefits of SVC and STATCOM for electric utility ap- plication,” Proceedings of IEEE/PES Transmission and Distribution Conference and Exposition, 2003. [10] Y. N. Chi, H. L. Guan, W. S. Wang and H. Z. Dai, “En- hancement of Transient Voltage Stability of Induction Generator Based Wind Farm by SVC and Pitch Control,” Automation of Electric Power System, Vol. 31, No. 3, 2007, pp. 95-100. [11] W. Zhou, “The Var Compensator Research of Wind-Power Plant Based on SVC and STATCOM,” Master’s Thesis, Xinjiang University, 2008.
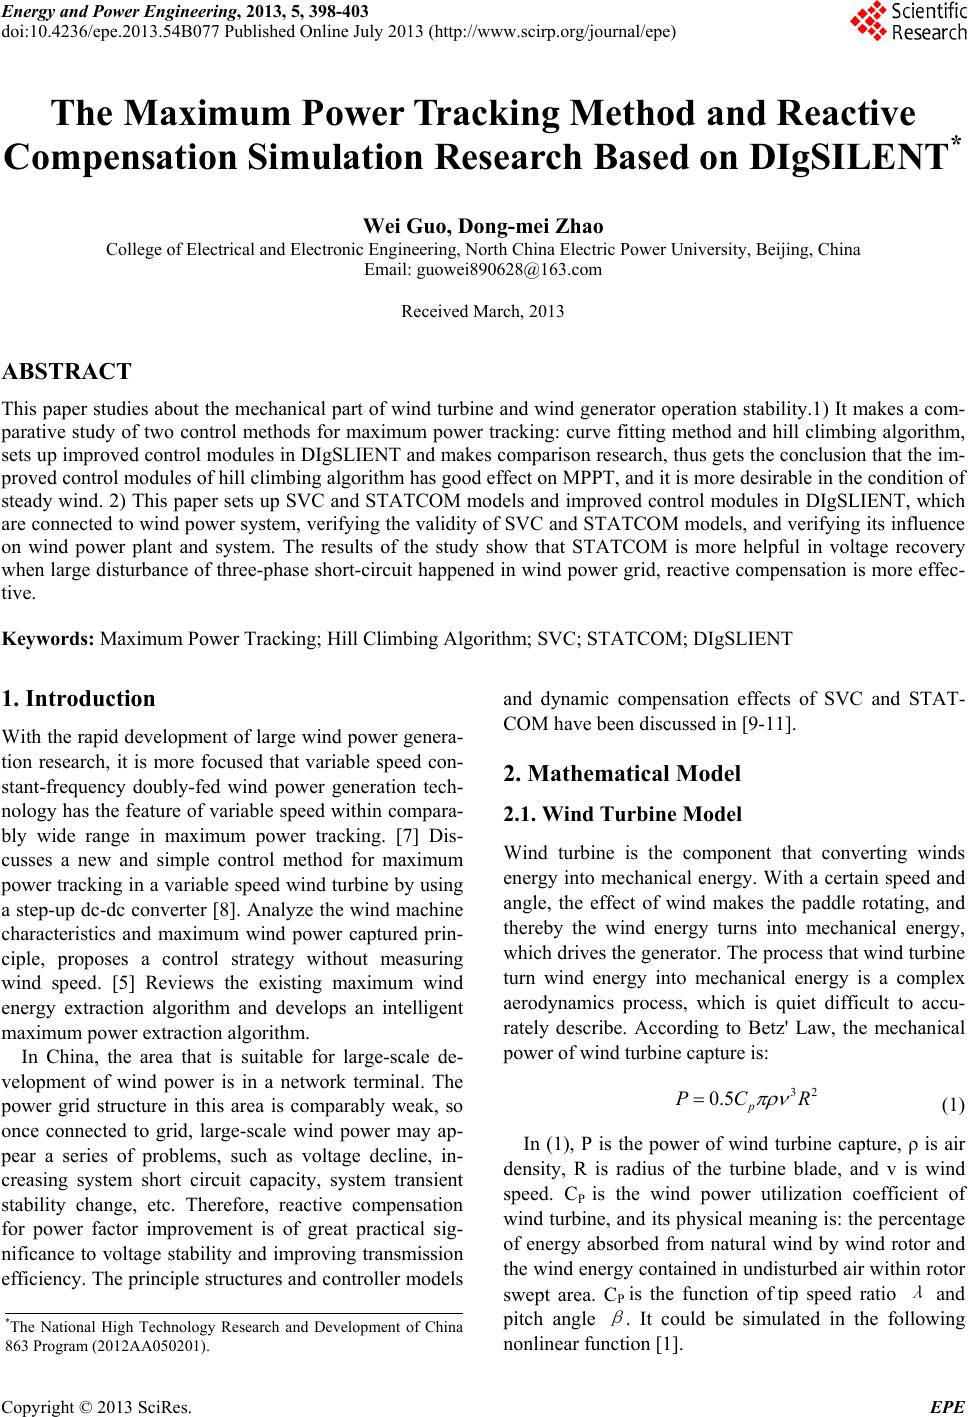
|