Paper Menu >>
Journal Menu >>
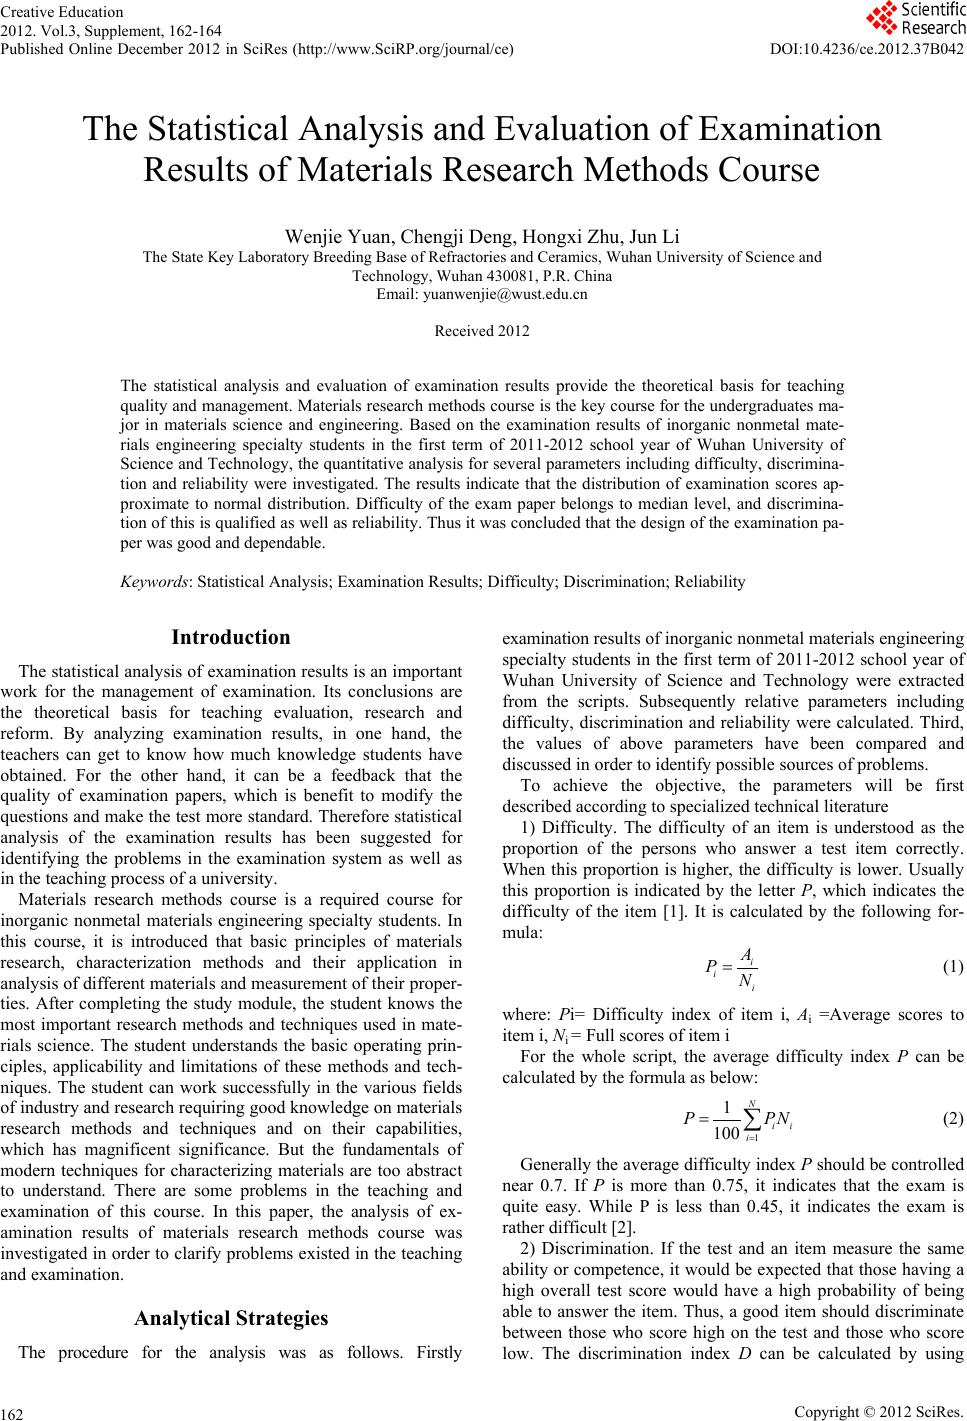 Creative Education 2012. Vol.3, Supplement, 162-164 Published Online December 2012 in SciRes (http://www.SciRP.org/journal/ce) DOI:10.4236/ce.2012.37B042 Copyright © 2012 SciRes. 162 The Statistical Analysis and Evaluation of Examination Results of Materials Research Methods Course Wenjie Yuan, Chengji Deng , Hongxi Zhu, Jun Li The State Key Laboratory Breeding Base of Refractories and Ceramics, Wuhan University of Science and Technology, Wuhan 430081, P.R . China Email: yuanwenjie@wust.edu.cn Received 2012 The statistical analysis and evaluation of examination results provide the theoretical basis for teaching quality and management. Materials research methods course is the key course for the undergraduates ma- jor in materials science and engineering. Based on the examination results of inorganic nonmetal mate- rials engineering specialty students in the first term of 2011-2012 school year of Wuhan University of Science and Technology, the quantitative analysis for several parameters including difficulty, discrimina- tion and reliability were investigated. The results indicate that the distribution of examination scores ap- proximate to normal distribution. Difficulty of the exam paper belongs to median level, and discrimina- tion of this is qualified as well as reliability. Thus it was concluded that the design of the examination pa- per was good and dependable. Keywords: Statistical Analys is; E xamina tion Results; Difficul ty; Discrimination; Reliability Introduction The statistical analysis of examination results is an important work for the management of examination. Its conclusions are the theoretical basis for teaching evaluation, research and reform. By analyzing examination results, in one hand, the teachers can get to know how much knowledge students have obtained. For the other hand, it can be a feedback that the quality of examination papers, which is benefit to modify the questions and make the test more standard. Therefore statistical analysis of the examination results has been suggested for identifying the problems in the examination system as well as in the teaching process of a university. Materials research methods course is a required course for inorganic nonmetal materials engineering specialty students. In this course, it is introduced that basic principles of materials research, characterization methods and their application in analysis of different materials and measurement of their proper- ties. After completing the study module, the student knows the most important research methods and techniques used in mate- rials science. The student understands the basic operating prin- ciples, applicability and limitations of these methods and tech- niques. The student can work successfully in the various fields of industry and research requiring good knowledge on materials research methods and techniques and on their capabilities, which has magnificent significance. But the fundamentals of modern techniques for characterizing materials are too abstract to understand. There are some problems in the teaching and examination of this course. In this paper, the analysis of ex- amination results of materials research methods course was investigated in order to clarify problems existed in the teaching and examination. Analytical Strategies The procedure for the analysis was as follows. Firstly examination results of inorganic nonmetal materials engineering specialty students in the first term of 2011-2012 school year of Wuhan University of Science and Technology were extracted from the scripts. Subsequently relative parameters including difficulty, discrimination and reliability were calculated. Third, the values of above parameters have been compared and discussed in order to identify possible sources of problems. To achieve the objective, the parameters will be first described according to specialized technical literature 1) Difficulty. The difficulty of an item is understood as the proportion of the persons who answer a test item correctly. When this proportion is higher, the difficulty is lower. Usually this proportion is indicated by the letter P, which indicates the difficulty of the item [1]. It is calculated by the following for- mula: i i i A PN = (1) where: Pi= Difficulty index of item i, Ai =Average scores to item i, Ni = Full scores of item i For the whole script, the average difficulty index P can be calculated by the formula as below: 1 1 100 N ii i P PN = =∑ (2) Generally the average difficulty index P should be controlled near 0.7. If P is more than 0.75, it indicates that the exam is quite easy. While P is less than 0.45, it indicates the exam is rather difficult [2]. 2) Discrimination. If the test and an item measure the same ability or competence, it would be expected that those having a high overall test score would have a high probability of being able to answer the item. Thus, a good item should discriminate between those who score high on the test and those who score low. The discrimination index D can be calculated by using 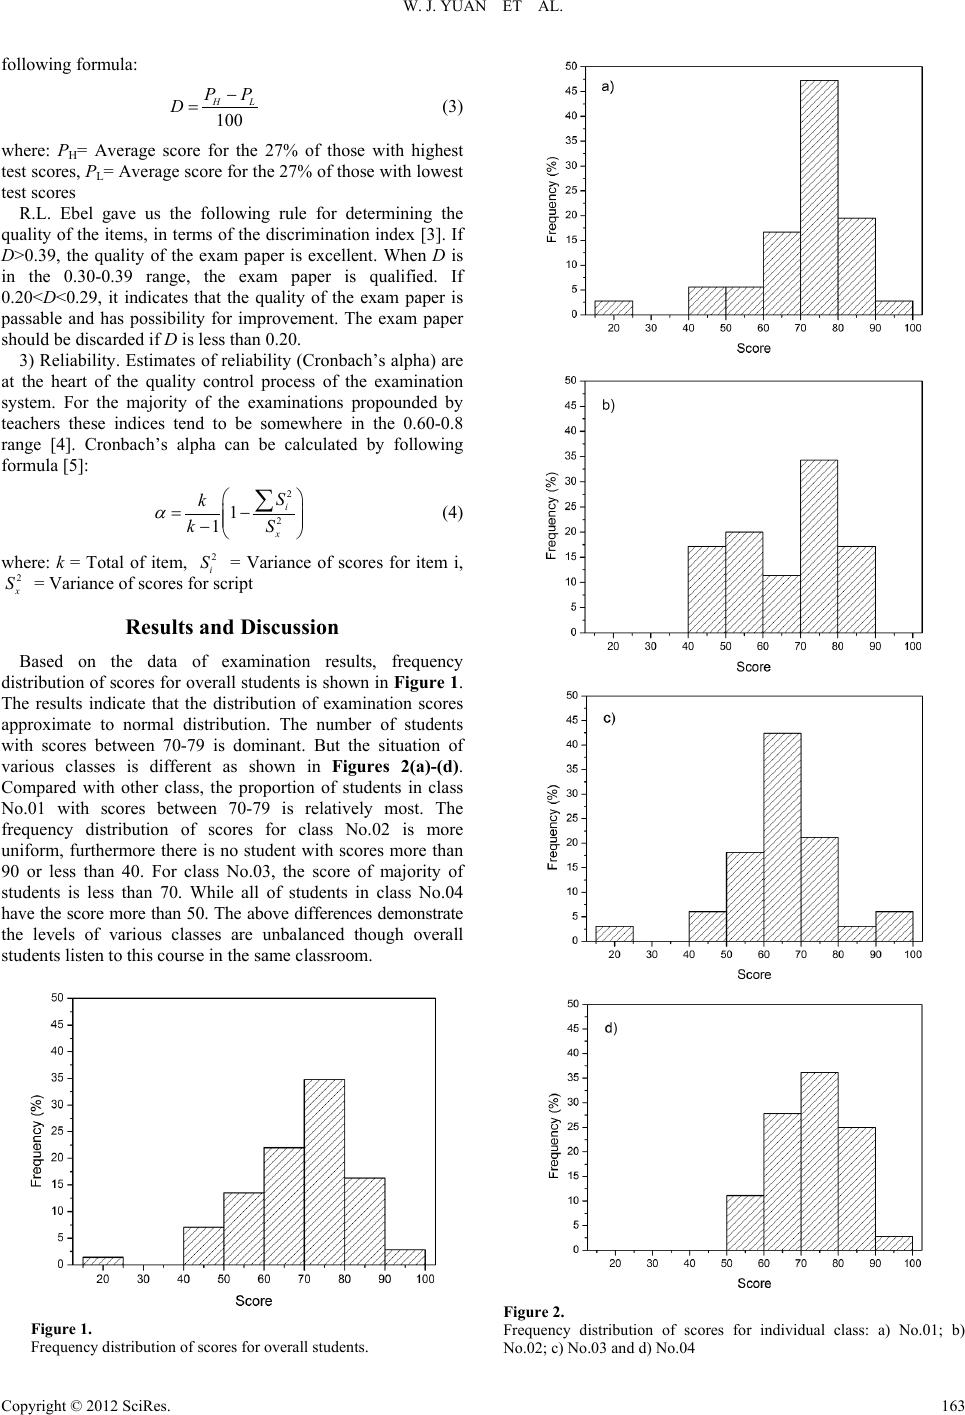 W. J. YUAN ET AL. Copyright © 2012 SciRes. 163 following formula: 100 HL PP D− = (3) where: PH= Average score for the 27% of those with highest test scores, PL= Average score for the 27% of those with lowest test scores R.L. Ebel gave us the following rule for determining the quality of the items, in terms of the discrimination index [3]. If D>0.39, the quality of the exam paper is excellent. When D is in the 0.30-0.39 range, the exam paper is qualified. If 0.20<D<0.29, it indicates that the quality of the exam paper is passable and has possibility for improvement. The exam paper should be discarded if D is less than 0.20. 3) Reliability. Estimates of reliability (Cronbach’s alpha) are at the heart of the quality control process of the examination system. For the majority of the examinations propounded by teachers these indices tend to be somewhere in the 0.60-0.8 range [4]. Cronbach’s alpha can be calculated by following formula [5]: 2 2 1 1 i x S k kS α = − − ∑ (4) where: k = Total of item, 2 i S = Variance of scores for item i, 2 x S = Variance of scores for script Results and Discu ssion Based on the data of examination results, frequency distribution of scores for overall students is shown in Figure 1. The results indicate that the distribution of examination scores approximate to normal distribution. The number of students with scores between 70-79 is dominant. But the situation of various classes is different as shown in Figures 2(a)-(d). Compared with other class, the proportion of students in class No.01 with scores between 70-79 is relatively most. The frequency distribution of scores for class No.02 is more uniform, furthermore there is no student with scores more than 90 or less than 40. For class No.03, the score of majority of students is less than 70. While all of students in class No.04 have the score more than 50. The above differences demonstrate the levels of various classes are unbalanced though overall students listen to this course in the same classroom. Figure 1. Frequency distribution of scores for overall students. Figure 2. Frequency distribution of scores for individual class: a) No.01; b) No.02; c) No.03 and d) No.04  W. J. YUAN ET AL. Copyright © 2012 SciRes. 164 Table 1. Difficulty index (P) analysis of exam paper and results. Types Multiple choices Explanation of terms S hort answer questions General questions Total Score 30 20 30 20 100 Difficulty 0.83 0.70 0.59 0.59 0.69 Quality easy median median median median Table 2. Discrimination index (D) analysis of examination results for different classes. Class No. 01 02 03 04 Total Average score 71.5 65.5 64.0 73.0 68.7 Standard deviation 14.5 13.2 12.5 9.65 13.1 Discrimination 0.32 0.34 0.28 0.24 0.31 Quality qualified qualified passable passable qualified By comparing the different type questions of t he e xa mination, it can be seen that its difficulty index P ranges from 0.59 to 0.83 (Table 1). The easiest part is multiple choices those re- lated with basic concepts, which can be understand well by students. Short answer questions, as well as general questions, are the most difficult parts. It is evidenced that the ability of students for mastering knowledge and handle problems is defi- cient. The difficulty index P of exam paper is moderate, there- fore it is not difficult for students to pass this examination. Analysis of the discrimination index D of four classes for the examination results shows that these range from 0.24 to 0.34 (Table 2). According to Ebel’s rule, the exam paper is qualified in general. The discrimination index of scores is much less for relatively concentrated distribution such as the situation of class No.03 and 04 (seen in Figure 2). All standard deviation of scores are less than 15, and the changes of those have the same trend with the discrimination index. The discrete degree of examination results is suitable combined with discrimination index and standard deviation [6]. The average scores for individual class also show that there is a big gap among four classes, which may be related with the ethos of study. However, it is clear that not all the students answered the same question about theme areas, so that although this comparison is not exact, it is closely approximate. The exam paper of materials research methods course in- cludes twenty-three items. Reliability (Cronbach’s alpha) was estimated according to equation (4). The quality of the exam paper is proved to be good by the result of α = 0.75. Conclusions The statistical analysis of the examination results of materials research methods course was carried out. Several parameters for the exam paper including difficulty P, discrimination D and reliability were calculated. The values are 0.69, 0.31 and 0.75, respectively. The results indicate that the distribution of ex- amination scores approximate to normal distribution. It is noted that there is a big gap among four classes. Difficulty of the exam paper belongs to median level, and discrimination of this is qualified as well as reliability. Thus it was concluded that the design of the examination paper was good and dependable. REFERENCES L. Crocker, J. Alg ina. Introduction to classical and modern test theory. New York: Holt, Rinehart and Winston, 1986 X.P. Liu, C.X. Liu. Introduction to education al statis tics an d ev alu ation. Beijing: Science Press, 2003, pp.162-163 H.Q. Dai. Educational and psychological measurement. Guangzhou: Jinan University Press, 2004, pp.117-118 X.J. Yu, R.K. Peng, J.E. Huang, F.J. Lu. Examination paper quality evaluation and probe of 15 medical courses. Higher Education Fo- rum, 2004, ( 2), pp.86-89 L.J. Cronbach. Coefficient and the internal structure of tests. Psy- chometrika, 1951, 16(3), pp.297-334 G.S. Cui, N. Zhang, Z.L. Li. The major indexes of examination paper analysis and evaluation syste m as well as some approaches to the key issues. Journal of Shenyang Institute of Engineering (Social Sciences), 2011, 7(3), pp.403-4 |