 Journal of Signal and Information Processing, 2013, 4, 72-79 doi:10.4236/jsip.201343B013 Published Online August 2013 (http://www.scirp.org/journal/jsip) A Study of Motor Bearing Fault D i ag nosis using Modulation Signal Bispectrum Analysis of Motor Current Signals Ahmed Alwodai1, Tie Wang2, Zhi Chen2, Fengshou Gu1, Robert Cattley1, Andrew Ball1 1Centre for Efficiency and Performance Engineering, University of Huddersfield, Queensgate, Huddersfield HD1 3DH, UK; 2Department of Vehicle Engineering, Taiyuan University of Technology Taiyuan, Shanxi Province, China Email: F.gu@hud.ac.uk Received April, 2013. ABSTRACT Failure of induction motors are a large concern due to its influence over industrial production. Motor current signature analysis (MCSA) is common practice in industry to find motor faults. This paper presents a new approach to detection and diagnosis of motor bearing faults based on induction motor stator current analysis. Tests were performed with three bearing conditions: baseline, outer race fault and inner race fault. Because the signals associated with faults produce small modulations to supply component and high nose levels, a modulation signal bispectrum (MSB) is used in this paper to detect and diagnose different motor bearing defects. The results show that bearing faults can induced a detest- able amplitude increases at its characteristic frequencies. MSB peaks show a clear difference at these frequencies whe- reas conventional power spectrum provides change evidences only at some of the frequencies. This shows that MSB has a better and reliable performance in extract small changes from the faulty bearing for fault detection and diagnosis. In addition, the study also show that current signals from motors with variable frequency drive controller have too much noise and it is unlikely to discriminate the small bearing fault component. Keywords: Induction Motor; Motor Current Signature; Power Spectrum Bispectrum; Motor Bearing 1. Introduction A general review of monitoring and fault diagnosis tech- niques are studied in [1, 2]. The different faults in an electrical machine can be classified as follows [3]: Figure 1. Components of the rolling ball bearing. Stator faults, for example, short circuit, loss of a sup- ply phase. Rotor faults, for example, broken bar, broken end- ring. Static and dynamic eccentricities. Bearing faults. Studies have shown that the common faults in induc- tion motors (about 40%–50%) happen in rolling bearings, depending on the type of installation, the motor size, and the supply voltage [4]. In general it is due to manufac- turing faults, lack of lubrication, installation errors and wear and tear. According to the affected elements, shown in Figure 1, bearing faults can be classified as inner ring, outer ring, ball element and cage faults. The inner ring is mounted on the shaft of the machine and is usually the rotating part whereas the outer ring is fixed in the housing of the machine and in most cases it does not rotate. The rolling elements may be balls, cylin- drical rollers, spherical rollers, tapered rollers or needle rollers. They rotate against the inner and outer ring race- ways and transmit the load acting on the bearing via small surface contacts separated by a thin lubricating film. The cage separates the rolling elements to prevent metal-to-metal contact between them during operation. Seals are important for protection of bearing from con- tamination and keep the lubricant inside the bearing sur- Copyright © 2013 SciRes. JSIP  A Studyof Motor Bearing Fault Diagnosis using Modulation Signal Bispectrum Analysis of Motor Current Signals 73 roundings. 2. Bearing Fault Modes This paper considers rolling-element bearings with a geometry shown in Figure 2. The bearing consist essen- tially of the outer and inner raceways, the balls, and the cage, which keeps the distances between the balls equals. The number of balls is Nb, their diameter is Db, and the pitch diameter is Dp. The point of contact between a ball and the raceway is characterized by the contact angle β. Bearing faults can be classified into distributed and localized defects [5]. Distributed defects affect a whole region and are difficult to characterize by distinct fre- quencies. On the other hand, single-point defects are lo- calized and can be classified according to the following affected element: Outer raceway defect Inner raceway defect Ball defect Cage defect With each type of bearing fault, a characteristic fre- quency can be associated. This frequency is correspond- ing to the periodicity by which an irregularity appears due to the existence of the fault. The characteristic fre- quencies are functions of the bearing geometry and the mechanical rotor frequency fr. For the four considered fault types, the characteristic frequency takes the follow- ing expressions[3, 5]: Figure 2. Geometry of a rolling-element bearing. bb r p ND f(1 cosβ) 2D o f (1) (1cos ) 2 bb ir p ND ff D (2) 2 2 2 (1cos ) pb br bp DD ff DD (3) 1(1cos ) 2 b cr p D ff D (4) where fo is the outer race fault frequency, fi is the inner race fault frequency, fb is the ball fault frequency and fc is cage fault frequency. The characteristic fault frequencies are the result of the absolute motion (vibration) of the machine. The stator current is not affected by the absolute motion of the ma- chine, but rather by a relative motion between the stator and rotor (i.e., changes in the air gap). In the instance of a bearing fault, the characteristic fault frequencies are essentially modulated by the electrical supply frequency. 3. Bearing Fault Detection by Stator Current Analysis The most often mentioned model studying the influence of bearing damage on the induction machine stator cur- rent was presented by Schoen etal [6]. The author con- siders the generation of rotating eccentricities at bearing fault characteristic frequencies fv, which leads to peri- odical changes in the machine inductances. This should produce additional frequencies fbfin the stator current, which can be predicted by: bfs v fkf (5) where fs is the electrical supply frequency, fv is one of the four characteristic fault frequencies defined by Equation 1 through Equation 4 .and k = 1, 2, 3... This model has been used in several recent works [6-8]. In [6], two types of faults were tested, namely a hole drilled through the outer race and indentation produced in both the inner and outer surfaces. For both faults, the vibration and current spectra are analyzed in both loaded and unloaded motor cases. The first faulty condition (outer race defect)is characterized by fo and 2fo compo- nents in the vibration spectrum and |fs ± fo| and |fs ± 2fo| com- ponents in the current spectrum. The second fault (inner race defect) is highlighted byfo, 2fo, and fi compo- nents in the vibration spectrum and |fs ± fo|, |fs± 2fo|, and |fs ± fi| components in the current spectrum. The authors claim that the characteristic fault frequency components are relatively small when compared to the rest of the current spectrum. The largest components occur at mul- tiples of the supply frequency and are caused by satura- tion, winding error distribution, and supply voltage changes. However, an evaluation of the amplitude of these largest components in different cases (healthy and two types of fault condition) is not shown. In [7], two inner race faults (spalls and drilled hole) are analyzed, and the authors point out a problem related to the ex- perimental simula- tion of bearing faults: The act of dis- assembling, re- mounting, and realigning the test motor can significantly alter the vibration and current spectra. The results show that, for both defects, the characteristic fault-frequency components are clearly visible only in the vibration spec- trum and not in the current spectrum. Both inner and outer raceway defects are analyzed in [8]. They show some differences in the amplitudes of the Copyright © 2013 SciRes. JSIP 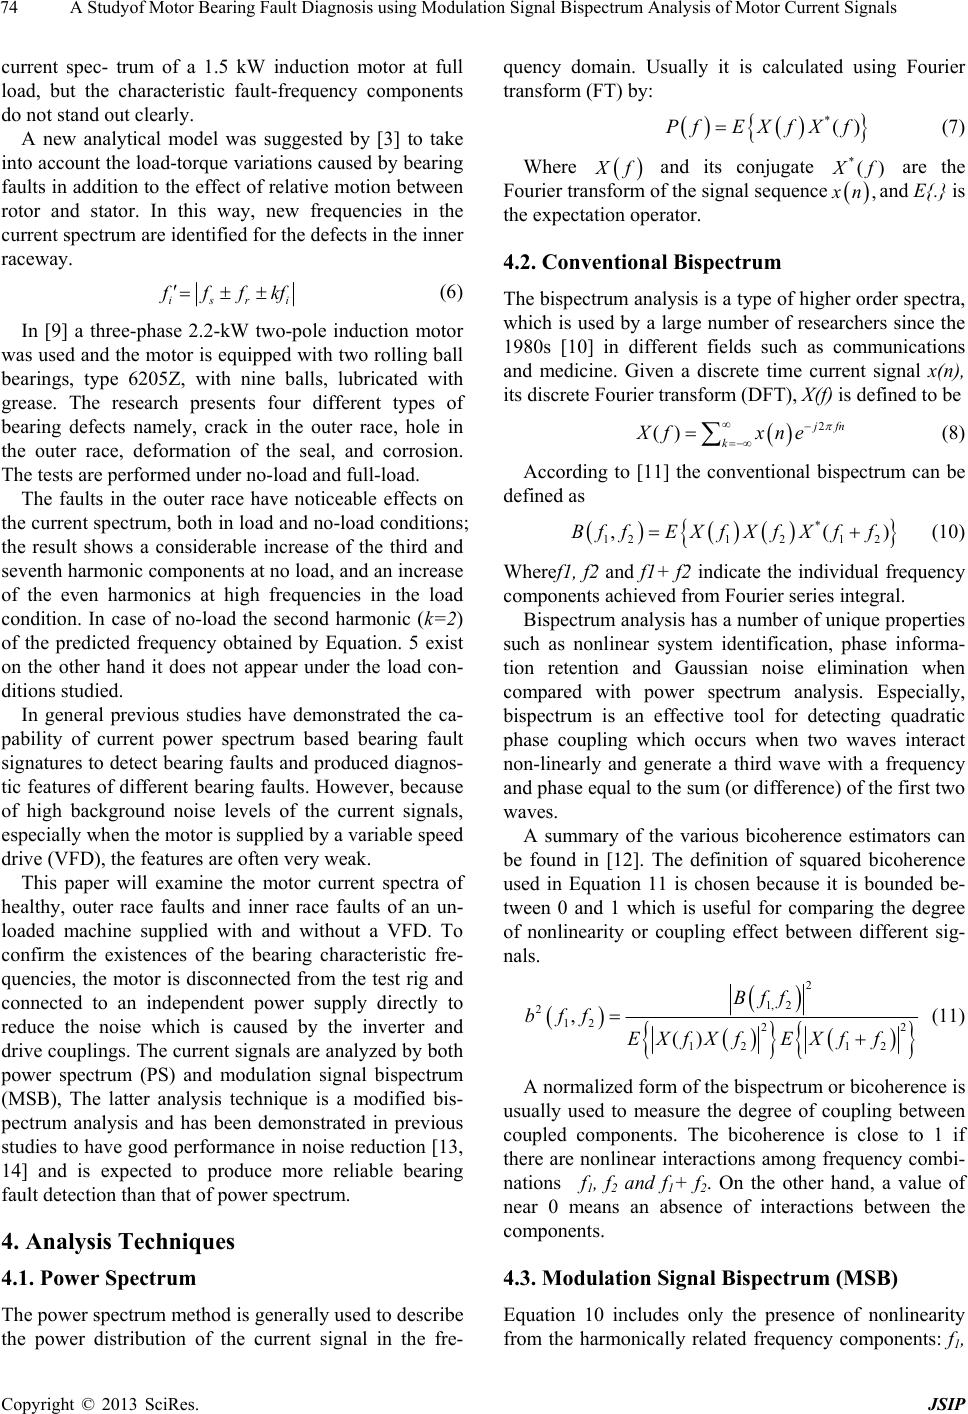 A Studyof Motor Bearing Fault Diagnosis using Modulation Signal Bispectrum Analysis of Motor Current Signals 74 current spec- trum of a 1.5 kW induction motor at full load, but the characteristic fault-frequency components do not stand out clearly. A new analytical model was suggested by [3] to take into account the load-torque variations caused by bearing faults in addition to the effect of relative motion between rotor and stator. In this way, new frequencies in the current spectrum are identified for the defects in the inner raceway. isri ffkf (6) In [9] a three-phase 2.2-kW two-pole induction motor was used and the motor is equipped with two rolling ball bearings, type 6205Z, with nine balls, lubricated with grease. The research presents four different types of bearing defects namely, crack in the outer race, hole in the outer race, deformation of the seal, and corrosion. The tests are performed under no-load and full-load. The faults in the outer race have noticeable effects on the current spectrum, both in load and no-load conditions; the result shows a considerable increase of the third and seventh harmonic components at no load, and an increase of the even harmonics at high frequencies in the load condition. In case of no-load the second harmonic (k=2) of the predicted frequency obtained by Equation. 5 exist on the other hand it does not appear under the load con- ditions studied. In general previous studies have demonstrated the ca- pability of current power spectrum based bearing fault signatures to detect bearing faults and produced diagnos- tic features of different bearing faults. However, because of high background noise levels of the current signals, especially when the motor is supplied by a variable speed drive (VFD), the features are often very weak. This paper will examine the motor current spectra of healthy, outer race faults and inner race faults of an un- loaded machine supplied with and without a VFD. To confirm the existences of the bearing characteristic fre- quencies, the motor is disconnected from the test rig and connected to an independent power supply directly to reduce the noise which is caused by the inverter and drive couplings. The current signals are analyzed by both power spectrum (PS) and modulation signal bispectrum (MSB), The latter analysis technique is a modified bis- pectrum analysis and has been demonstrated in previous studies to have good performance in noise reduction [13, 14] and is expected to produce more reliable bearing fault detection than that of power spectrum. 4. Analysis Techniques 4.1. Power Spectrum The power spectrum method is generally used to describe the power distribution of the current signal in the fre- quency domain. Usually it is calculated using Fourier transform (FT) by: *() fEXfXf (7) Where Xf and its conjugate are the Fourier transform of the signal sequence *()Xf , nand E{.} is the expectation operator. 4.2. Conventional Bispectrum The bispectrum analysis is a type of higher order spectra, which is used by a large number of researchers since the 1980s [10] in different fields such as communications and medicine. Given a discrete time current signal x(n), its discrete Fourier transform (DFT), X(f) is defined to be 2 () fn k Xf xne (8) According to [11] the conventional bispectrum can be defined as * 12121 2 ,(BffEXfXf Xff) (10) Wheref1, f2 and f1+ f2 indicate the individual frequency components achieved from Fourier series integral. Bispectrum analysis has a number of unique properties such as nonlinear system identification, phase informa- tion retention and Gaussian noise elimination when compared with power spectrum analysis. Especially, bispectrum is an effective tool for detecting quadratic phase coupling which occurs when two waves interact non-linearly and generate a third wave with a frequency and phase equal to the sum (or difference) of the first two waves. A summary of the various bicoherence estimators can be found in [12]. The definition of squared bicoherence used in Equation 11 is chosen because it is bounded be- tween 0 and 1 which is useful for comparing the degree of nonlinearity or coupling effect between different sig- nals. 2 1, 2 2 12 22 12 12 , () Bff bff EXfXfEXf f (11) A normalized form of the bispectrum or bicoherence is usually used to measure the degree of coupling between coupled components. The bicoherence is close to 1 if there are nonlinear interactions among frequency combi- nations f1, f2 and f1+ f2. On the other hand, a value of near 0 means an absence of interactions between the components. 4.3. Modulation Signal Bispectrum (MSB) Equation 10 includes only the presence of nonlinearity from the harmonically related frequency components: f1, Copyright © 2013 SciRes. JSIP  A Studyof Motor Bearing Fault Diagnosis using Modulation Signal Bispectrum Analysis of Motor Current Signals 75 f2 and f1+f2. It overlooks the possibility that the occur- rence of f1-f2 might be due to the nonlinearity between f1 and f2as well. Because of this, it is not adequate to de- scribe amplitude modulation (AM) signals such as motor current signals. Figure 3. Outer race fault. Figure 4. Inner race fault. To improve the performance of the conventional bis- pectrum in characterizing the motor current signals, a new variant of the conventional bispectrum, named as a modulation signal bispectrum (MSB) is examined in [13, 14] as in Equation 12 ** 1, 2212122MS Bff EXffXffXfXf (12) Furthermore, to make a direct comparison with power spectrum in Equation 7 a normalized version of Equation 12 is introduced as: 1, 2 ** 22 21 21 22 MSN Bff fXf EXff XffXfXf (13) In Equation 13 the amplitude of * 2 2 () |()| f f which re- lates to carrier component f2 is unity. Thus the amplitude of the modulation signals bispectral peaks are determined purely by the magnitude of the sideband components. In other words the resultant modulation signal bispectral magnitudes are independent of the amplitude of the car- rier component at supply frequency and hence can be directly compared with that of power spectrum. 4.4. Bearing Faults and Test Setup Two types of common bearing faults have been tested in this study. The first one, an abrasive wear in the outer race has been considered; which models that caused by friction between ball and outer race surfaces due to lack of lubrication as shown in Figure 3, while the second case of fault is an inner race defect as shown in Figure 4. To analyze the current signals, a dataset is acquired in a motor rig under different simulated fault cases and operating conditions. Figure 5 shows the schematic diagram of the test facility employed to examine motor stator faults. The system consists of an induction motor, variable speed controller, supporting bearings, couplings and DC generator as a load. The test motor is a three- phase induction motor with rated output power of 4 kW at 1420 rpm (two-pole pairs). The motor has 28 rotor bars and 36 stator slots. Two rolling ball bearings, type 6206ZZ deep groove ball bearing measuring 30x62x16 mm, with nine balls (Nb=9),Db=9.52 mm and Dp=46.0 mm, are used to support the rotor . To change the speed of the test motor, a digital variable speed controller is attached to the test rig between the power line source and the motor. The controller can be programmed to any specific shaft rotation speed between 0 and 1500rpm. The induction motor is directly coupled with a DC generator. The field of the generator is connected to a DC source through a controller while the generated power was fed back to the mains electrical grid via an inverter and the load on the induction motor can be adjusted by changing the field resistance of the DC generator. The operating load can be varied from no load to full load via the control panel. A power supply measurement unit was designed to measure the instantaneous AC voltages, currents and power, using hall-effect voltage and current transducers and a universal power cell by the University staff. A shaft encoder, mounted on the shaft end produces 100 pulses per revolution for measuring the motor speed. A piezoelectric accelerometer, mounted on the bearing end-caps, is used to measure vibration of the motor. The accelerometer has a sensitivity of 5.0 mV/ms2 with a frequency range from 0.5 to 5000Hz, the current transducer has a sensitivity of 0.1A/V and a measurement range of 50A which allows the small changes of current and vibration to be measured with adequate accuracy. During the tests the data was acquired using a GST YE6232B high speed data acquisition system. This system has 16 channels, each with 24 bit resolution, a maximum sampling frequency of 96 kHz, which allows the details of the 50Hz component, the high order supply harmonics, rotor bar pass frequency, stator bar pass frequency and motor bearing frequency to be recorded for further analysis. Copyright © 2013 SciRes. JSIP  A Studyof Motor Bearing Fault Diagnosis using Modulation Signal Bispectrum Analysis of Motor Current Signals 76 Figure 5. Schematic of induction motor te st rig. To evaluate the performance of PS and MSB analysis, current signals were collected under three different motor conditions: healthy motor, outer race fault and inner race fault and under four successive load conditions: zero, 25%, 50% and 75% of full load, which allows the diagnostic performance to be examined at different loads and avoid any possible damage to the test system at the full load when the faults are simulated. However, because of noises which are caused by controller, the characteristic bearing fault frequencies were difficult to differentiate from complex spectrum patterns. The motor was then disconnected from the loading system and the test was carried out with and without the controller and the results will be discussed in next section. In the meantime vibration signals were also measured under healthy and two bearing faults to confirm the ef- fectiveness of fault induced based on the vibration fre- quencies values which calculated by Equation 1 to Equa- tion 4. 5. Results and Discussions The dataset is processed off-line using a Matlab program which implements PS and MSB calculations simultane- ously with a 4-term Blackman-Harris window and 100 times of average. In this way they can be compared di- rectly in the performance of identifying the characteristic frequencies and quantifying their spectral peaks. 5.1. Effect of Controller The phase current signal is firstly examined under dif- ferent supply cases (with and without controller). Before exploring the current spectrum, vibration signals are examined to confirm the introduction of the faults. Figure 6 shows the vibration spectrum for both the outer race and inner race faults. The characteristic fre- quency and their harmonics are clearly shown. In addi- tion, the amplitude at the fundamental frequency fi is higher than that of fo, indicating that the fault from inner race may be higher than that of the outer race. These then shows that the two types of faults have been induced with sufficient severity so that the vibration based me- thod can detect them. Figure 7 shows a comparison of current spectrum be- tween a healthy case and two faulty bearings under four different loads with the VFD controller. To highlight the small components, the Y-scale is fixed to 0.4A. It is dif- ficult to find the spectrum components at the characteris- tic frequencies suggested in Equation 5 due to bearing faults for all load conditions. Instead there are clear peaks at frequencies (fs±fr) which become higher with faults. In addition the peak values decreases with the increase of load. These changes show that there is no- ticeable eccentricity which may be induced to the rotor system when refitting the faulty bearings. It may indicate that the eccentricity induced changes mask the changes due to bearing faults. In addition, the controller will cause high level of noise because VFD provides a pulse width modulated signal source, which may also mask the small component at bearing characteristic frequencies. 050100 150 200 250300 350 400 450 500 0 0. 2 0. 4 (a) Vi brati on Si gnal Wit hout Control l er Frequency (Hz) A m plit ude (m/ s 2 ) Oute r Race 050100 150 200 250300 350 400 450 500 0 0. 2 0. 4 (b) Vi brati on Si gnal Wit hout Control l er Frequency (Hz) A m plit ude (m / s 2 ) Inner Race fo=89.5 2*fo=179 3*fo= 268.6 4*fo=35 8.1 fi= 1 35.4 2*fi=270.7 5*fo= 447.6 fi+50=185.4 3*fi=406.1 2*fi-50=220.7 Figure 6. Spectrum of vibration for faulty be ar ings. 0100 200 300 400500 600 700 800 900 1000 0 0.2 0.4 (a) Curre nt S pe ct ru m und er Loa d=0(%) Frequency(Hz) Ampli tude(A) Healthy Outer Race Inne r Ra ce 0100 200 300 400500 600 700 800 900 1000 0 0.2 0.4 (b ) Current Spectrum u nder L oad=25(%) Frequency(Hz) Amplitude(A) 0100 200 300 400500 600 700 800 900 1000 0 0.2 0.4 (c) Current Spe ct ru m und er Loa d=50(%) Frequency(Hz) Amplitude(A) 0100 200 300 400500 600 700 800 900 1000 0 0.2 0.4 (d ) Current Spectrum u nder L oad=75(%) Frequency(Hz) Ampli tude(A) fs±fr fs±fr fs± fr fs±fr 3*fs 5*fs 7*fs 3*fs 3*fs 3*fs 7*fs 7*fs 7*fs 5*fs 5*fs 5*fs Figure 7. Current spectra with controller. Copyright © 2013 SciRes. JSIP 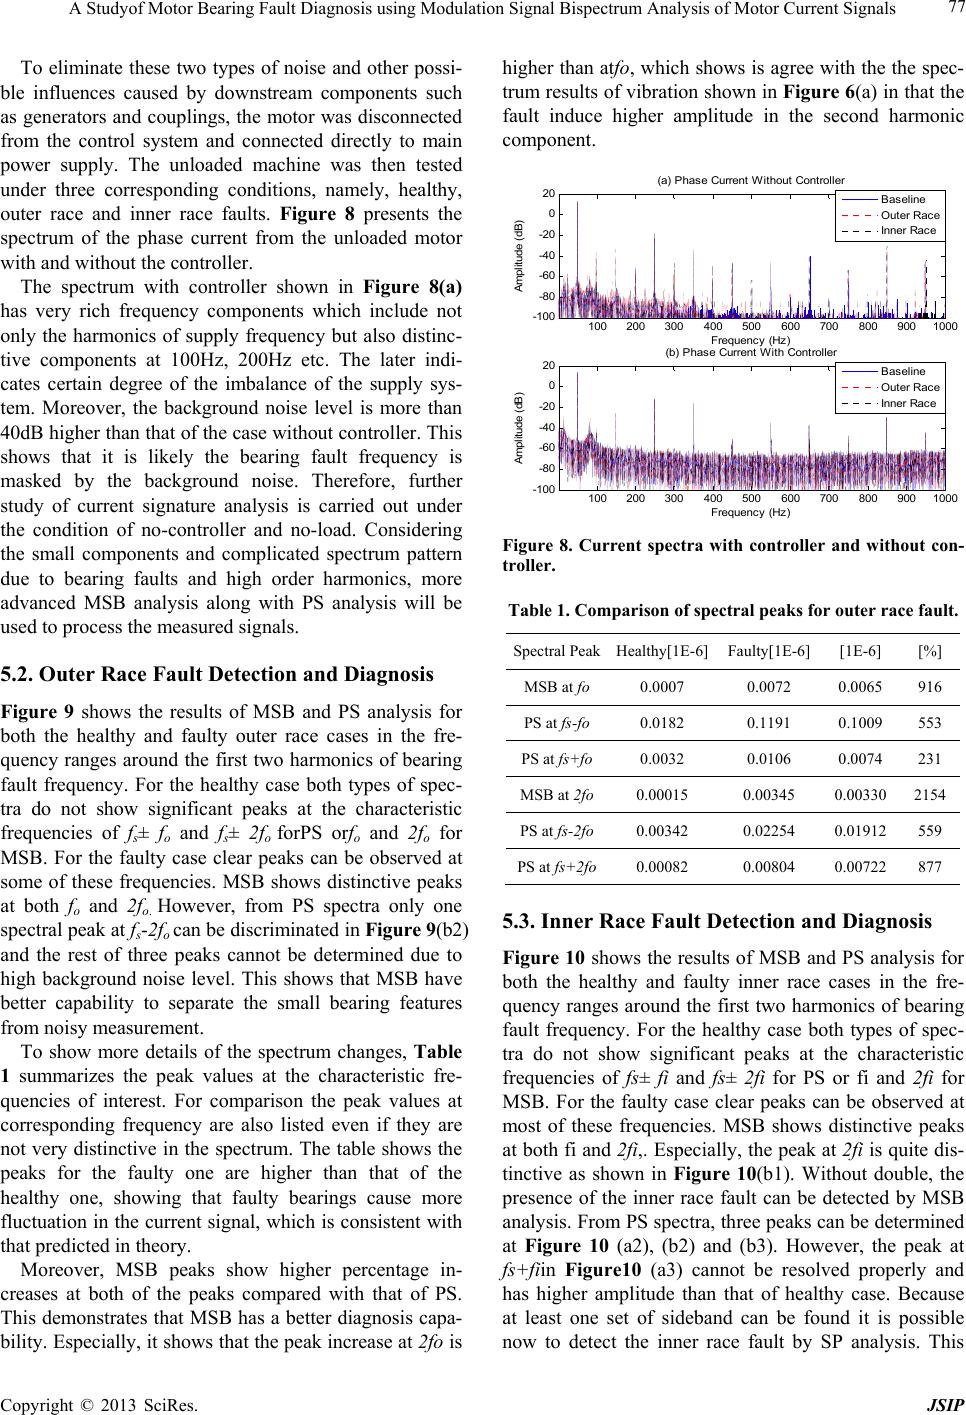 A Studyof Motor Bearing Fault Diagnosis using Modulation Signal Bispectrum Analysis of Motor Current Signals 77 To eliminate these two types of noise and other possi- ble influences caused by downstream components such as generators and couplings, the motor was disconnected from the control system and connected directly to main power supply. The unloaded machine was then tested under three corresponding conditions, namely, healthy, outer race and inner race faults. Figure 8 presents the spectrum of the phase current from the unloaded motor with and without the controller. The spectrum with controller shown in Figure 8(a) has very rich frequency components which include not only the harmonics of supply frequency but also distinc- tive components at 100Hz, 200Hz etc. The later indi- cates certain degree of the imbalance of the supply sys- tem. Moreover, the background noise level is more than 40dB higher than that of the case without controller. This shows that it is likely the bearing fault frequency is masked by the background noise. Therefore, further study of current signature analysis is carried out under the condition of no-controller and no-load. Considering the small components and complicated spectrum pattern due to bearing faults and high order harmonics, more advanced MSB analysis along with PS analysis will be used to process the measured signals. 5.2. Outer Race Fault Detection and Diagnosis Figure 9 shows the results of MSB and PS analysis for both the healthy and faulty outer race cases in the fre- quency ranges around the first two harmonics of bearing fault frequency. For the healthy case both types of spec- tra do not show significant peaks at the characteristic frequencies of fs± fo and fs± 2fo forPS orfo and 2fo for MSB. For the faulty case clear peaks can be observed at some of these frequencies. MSB shows distinctive peaks at both fo and 2fo. However, from PS spectra only one spectral peak at fs-2fo can be discriminated in Figure 9(b2) and the rest of three peaks cannot be determined due to high background noise level. This shows that MSB have better capability to separate the small bearing features from noisy measurement. To show more details of the spectrum changes, Table 1 summarizes the peak values at the characteristic fre- quencies of interest. For comparison the peak values at corresponding frequency are also listed even if they are not very distinctive in the spectrum. The table shows the peaks for the faulty one are higher than that of the healthy one, showing that faulty bearings cause more fluctuation in the current signal, which is consistent with that predicted in theory. Moreover, MSB peaks show higher percentage in- creases at both of the peaks compared with that of PS. This demonstrates that MSB has a better diagnosis capa- bility. Especially, it shows that the peak increase at 2fo is higher than atfo, which shows is agree with the the spec- trum results of vibration shown in Figure 6(a) in that the fault induce higher amplitude in the second harmonic component. 100 200 300400 500600 700800 9001000 -100 -80 -60 -40 -20 0 20 (a) Phase Current Wit hout Cont rol l e Frequency (Hz ) Amplitude (dB) Baseline Outer Rac e Inner Rac e 100 200 300400 500600 700800 9001000 -100 -80 -60 -40 -20 0 20 (b) Phase Current Wi t h Control l er Frequency (Hz ) Amplitude (dB) Baseline Outer Rac e Inner Rac e Figure 8. Current spectra with controller and without con- troller. Table 1. Comparison of spectral peaks for outer race fault. Spectral PeakHealthy[1E-6] Faulty[1E-6] [1E-6] [%] MSB at fo 0.0007 0.0072 0.0065 916 PS at fs-fo 0.0182 0.1191 0.1009 553 PS at fs+fo 0.0032 0.0106 0.0074 231 MSB at 2fo 0.00015 0.00345 0.003302154 PS at fs-2fo 0.00342 0.02254 0.01912559 PS at fs+2fo 0.00082 0.00804 0.00722877 5.3. Inner Race Fault Detection and Diagnosis Figure 10 shows the results of MSB and PS analysis for both the healthy and faulty inner race cases in the fre- quency ranges around the first two harmonics of bearing fault frequency. For the healthy case both types of spec- tra do not show significant peaks at the characteristic frequencies of fs± fi and fs± 2fi for PS or fi and 2fi for MSB. For the faulty case clear peaks can be observed at most of these frequencies. MSB shows distinctive peaks at both fi and 2fi,. Especially, the peak at 2fi is quite dis- tinctive as shown in Figure 10(b1). Without double, the presence of the inner race fault can be detected by MSB analysis. From PS spectra, three peaks can be determined at Figure 10 (a2), (b2) and (b3). However, the peak at fs+fiin Figure10 (a3) cannot be resolved properly and has higher amplitude than that of healthy case. Because at least one set of sideband can be found it is possible now to detect the inner race fault by SP analysis. This Copyright © 2013 SciRes. JSIP  A Studyof Motor Bearing Fault Diagnosis using Modulation Signal Bispectrum Analysis of Motor Current Signals 78 also shows that PS is capable to detect the fault when the se- verity is higher which is confirmed by the vibration spectrum shown in Figure 6. In other words, PS is less reliable in detecting this inner race compared with MSB analysis. 86 88 90 92 94 0 1 2 3 x 10 -8 89.51 7.22e-00 (a1) MS B c los e t o fo Frequency(Hz) C urrent(A 4) 9 Healthy Faulty 176 178180 182 0 0.5 1 1.5 x 10 -8 179 3.45e-00 ( b1) MSB close to 2fo Frequency(Hz) C urrent(A 4) 9 36 38 40 42 44 0 2 4 x 10 -7 39.56 1.19e-00 (a 2) PS close to fo-fs Frequency(Hz) C urrent(A 2) 7 126 128130 132 0 0.5 1 x 10 -7 129.1 2.25e-00 (b2) PS close to 2fo-fs Frequency(Hz) C urrent(A 2) 8 136138140 142 144 0 2 4 x 10 -8 139.5 1.06e-00 (a3) PS close to fo+fs Frequency(Hz) C urrent(A 2) 8 226 228230 232 0 2 4x 10 -8 229 8.04e-00 (b 3) PS close to 2fo+fs Frequency(Hz) C urrent(A 2) 9 Figure 9. Spectrum in the frequency range close to fo and 2fo. To show more details of the spectrum changes, the peak values at characteristic frequencies of interest are also summarized, shown in Table 2. For comparison the peak value at fs+fiis also listed even though it is not dis- tinctive and has higher amplitude than the healthy case in the spectrum. The table shows that the peak values for the faulty one are higher than that of the healthy one ex- cept for the peak at fs+fi, showing that faulty bearings cause more fluctuation in the current signal, which is consistent with that predicted in theory. Moreover, MSB peaks show higher percentage in- creases at both of the peaks compared with that of PS. This demonstrates that MSB has a better diagnosis capa- bility. Especially, it shows that the peak increase at 2fi is higher than at fi, which is agree with the spectrum results of vibration shown in Figure6(b) in that the fault induce higher amplitude in the second harmonic component. However, comparing the amplitude increases between Table 1 and Ta bl e 2 has found that the amplitudes of the inner race fault are smaller than that of outer race fault. This is not very consistent with that of vibration results show in Figure 6. However, this less amplitude changes may be due to the higher attenuation in the high fre- quency range of the induction motor, which can be un- derstood in the spectra of Figure 8 in which the spectral amplitude has a monotonic decrease trend with the in- creasing of frequency. Based on this frequency response characteristics the amplitude changes at fi, and its har- monics will be lower because fi, is higher than fo. Table 2 Comparison of spectral peaks for inner race fault. Spectral PeakHealthy[1E-6]Faulty[1E-6] [1E-6] [%] MSB at fi 0.0058 0.0174 0.0116 200 PS at fs- fi 0.1075 0.6741 0.5666 527 PS at fs+ fi0.0036 0.0021 -0.0016-43 MSB at 2fi0.000294 0.001578 0.001284437 PS at fs- 2fi0.000901 0.003153 0.002252249 PS at fs+ 2fi0.000309 0.001685 0.001376445 132 134 136138 0 2 4 6 8 x 10 -8 135.1 1.74e-00 Frequency(Hz) Current(A 4) (a1) MSB cl os e t o fi 8 Healthy Faulty 266 268270 272 6 x 10 -9 274 0 2 270.5 1.58e-0 4 0 Frequency(Hz) Current(A 4) (b1) MSB cl os e t o 2fi 9 82 84 86 88 0 1 2 3 x 10 -6 85 6.74e-00 Frequency(Hz) Current(A 2) (a 2) PS clos e to fi-fs 7 216 218220 222 1.5 x 10 -8 224 0 0.5 1 220.5 3.15e-00 Frequency(Hz) Current(A 2) (b2) PS clos e to 2fi-fs 9 182 184 186188 0 0.5 1x 10 -8 185 2.07e-00 Frequency(Hz) Curr ent(A 2) (a3) PS clos e to fi+fs 9 316 318320 322 8x 10 -9 324 0 2 4 6 320.5 1.69e-00 Frequency(Hz) Curr ent(A 2) (b3) PS close to 2fi+fs 9 Figure 10. Spectrum in the frequency range close to fi and 2 fi. 6. Conclusions MSB analysis is evaluated using motor current signals to detect and diagnosis motor bearing faults. From its spec- trum presentations, it can be found that MSB show a simpler spectrum structure compared with the power spectrum. It means that MSB shows peaks only at kfo and kfi for outer race and inner race faults respectively whe- reas power spectrum shows peaks at (fs±kfo) and (fs±kfi) which cause difficulty to be identified them when the spectrum components are rich. Moreover MSB pro- duc- es more accurate amplitude estimate due to its ca- pabil- ity of noise reduction and non-modulation compo- nent removal. With MSB analysis the motor current can be used to detect and diagnosis bearing faults when the motor oper- ates without VFD controller under no-load condition. The VFD induces too much noise into the system and it is not possible to discriminate the small bearing compo- Copyright © 2013 SciRes. JSIP  A Studyof Motor Bearing Fault Diagnosis using Modulation Signal Bispectrum Analysis of Motor Current Signals Copyright © 2013 SciRes. JSIP 79 nent for condition monitoring. The bearing fault causes amplitude increases at the characteristic frequencies corresponding to outer race and inner race faults. MSB produces a reliable difference at these frequencies whereas PS only provides change evidences at some of the frequencies. This shows that MSB has a better performance in extract small changes from the faulty bearing for fault detection and diagnosis. REFERENCES [1] D. Basak, A. Tiwari and S. P. Das, “Fault Diagnosis and Condition Monitoring of Electrical Machines—A Re- view,” in Proc. IEEE ICIT, 2006, pp. 3061–3066. [2] M. E. H. Benbouzid, “A Review of Induction Motors Signature Analysis as a Medium for Faults Detection,” IEEE Transactions Industrial Electron, Vol. 47, No. 5, 2000, pp. 984–993.doi:10.1109/41.873206 [3] M. Blödt, P. Granjon, B. Raison and G. Rostaing, “Mod- els for Bearing Damage Detection in Induction Motors Using Stator Current Monitoring,” IEEE Transactions On Industrial Electronics Vol. 55, No. 4, 2008, pp. 1813-1822.doi:10.1109/TIE.2008.917108 [4] A. Shrivastava and S. Wadhwani, “Condition Monitoring for Inner Raceway Fault of Induction Motor Ball Bear- ings,”International Journal of Electrical Engineering, Vol. 5, 2012, pp. 239-244. [5] J. Stack, T. G. Habetler and R. G. Harley, “Fault Classi- Fication and Fault Signature Production for Rolling Ele- ment Bearings in Electric Machines,” IEEE Transactions Industrial Applications, Vol. 40, 2004, PP. 735–739. [6] R. R. Schoen, T. G. Habetler, F. Kamran and R. Bartheld, “Motor Bearing Damage Detection Using Stator Current Monitoring,” IEEE Transactions Industrial Applications, Vol. 31, No. 6, 1995, pp. 1274–1279. doi:10.1109/28.475697 [7] R. R. Obaid, T. G. Habetler and J. R. Stack, “Stator Cur- rent Analysis for Bearing Damage Detection in Induction Motors,”in Proc. SDEMPED,Atlanta, 2003, pp. 182–187. [8] I. Rodríguez and R. Alves, “Bearing Damage Detection of the Induction Motors Using Current Analysis,”in Proc. TDC IEEE/PES Transmiss.Distrib. Conf. Expo.: Latin America, August 2006, pp. 1–5. [9] L. Frosini and E. Bassi, “Stator Current and Motor Effi- ciency as Indicators for Different Types of Bearing Faults in Induction Motors,” IEEE Transactions on Industrial electronics, Vol. 57, No. 1, 2010, pp. 244-251. doi:10.1109/TIE.2009.2026770 [10] G. C. Zhang, M. G. e, H. Tong, Y. Xu and R. Du, “Bis- pectral Analysis for on-line Monitoring of Stamping Op- eration,”Engineering Applications of Artificial Intelli- gence, Vol. 15, No. 1, 2002, pp. 97–104. doi:10.1016/S0952-1976(02)00007-6 [11] W. B. Collis, P. R. White and J. K. Hammond, “Higher-order Spectra: The Bispectrum and Trispec- trum,” Mechanical Systems and Signal Processing, Vol. 12, No. 3, 1998, pp. 375-394. doi:10.1006/mssp.1997.0145 [12] J. W. A. Fackrell, S. McLaughlin and P. R. White, “Bi- coherence Estimation Using the Direct Method. Part 1: Theoretical considerations,”Applications. Signal Proc- ess,Vol. 3,1995, pp. 155-168. [13] F. Gu, Y. Shao, N. Hu and A. D. Ball, “Electrical Motor Current Signal Analysis Using a Modified Bispectrum for Ault Diagnosis of Downstream Mechanical Equipment,” Mechanical Systems and Signal Processing,” Vol. 25, No. 1,2011, pp. 360–372. doi:10.1016/j.ymssp.2010.07.004 [14] A. Alwodai, X. Yuan, Y. Shao, F. Gu, and A. D. Ball, “Modulation Signal Bispectrum Analysis of Motor Cur- rent Signals for Stator Fault Diagnosis,” Proceedings of the 18th ICAC, September 2012.
|