 Journal of Cancer Therapy, 2013, 4, 7-14 http://dx.doi.org/10.4236/jct.2013.49A2002 Published Online October 2013 (http://www.scirp.org/journal/jct) 7 Use of the American Society of Anesthesiologists Classification as an Additional Planning Tool for Renal Cell Carcinoma Assessment Daniel Beltrame Ferreira1, Stênio de Cássio Zequi1, Walter Henriques da Costa1, Diego Abreu Clavijo2, Ricardo Decia2, Deusdedit Cortez Neto1, Renato Rosa de Oliveira1, Gustavo Cardoso Guimarães1, Ademar Lopes1 1Urology Division, Department of Pelvic Surgery, A. C. Camargo Cancer Center, Sao Paulo, Brazil; 2Department of Urology, Pasteur Hospital, Montevideo, Uruguay. Email: danielbeltrame@uol.com.br Received July 24th, 2013; revised August 22nd, 2013; accepted August 31st, 2013 Copyright © 2013 Daniel Beltrame Ferreira et al. This is an open access article distributed under the Creative Commons Attribution License, which permits unrestricted use, distribution, and reproduction in any medium, provided the original work is properly cited. ABSTRACT Obje ctive: To determine the prognostic value of the American Society of Anesthesiologists (ASA) classification and of the main clinical pathologic variables in renal cell carcinoma (RCC) patients who underwent surgical treatment. Me- thods: In this international collaborative study, 376 RCC patients who underwent partial nephrectomy (PN) or radical nephrectomy (RN) during the period 1989-2009 were assessed. The pathological data were reviewed by a single pa- thologist, and all of the surgically treated patients had been previously evaluated by a team of anesthesiologists and classified as ASA 1, ASA 2, or ASA 3. Results: In total, 318 patients were included in the study, with a mean follow- up of 48 months. Incidental tumors represented 47% of the cases, while 11.6% presented with metastases at diagnosis. Among the patients assessed, 38 (11.9%) were classified as ASA 1, 213 (67%) as ASA 2, and 67 (21.1%) as ASA 3. An association between the ASA classification and the main clinicopathological variables of RCC was observed. The uni- variate analysis for overall survival (OS) revealed significant differences in the survival curves according to the ASA classification (p < 0.001). High-grade neoplasms, the presence of metastasis at diagnosis, clinical stage III/IV, and inci- dental tumors remained as independent predictors of survival. Moreover, the multivariate analysis revealed a negative impact of the ASA classification on OS (p = 0.001). Conclusions: The present study demonstrated a correlation be- tween the ASA classification and the main prognostic factors of RCC and its impact on survival rates. ASA 3 patients had more aggressive tumors, increased risk of perioperative complications, and worse outcomes compared with ASA1 or ASA 2. Thus, the ASA classification may be considered an additional tool for assessing and planning the treatment of RCC patients. Keywords: Comorbidity; Renal Cell Carcinoma; ASA; Prognosis; Oncology 1. Introduction Renal cell carcinoma (RCC) accounts for 3% of malign- nant neoplasms in adults, and its incidence has increased over the last 20 years [1-3]. Although the incidental diag- nosis is increasing worldwide, the mortality has not de- creased [4]. The RCC evolution is unpredictable. Ap- proximately 30% of patients present with metastases at diagnosis, and approximately 40% of those individuals treated for localized disease may experience recurrence [5]. Most of the known prognostic factors are based on clinicopathologic variables such as the stage, grade, his- tologic type, and performance status (PS) [6,7]. The presence of symptoms at diagnosis indicates larger tu- mors that are more aggressive and have worse outcomes [8]. The angiogenesis, apoptosis, and cell cycle biomar- kers are underutilized in clinical practice and have a prognostic potential that is not yet well established for RCC [9]. The development of more accurate prognostic factors is extremely important for individualized thera- peutic planning [10-12]. RCC treatment with curative intent is primarily surgi- cal. With increasing longevity and an aging population, an increasing number of elderly RCC patients are candi- Copyright © 2013 SciRes. JCT  Use of the American Society of Anesthesiologists Classification as an Additional Planning Tool for Renal Cell Carcinoma Assessment 8 dates for curative treatments, and their potential comor- bidities should be considered [13]. Other patients, due to their reduced life expectancy, are candidates for vigilant observation protocols. Approximately 24% of RCC pa- tients have at least two comorbidities that are relevant to diagnosis [14]. Several evaluation and stratification mechanisms, such as the Karnofsky’s Performance Status (KPS) [15], the Eastern Cooperative Oncology Group (ECOG) [16], and the Charlson comorbidity index [17], can be used to evaluate this group of patients. However, these classifi- cations assess the impact of cancer on the individual’s general health, not considering the comorbidities and their impact on the outcome of these tumors. It has been recently reported that utilizing the American Society of Anesthesiologists (ASA) classification has a prognostic effect on survival rates and assessments of the metastatic risk in RCC patients [18]. Moreover, the impact of these comorbidities in the evolution of many tumors has been demonstrated, how- ever, the prognostic value in RCC patients and the asso- ciation with classical clinicopathologic variables are still poorly studied [19,20]. Therefore, the aim of this investigation was to evaluate the relevance and impact of classical clinicopathological variables and the influence of comorbidities assessed by the ASA classification on the survival rates of RCC pa- tients who underwent surgical treatment in a South Ame- rican collaborative study. 2. Material and Methods In total, 376 consecutive patients from two South Ame- rican centers were evaluated; the participants underwent radical nephrectomy (RN) or partial nephrectomy (PN) during the period from 1989 to 2009. The clinical data were obtained from medical records of the AC Camargo Hospital in São Paulo, Brazil, and from the Pasteur Hos- pital in Montevideo, Uruguay. The pathological data were reviewed and standardized by one experienced pa- thologist. Patients who had other malignancies, who un- derwent neoadjuvant treatment, who had incomplete data, and who had missed follow-up were excluded from the study, which featured a final sample of 318 pa- tients. The investigation was approved by the Brazilian National Committee for Ethics in Research (No. 549/ 2011). The ASA classification was performed preoperatively by the anesthesiology staff, and the patients were classi- fied as ASA 1, ASA 2 or ASA 3. Altogether, 77% of the subjects underwent RN, and 23% underwent PN. The mean age was 57.1 (14 - 86) years. Follow-up was con- ducted every 3 months during the first 2 years, and there- after, every 6 months. Metastasis assessment was per- formed via computerized tomography or magnetic reso- nance of the abdomen and pelvis and via chest radiogra- phy or total-body bone scintigraphy. The clinicopathological variables analyzed included age, gender, tobacco use, presence of symptoms at diag- nosis, type of surgery, stage (TNM, 2010) [21], Fuhr- man grade, ECOG, KPS, histological subtype, vascular and lymphatic invasion, presence of necrosis, lymph node involvement, adrenal involvement, early and late complications, follow-up period, and presence of meta- stases. The correlation between the ASA classification and the classical clinicopathological variables were eva- luated. The SPSS software for Windows, version 17.0 (SPSS Inc., Chicago, USA), was used for the statistical analysis. The comparison between the clinical and pathological variables and the ASA classification was performed us- ing the Pearson chi-square test. The variables with an ex- pected frequency <5 were analyzed using Fisher’s exact test. Overall survival (OS) was defined as the time interval between surgery and either the date of death or the last visit. Cancer-specific survival (CSS) was defined as the interval between surgery and either death from RCC or the last visit. The study of overall and specific survival in 5 years was performed by the Kaplan-Meier method, and the comparisons between the categories were performed using the log rank test. For the multivariate analysis and determination of variables with an impact on survival, the Cox proportional hazards model (backward stepwise) was used. The value of p < 0.05 was considered statisti- cally significant. 3. Results In total, 318 patients were evaluated with a mean follow- up of 48 months. Among the population studied, the ma- jority (60.3%) were male, 91% were white, and 107 (33.4%) were smokers. Incidental tumors accounted for 47% of cases, 37 patients (11.6%) exhibited metastases at diagnosis, and clear cell carcinoma was the most com- mon histological type found in 156 patients (74%). Table 1 shows clinical and epidemiological features and association with ASA classification of all patients. Thirty-eight patients (11.9%) were classified as ASA 1, 213 (67%) patients as ASA 2, and 67 (21.1%) patients as ASA 3. The ASA 3 patients were older than the ASA 1 and ASA 2 patients, with approximately 73% of ASA 3 patients in the range of 60 to 82 years of age. Metastases at diagnosis occurred in 23.9% of the ASA 3 patients, versus 10% (21 of 213) the ASA 2 patients. No ASA 1 patients had metastatic disease at diagnosis. The ASA 3 patients had 25% of the early complications and 18.8% of the late complications. Tab le 2 shows pathological Copyright © 2013 SciRes. JCT 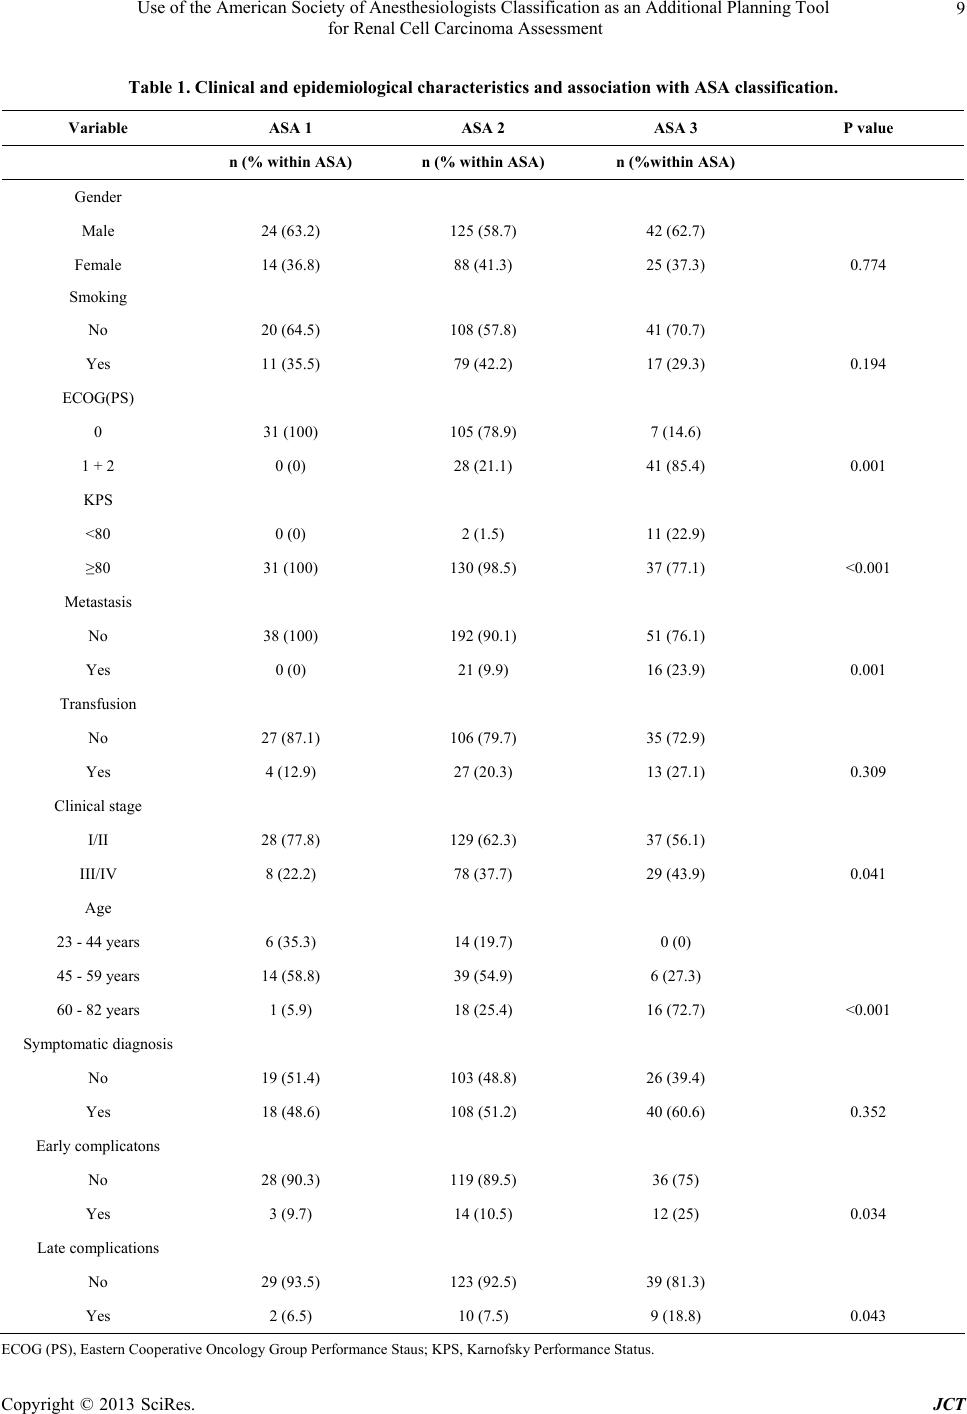 Use of the American Society of Anesthesiologists Classification as an Additional Planning Tool for Renal Cell Carcinoma Assessment Copyright © 2013 SciRes. JCT 9 Table 1. Clinical and epidemiological characteristics and association with ASA classification. Variable ASA 1 ASA 2 ASA 3 P value n (% within ASA) n (% within ASA) n (%within ASA) Gender Male 24 (63.2) 125 (58.7) 42 (62.7) Female 14 (36.8) 88 (41.3) 25 (37.3) 0.774 Smoking No 20 (64.5) 108 (57.8) 41 (70.7) Yes 11 (35.5) 79 (42.2) 17 (29.3) 0.194 ECOG(PS) 0 31 (100) 105 (78.9) 7 (14.6) 1 + 2 0 (0) 28 (21.1) 41 (85.4) 0.001 KPS <80 0 (0) 2 (1.5) 11 (22.9) ≥80 31 (100) 130 (98.5) 37 (77.1) <0.001 Metastasis No 38 (100) 192 (90.1) 51 (76.1) Yes 0 (0) 21 (9.9) 16 (23.9) 0.001 Transfusion No 27 (87.1) 106 (79.7) 35 (72.9) Yes 4 (12.9) 27 (20.3) 13 (27.1) 0.309 Clinical stage I/II 28 (77.8) 129 (62.3) 37 (56.1) III/IV 8 (22.2) 78 (37.7) 29 (43.9) 0.041 Age 23 - 44 years 6 (35.3) 14 (19.7) 0 (0) 45 - 59 years 14 (58.8) 39 (54.9) 6 (27.3) 60 - 82 years 1 (5.9) 18 (25.4) 16 (72.7) <0.001 Symptomatic diagnosis No 19 (51.4) 103 (48.8) 26 (39.4) Yes 18 (48.6) 108 (51.2) 40 (60.6) 0.352 Early complicatons No 28 (90.3) 119 (89.5) 36 (75) Yes 3 (9.7) 14 (10.5) 12 (25) 0.034 Late complications No 29 (93.5) 123 (92.5) 39 (81.3) Yes 2 (6.5) 10 (7.5) 9 (18.8) 0.043 ECOG (PS), Eastern Cooperative Oncology Group Performance Staus; KPS, Karnofsky Performance Status. 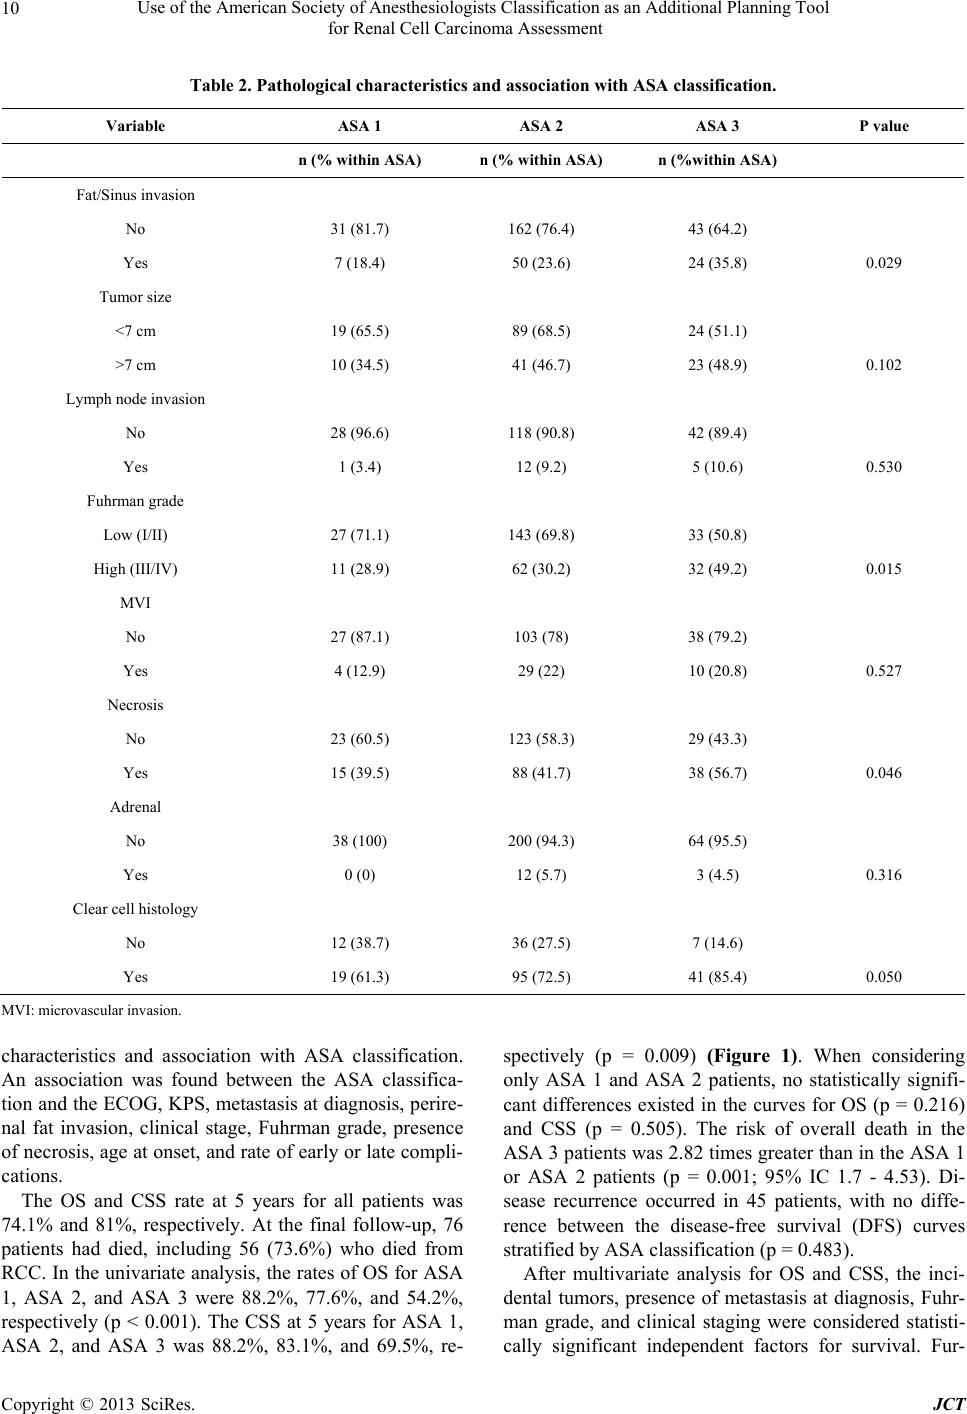 Use of the American Society of Anesthesiologists Classification as an Additional Planning Tool for Renal Cell Carcinoma Assessment 10 Table 2. Pathological characteristics and association with ASA classification. Variable ASA 1 ASA 2 ASA 3 P value n (% within ASA) n (% within ASA) n (%within ASA) Fat/Sinus invasion No 31 (81.7) 162 (76.4) 43 (64.2) Yes 7 (18.4) 50 (23.6) 24 (35.8) 0.029 Tumor size <7 cm 19 (65.5) 89 (68.5) 24 (51.1) >7 cm 10 (34.5) 41 (46.7) 23 (48.9) 0.102 Lymph node invasion No 28 (96.6) 118 (90.8) 42 (89.4) Yes 1 (3.4) 12 (9.2) 5 (10.6) 0.530 Fuhrman grade Low (I/II) 27 (71.1) 143 (69.8) 33 (50.8) High (III/IV) 11 (28.9) 62 (30.2) 32 (49.2) 0.015 MVI No 27 (87.1) 103 (78) 38 (79.2) Yes 4 (12.9) 29 (22) 10 (20.8) 0.527 Necrosis No 23 (60.5) 123 (58.3) 29 (43.3) Yes 15 (39.5) 88 (41.7) 38 (56.7) 0.046 Adrenal No 38 (100) 200 (94.3) 64 (95.5) Yes 0 (0) 12 (5.7) 3 (4.5) 0.316 Clear cell histology No 12 (38.7) 36 (27.5) 7 (14.6) Yes 19 (61.3) 95 (72.5) 41 (85.4) 0.050 MVI: microvascular invasion. characteristics and association with ASA classification. An association was found between the ASA classifica- tion and the ECOG, KPS, metastasis at diagnosis, perire- nal fat invasion, clinical stage, Fuhrman grade, presence of necrosis, age at onset, and rate of early or late compli- cations. The OS and CSS rate at 5 years for all patients was 74.1% and 81%, respectively. At the final follow-up, 76 patients had died, including 56 (73.6%) who died from RCC. In the univariate analysis, the rates of OS for ASA 1, ASA 2, and ASA 3 were 88.2%, 77.6%, and 54.2%, respectively (p < 0.001). The CSS at 5 years for ASA 1, ASA 2, and ASA 3 was 88.2%, 83.1%, and 69.5%, re- spectively (p = 0.009) (Figure 1). When considering only ASA 1 and ASA 2 patients, no statistically signifi- cant differences existed in the curves for OS (p = 0.216) and CSS (p = 0.505). The risk of overall death in the ASA 3 patients was 2.82 times greater than in the ASA 1 or ASA 2 patients (p = 0.001; 95% IC 1.7 - 4.53). Di- sease recurrence occurred in 45 patients, with no diffe- rence between the disease-free survival (DFS) curves stratified by ASA classification (p = 0.483). After multivariate analysis for OS and CSS, the inci- dental tumors, presence of metastasis at diagnosis, Fuhr- man grade, and clinical staging were considered statisti- cally significant independent factors for survival. Fur- Copyright © 2013 SciRes. JCT  Use of the American Society of Anesthesiologists Classification as an Additional Planning Tool for Renal Cell Carcinoma Assessment 11 thermore, the ASA classification also had a predictive impact on the OS (p = 0.010) (Table 3). The survival curve analysis stratified by ASA was also performed after the exclusion of 37 cases with metastases at diagnosis. Of the 281 cases of tumors without meta- stases, death by cancer occurred in 34 patients (12%). Death from other causes in patients with non-metastatic disease occurred in 19 patients (6.7%). The CSS at 5 years for ASA 1, ASA 2, and ASA 3 was 88.2%, 87.4%, and 83.7%, respectively (p = 0.646). An effect of ASA on the OS at 5 years after the exclusion of metastatic cases (p = 0.030) was also observed. At the final follow- up, 88.2% of the ASA 1 patients, 81.9% of the ASA 2 patients, and 62.8% of the ASA 3 patients were still alive. 4. Discussion The evaluation and prognosis of RCC patients are based on clinicopathological variables that are recognized by their capacity to predict survival, recurrence, and disease progression [22]. However, these prognostic factors alone cannot accurately differentiate tumors of low malignant potential from clinically relevant tumors. Thus, with an aging population and the gradual increase in chronic di- seases, interest in the study of the prognostic value of co- morbidities in patients with various tumors has increased [23]. The ASA classification has been widely employed to assess the risk of perioperative complications based on comorbidities [24]; however, use of the classification as a prognostic factor in cancer patients is still controversial [25]. In a retrospective study of more than 500 patients with urothelial bladder carcinoma who were subjected to cystectomy, Mayr et al. demonstrated the impact of co- morbidities assessed by the ASA classification on the cancer-specific mortality [26]. In a recent study from our group, Zequi et al. evalu- ated the ASA classification as a prognostic factor in 141 RCC patients subjected to surgical treatment. In that stu- dy, ASA-stratified patients exhibited effects on the OS, CSS, and DFS rates, as well as on the risk of developing metastases. The investigation also revealed that ASA-3 patients had fewer incidental tumors at diagnosis, thereby representing a group with high risks of death and disease progression compared with ASA 1 and 2 [18]. The present study confirmed the ASA classification’s impact on the OS of RCC patients after univariate and multivariate analysis. At the final follow-up, 45.7% of the ASA 3 patients, 22.3% of the ASA 2 patients, and only 11.7% of the ASA 1 patients had died. Considering only the 20 cases of non-oncological death, 11 patients (55%) were ASA 2, and nine patients (45%) were ASA 3. Thus, the risk of death from other causes was approxi- mately 4 times higher in the ASA 3 patients compared with the ASA 2 patients (p = 0.002). These findings demonstrate the importance and effect of comorbidities assessed by the ASA in the prognosis of patients sub- jected to surgical treatment for RCC. Moreover, it is not known whether the presence of several comorbidities affects the immune system of RCC patients, resulting in more biologically aggressive disease. The risk of death from other causes in patients with localized RCC was recently evaluated by Chang et al. [27]. In their study, factors such as advanced age, low (a) (b) Figure 1. Overall survival (OS) and disease specific survival (DSS) according ASA classification. (a) 5-year OS curves; (p < 0.001); (b) 5-year CSS curves (p = 0.003). Copyright © 2013 SciRes. JCT  Use of the American Society of Anesthesiologists Classification as an Additional Planning Tool for Renal Cell Carcinoma Assessment 12 Table 3. Cox regression analysis for overall survival (OS) and disease-specif ic surviva l (DSS). Feature 5-year OS 5-year DSS Univariate Multivariate Univariate Multivariate HR P value HR (95% CI) P valueHR P valueHR (95% CI) P value ASA score <0.001 0.010 0.040 0.894 1 1.0 (Reference) 1.0 (Reference) 1.0 (Reference) 1.0 (Reference) 2 1.858 2.195 (0.296 - 16.858) 1.416 0.693 (0.096 - 5.002) 3 4.907 8.650 (1.052 - 71.148) 3.121 1.186 (0.097 - 14.468) MVI 3.661 <0.001 1.956 (0.740 - 5.170)0.1765.172<0.0011.868 (0.646 - 5.399)0.249 Necrosis 2.502 <0.001 1.864 (0.799 - 4.344)0.1494.107<0.0011.082 (0.336 - 3.487)0.895 Adrenal 2.309 0.035 1.123 (0.181 - 6.982)0.9013.2650.003 0.566 (0.138 - 2.314)0.428 Metastasis 6.594 <0.001 2.780 (1.048 - 7.377)0.0408.961<0.0014.686 (1.809 - 12.103)0.001 Renal vein invasion 2.198 0.006 0.642 (0.237 - 1.737)0.3832.737<0.0010.479 (0.167 - 1.374)0.171 Fat/Sinus invasion 2.282 <0.001 0.556 (0.212 - 1.461)0.2343.250<0.0010.799 (0.238 - 2.682)0.717 Lymph nodes invasion 6.257 <0.001 1.223 (0.446 - 3.353)0.6958.130<0.0011.723 (0.446 - 6.660)0.430 Symptomatic vs Incidental tumors 3.582 <0.001 2.989 (1.108 - 8.066)0.0315.294<0.0013.495 (1.007 - 12.128)0.049 ECOG PS (1 + 2 vs 0) 2.527 0.002 0.913 (0.269 - 3.097)0.8842.3560.009 1.071 (0.330 - 3.480)0.640 KPS (<80 vs ≥80) 3.122 0.010 0.665 (0.160 - 2.767)0.6392.3570.105 1.407 (0.207 - 9.557)0.727 Tumor size (>7 cm vs <7 cm) 6.086 <0.001 1.086 (0.379 - 3.116)0.87810.590<0.0012.088 (0.637 - 6.846)0.224 Clinical stage (III/IV vs I/II) 3.481 <0.001 5.374 (1.967 - 14.681)0.0016.499<0.0018.710 (1.863 - 40.718)0.006 Fuhrman grade (high vs low) 3.202 <0.001 3.298 (1.546 - 7.033)0.0024.189<0.0012.837 (1.107 - 7.270)0.030 HR, hazard ratio; CI, confidence interval; MVI, microvascular invasion. body mass index, and an ASA score of 3 to 4 were inde- pendent predictors of non-cancer-related death. Berdijis et al. [28] evaluated 1,023 patients subjected to surgical treatment for RCC and demonstrated that the morbidity and mortality did not increase with age; however, there was a positive correlation with the ASA classification. In an epidemiologic study of almost 1400 RCC patients, hypertension and diabetes were present in 58% and 17% of the patients, respectively [29]. Thus, the presence of comorbidities assessed by the ASA classification is asso- ciated with increased morbidity and mortality during RCC treatment and may influence the therapy. Our re- sults revealed that the percentage of perioperative com- plications in the ASA 1, ASA 2, and ASA 3 patients was 16.1%, 15.8%, and 29.2%, respectively. The risk of early or late complications in the ASA 3 patients was at least double that of the ASA or ASA 2 patients, combined (odds ratio, 2.18; p = 0.038). Further results demonstrated an association between the ASA classification and the main clinicopathological variables, contrary to the findings of Han et al. [30]. Of the ASA 3 patients in the present study, 23.9% had meta- stases at diagnosis, which was a risk 2.86 times greater than in the ASA 2 patients (p = 0.003). None of the ASA 1 patients exhibited metastatic disease. Furthermore, among the ASA 3 patients, nearly one-half had high- grade disease. Perirenal fat invasion, advanced clinical stage, age, presence of necrosis, and measures of PS (such as ECOG and KPS) were also associated with a higher ASA classification. Approximately 23% of the ASA 3 patients had KPS < 80, and all of the ASA 1 pa- tients were classified as ECOG 0. Thus, considering the whole sample, the patients stratified as ASA 3 had disea- se with more criteria of aggressiveness and an important impact on PS scales such as KPS and ECOG. By contrast, after the exclusion of cases with metasta- sis at diagnosis, no association was observed between the main tumor-dependent variables and the ASA stratifica- tion, thus characterizing the aggressiveness of tumors that presented with metastatic disease. However, in this group of patients, the ASA stratification was associated with patient-dependent variables such as the ECOG, KPS, and age. Patients with metastases rapidly progress to death and should be treated more aggressively. However, Copyright © 2013 SciRes. JCT  Use of the American Society of Anesthesiologists Classification as an Additional Planning Tool for Renal Cell Carcinoma Assessment 13 if the patient has a high number of comorbidities, then the validity of this approach might be reconsidered. An important application of evaluating the ASA clas- sification might involve non-metastatic patients, patients with small renal masses, elderly individuals, or those with multiple comorbidities. Whereas ASA 3 patients exhibit shorter survivals, higher risk of death from other causes, and increased risk of perioperative complications, perhaps this group of patients could be spared from the more aggressive treatments. In addition to the ASA classification, prognostic fac- tors such as the Fuhrman grade, presence of metastasis at diagnosis, clinical stage, and incidental tumors remained as independent predictive variables of OS and CSS. Our study is limited by its retrospective nature and its being composed of a historic series from two institutions over a long period. Moreover, the ASA classification has a subjective aspect; however, it is time honored, is easily memorized, and has the advantage of being prescribed by another professional, thereby avoiding surgeon bias. In addition, this classification is already routinely available within medical records (requiring no additional develop- ment costs), is recognized worldwide, and allows for the scientific standardization of information. The present study demonstrated the negative impact of the ASA classification on survival rates and its associa- tion with the main RCC prognostic variables. It is estab- lished that RCC management should be performed indi- vidually, considering the patient’s life expectancy, asso- ciated risks, and comorbidities. Thus, the ASA classifica- tion may be used as an additional tool for assessing and planning the treatment of RCC patients, based on its cli- nical applicability, easy access during the preoperative routine, and high reproducibility. 5. Conclusion The present study demonstrated the value and impact of the ASA classification as an independent predictor of OS in RCC patients who underwent surgical treatment and revealed the association between the ASA classification and the major prognostic variables. Based on these find- ings, the ASA classification may also be employed as an additional predictive tool for managing RCC patients with limited life expectancies or patients with multiple comorbidities. Furthermore, the ASA classification may facilitate the evaluation of candidates for active surveil- lance protocols or minimally invasive treatments, as an addition to the already established prognostic factors. REFERENCES [1] U. N. Vaishampayan, H. Do, M. Hussain, et al., “Racial Disparity in Incidence Patterns and Outcome of Kidney Cancer,” Urology, Vol. 62, No. 6, 2003, pp. 1012-1017. doi:10.1016/j.urology.2003.07.010 [2] L. M. Hock, J. Lynch and K. C. Balaji, “Increasing Inci- dence of All Stages of Kidney Cancer in the Last 2 Deca- des in the United States: An Analysis of Surveillance, Epidemiology and End Results Program Data,” Journal of Urology, Vol. 167, No. 1, 2002, pp. 57-60 doi:10.1016/S0022-5347(05)65382-7 [3] E. M. Wallen R. S. Pruthi, G. F. Joyce, et al., “Kidney Cancer,” Journal of Urology, Vol. 177, No. 6, 2007, pp. 2006-2019. doi:10.1016/j.juro.2007.01.126 [4] A. Jemal, R. Siegel, E. Ward, T. Murray, J. Xu and M. J. Thun, “Cancer Statistics, 2007,” CA: A Cancer Journal for Clinicians, Vol. 57, No. 1, 2007, pp. 43-66. doi:10.3322/canjclin.57.1.43 [5] J. A. Kontak and S. C. Campbell, “Prognostic Factors in Renal Cell Carcinoma,” Urologic Clinics of North Ameri- ca, Vol. 30, No. 3, 2003, pp. 467-480. doi:10.1016/S0094-0143(03)00020-X [6] I. Frank, M. L. Blute, J. C. Cheville, et al., “Solid Renal tumors: An Analysis of Pathological Features Related to Tumor Size,” Journal of Urology, Vol. 170, No. 6, 2003, pp. 2217-2220. doi:10.1097/01.ju.0000095475.12515.5e [7] M. Sorbellini, M. W. Kattan, M. E. Snyder, et al., “A Po- stoperative Prognostic Nomogram Predicting Recurrence for Patients with Conventionalclear Cell Renal Cell Car- cinoma,” Journal of Urology, Vol. 173, No. 1, 2005, pp. 48-51. doi:10.1097/01.ju.0000148261.19532.2c [8] H. L. Kim, A. S. Belldegrun, D. G. Freitas, M. H. Bui, K. R. Han, F. J. Dorey and R. A. Figlin, “Paraneoplastic signs and Symptoms of Renal Cell Carcinoma: Implica- tions for Prognosis,” Journal of Urology, Vol. 170, No. 5, 2003, pp. 1742-1746. doi:10.1097/01.ju.0000092764.81308.6a [9] H. L. Kim, D. Seligson, X. Liu, et al., “Using Tumor Markers to Predict the Survival of Patients with Metasta- tic Renal Cell Carcinoma,” Journal of Urology, Vol. 173, No. 5, 2005, pp. 1496-1501. doi:10.1097/01.ju.0000154351.37249.f0 [10] K. Gupta, J. D. Miller, J.Z. Li, M. W. Russell and C. Charbonneau, “Epidemiologic and Socioeconomic Bur- den of Metastatic Renal Cell Carcinoma (mRCC): A Lite- rature Review,” Cancer Treatment Reviews, Vol. 34, No. 3, 2008, pp. 193-205. doi:10.1016/j.ctrv.2007.12.001 [11] K. Kanao, R. Mizuno, E. Kikuchi, et al., “Preoperative Prognostic Nomogram (Probability Table) for Renal Cell Carcinoma Based on TNM Classification,” Journal of Urology, Vol. 181, No. 2, 2009, pp. 480-485. doi:10.1016/j.juro.2008.10.017 [12] C. Eichelberg, K. Junker, B. Ljungberg and H. Moch, “Diagnostic and Prognostic Molecular Markers for Renal Cell Carcinoma: A Critical Appraisal of the Current State of Research and Clinical,” European Urology, Vol. 55, No. 4, 2009, pp. 851-863. doi:10.1016/j.eururo.2009.01.003 [13] D. L. Katz, T. Zheng, T. R. Holford and J. Flannery, “Time Trends in the Incidence of Renal Carcinoma: Ana- lysis of Connecticut Tumor Registry Data, 1935-1989,” Copyright © 2013 SciRes. JCT  Use of the American Society of Anesthesiologists Classification as an Additional Planning Tool for Renal Cell Carcinoma Assessment Copyright © 2013 SciRes. JCT 14 International Journal of Cancer, Vol. 58, No. 1, 1994, pp. 57-63. doi:10.1002/ijc.2910580111 [14] D. C. Miller, J. Ruterbusch, J. S. Colt, F. G. Davis, W. M. Linehan, W. H. Chow and K. Schwartz, “Contemporary Clinical Epidemiology of Renal Cell Carcinoma: Insight from a Population Based Case-Control Study,” Journal of Urology, Vol. 184, No. 6, 2010, pp. 2254-2258. doi:10.1016/j.juro.2010.08.018 [15] D. A. Karnofsky and J. H. Burchenal, “The Clinical Evaluation of Chemotherapeutic Agents in Cancer,” In: C. M. MacLeod, Ed., Evaluation of Chemotherapeutic Agents, Columbia University Press, New York, 1949, P. 196. [16] O. Shvarts, J. S. Lam, H. L. Kim, K. R. Han, R. Figlin and A. Belldegrun, “Eastern Cooperative Oncology Group Performance Status Predicts Bone Metastasis in Patients Presenting with Renal Cell Carcinoma: Implication for Preoperative Bone Scans,” Journal of Urology, Vol. 172, No. 3, 2004, pp. 867-870. doi:10.1097/01.ju.0000135803.91207.b0 [17] M. H. Ather and S. M. Nazim, “Impact of Charlson’s Comorbidity Index on Overall Survival Following Tumor Nephrectomy for Renal Cell Carcinoma,” International Urology and Nephrology, Vol. 42, No. 2, 2010, pp. 299- 303. doi:10.1007/s11255-009-9636-8 [18] S. de Cássio Zequi, E. C. de Campos, G. C. Guimarães, W. Bachega Jr., F. P. da Fonseca and A. Lopes, “The Use of the American Society of Anesthesiology Classification as a Prognostic Factor in Patients with Renal Cell Carci- noma,” Urologia Internationalis, Vol. 84, No. 1, 2010, pp. 67-72. doi:10.1159/000273469 [19] A. Zisman, A. J. Pantuck, F. Dorey, D. H. Chao, B. J. Gitlitz, N. Moldawer, D. Lazarovici, J. B. de Kernion, R. A. Figlin and A. S. Belldegrun, “Mathematical Model to Predict Individual Survival for Patients with Renal Cell Carcinoma,” Journal of Clinical Oncology, Vol. 20, No. 5, 2002, pp. 1368-1374. doi:10.1200/JCO.20.5.1368 [20] K. R. Han, I. Bleumer, A. J. Pantuck, H. L. Kim, F. J. Dorey, N. K. Janzen, A. Zisman, C. P. Dinney, C. G. Wood, D. A. Swanson, J. W. Said, R. A. Figlin, P. F. Mulders and A. S. Belldegrun, “Validation of an Inte- grated Staging System toward Improved Prognostication of Patients with Localized Renal Cell Carcinoma in an International Population,” Journal of Urology, Vol. 170, No. 6, 2003, pp. 2221-2224. doi:10.1097/01.ju.0000096049.64863.a1 [21] G. Novara, et al., “Validation of the 2009 TNM Version in a Large Multi-Institutional Cohort of Patients Treated for Renal Cell Carcinoma: Are Further Improvements Needed?” European Urology, Vol. 58, No. 4, 2010, pp. 588-595. doi:10.1016/j.eururo.2010.07.006 [22] A. Volpe and J. J. Patard, “Prognostic Factors in Renal Cell Carcinoma,” World Journal of Urology, Vol. 28, No. 3, 2010, pp. 319-327. doi:10.1007/s00345-010-0540-8 [23] D. A. Berger, I. I. Megwalu, A. Vlahiotis, M. H. Radwan, M. F. Serrano, P. A. Humphrey, J. F. Piccirillo and A. S. Kibel “Impact of Comorbidity on Overall Survival in Pa- tients Surgically Treated for Renal Cell Carcinoma,” Uro- logy, Vol. 72, No. 2, 2008, pp. 359-363. doi:10.1016/j.urology.2008.02.061 [24] A. S. Keats, “The ASA Classification of Physical Status—A Recapitulation,” Anesthesiology, Vol. 49, No. 4, 1978, pp. 233-236. doi:10.1097/00000542-197810000-00001 [25] M. Froehner, R. Koch, R. J. Litz, S. Oehlschlaeger, O. W. Hakenberg and M. P. Wirth, “Feasibility and Limitations of Comorbidity Measurement in Patients Undergoing Radical Prostatectomy,” European Urology, Vol. 47, No. 2, 2005, pp. 190-195. doi:10.1016/j.eururo.2004.07.031 [26] R. Mayr, M. May, T. Martini, M. Lodde, E. Comploj, A. Pycha, J. Strobel, S. Denzinger, W. Otto, W. Wieland, M. Burger and H. M. Fritsche, “Comorbidity and Perform- ance Indices as Predictors of Cancer-Independent Morta- lity But Not of Cancer-Specific Mortality after Radical Cystectomy for Urothelial Carcinoma of the Bladder,” European Urology, 2012, Vol. 62, No. 4, pp. 662-760. doi:10.1016/j.eururo.2012.03.057 [27] J. S. Chang, Y. H. Park, J. H. Ku, C. Kwak and H. H. Kim, “Predicting Factors for Death from Other Causes in Patients with Localized Renal Cell Carcinoma,” Korean Journal of Urology, 2012, Vol. 53, No. 1, pp. 18-22. doi:10.4111/kju.2012.53.1.18 [28] N. Berdjis, O. W. Hakenberg, V. Novotny, et al., “Treat- ing Renal Cancer in the Elderly,” BJU International, 2006, Vol. 97, No. 4, pp. 703-705. doi:10.1111/j.1464-410X.2006.06015.x [29] D. C. Miller, J. Ruterbusch, J. S. Colt, F. G. Davis, W. M. Linehan, W. H. Chow and K. Schwartz, “Contemporary Clinical Epidemiology of Renal Cell Carcinoma: Insight from a Population Based Case-Control Study,” Journal of Urology, 2010, Vol. 184, No. 6, pp. 2254-2258. doi:10.1016/j.juro.2010.08.018 [30] K. R. Han, H. L. Kim, A. J. Pantuck, F. J. Dorey, R. A. Figlin and A. S. Belldegrun, “Use of American Society of Anesthesiologists Physical Status Classification to Assess Perioperative Risk in Patients Undergoing Radical Ne- phrectomy for Renal Cell Carcinoma,” Urology, 2004, Vol. 63, No. 5, pp. 841-846. doi:10.1016/j.urology.2003.12.048
|