Paper Menu >>
Journal Menu >>
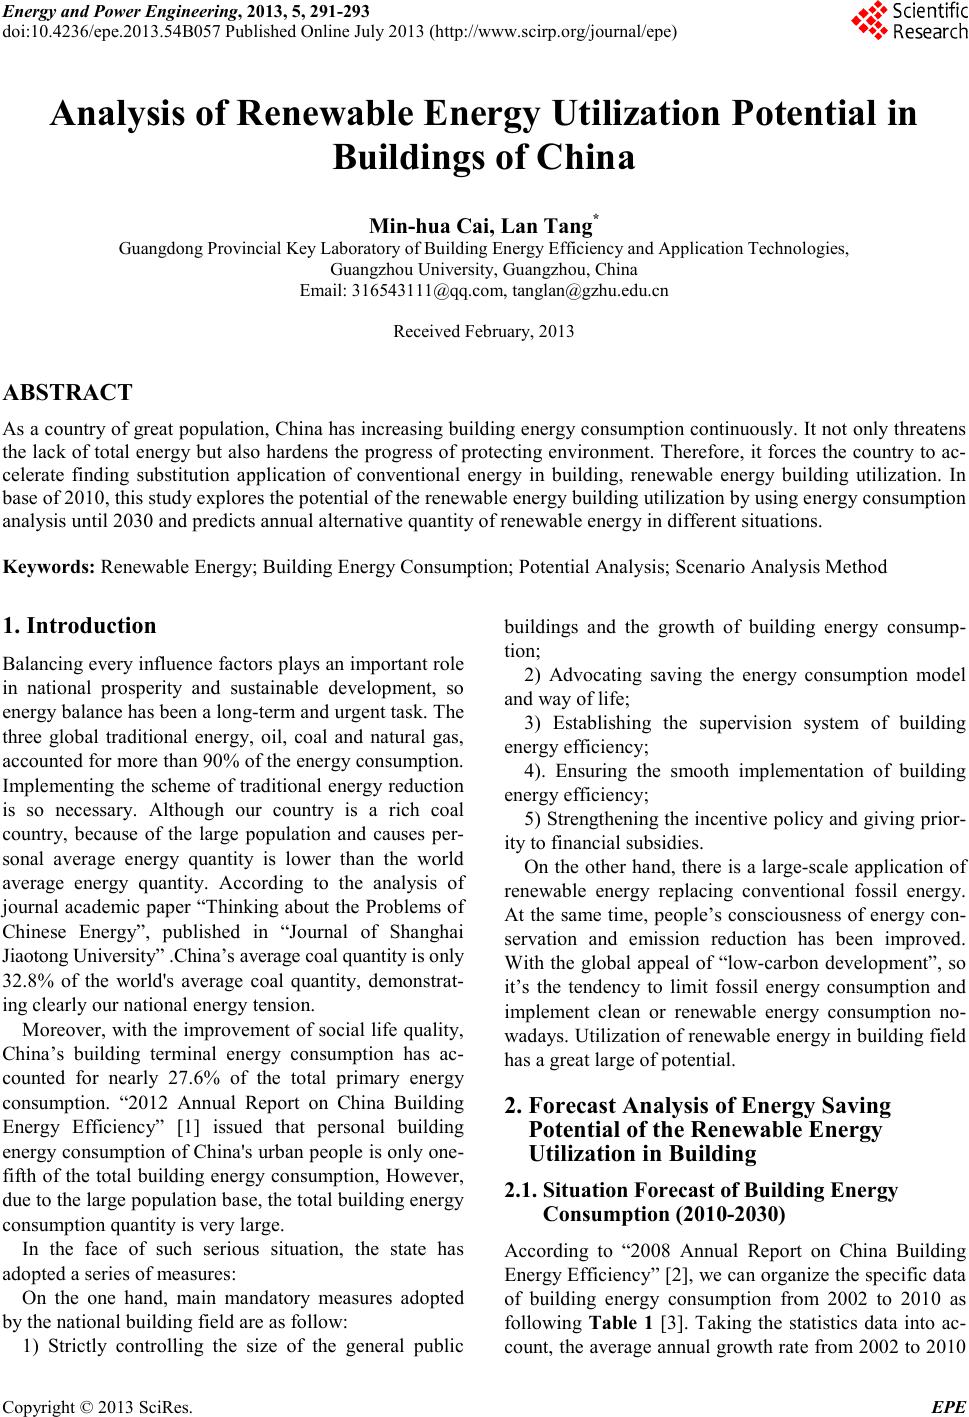 Energy and Power E ngineering, 2013, 5, 291-293 doi:10.4236 /epe.2013.54B057 Published Online July 2013 (http://www.scirp.org/journal/epe) Copyright © 2013 SciRes. EPE Analysis of Renewable Energy Utilization Potential in Buildings of China Min-hua Cai, Lan Tang* Guangdong Provincial Key Laboratory of Building Energy Efficiency and Application Technologies, Guangzhou University, Guangzhou, China Email: 316543111@qq.com, tanglan@gzhu.edu.cn Received February, 2013 ABSTRACT As a co untry of gr eat p opulat ion, Chi na has increasing buil ding e nerg y consu mptio n continuo usl y. It not only thre atens the lack of total energy but also hardens the progress of protecting environment. Therefore, it forces the country to ac- celerate finding substitution application of conventional energy in building, renewable energy building utilization. In base of 2010, this study explores the potential of the renewable energy building utilization by using energy consumption analysis until 2030 and predicts annual alternative quantity of renewable energy in different situations. Keywords: Renewa ble E nergy; Buildi ng Energy Consumption; Potentia l Analysis; Scenari o Analysis Me thod 1. Introduction Balancing every influence factors plays an important role in national prosperity and sustainable development, so energy balance has been a long-term and urgent task. The three global traditional energy, oil, coal and natural gas, accounted for more than 90% of the energy consumption. Implementing the scheme of traditional energy reduction is so necessary. Although our country is a rich coal country, because of the large population and causes per- sonal average energy quantity is lower than the world average energy quantity. According to the analysis of journal academic paper “Thinking about the Problems of Chinese Energy”, published in “Journal of Shanghai Jiaotong University” .China’s average coal quantity is only 32.8% of the world's average coal quantity, demonstrat- ing cle arl y our national energy tension. Moreo ver, with the improvement of social life quality, China’s building terminal energy consumption has ac- counted for nearly 27.6% of the total primary energy consumption. “2012 Annual Report on China Building Energy Ef ficie ncy” [1] issued that personal building energy consumption of China 's urba n people is o nly o ne - fifth of the total building energy consumption, However, due to the large population base, the total building energy consumption q uantity is very large. In the face of such serious situation, the state has adopted a series of measures: On the one hand, main mandatory measures adopted by the national building field are as follow: 1) Strictly controlling the size of the general public buildings and the growth of building energy consump- tion; 2) Advocating saving the energy consumption model and way o f life ; 3) Establishing the supervision system of building energ y efficiency; 4). Ensuring the smooth implementation of building ener gy efficiency; 5) Strengthe ning the ince ntive polic y and givi ng pr ior- ity to financial s ub sidies. On the other ha nd, ther e is a la rge-scale application of renewable energy replacing conventional fossil energy. At the same time, people’s consciousness of energy con- servation and emission reduction has been improved. With the global appeal of “low-carbon development”, so it’s the tendency to limit fossil energy consumption and implement clean or renewable energy consumption no- wadays. Utiliza tion of r enewab le ener gy in build ing fie ld has a great large of potential. 2. Forecast Analysis of Energy Saving Potential of the Renewable Energy Utilization in Building 2.1. Situat ion Forecast of Building Energy Consumption (2010-2030) According to “2008 Annual Report on China Building Energy Effic iency” [2], we can organize the specific data of building energy consumption from 2002 to 2010 as following Table 1 [3]. Taking the statistics data into ac- count, the average annual growth rate from 2002 to 2010  M.-H. CAI, L. TAN G Copyright © 2013 SciRes. EPE 292 comes out to be 12.64% .This is the reality state of building e nergy consumption gro wth recentl y. According to Chinese long-term planning of energy [4], the total energy consumption should be controlled bellow 4.2 billion tce until 2020, wit h 20% ~ 25% occu- pied by building energy consumption. So the average annua l gro wth rat e of buil ding energ y co nsumpti on from 2010 to 2030 can come out to be 0.9%, while assuming 1 billion tce in 2020. This is the ideal state of building energy consumption growth. During 2010 to 2030, with the development of the so- cial mechanism and social progress, the state begins to pay more and more attention to building energy saving and introduces some corresponding laws or regulations. It improves the construction equipment efficiency by means of the improved science and technology. The so- ciety has formed a mature saving energy consumption lifestyle and so on .These lowers average annual growth rate. Taking a comprehensive consideration of the influ- ence, we can set a n avera ge a nnual growth r ate o f 4.0 0% and forecast the development of building energy con- sumption from 2010 to 2030 (as Table 2) 2.2. The Alterna tive Quan tit y of Renewable Energy in Building Energy Consumption (2010-2030) (Baseline Scenario) According to the published alternative quantity of re- newable energy in 2010 and the index achieved by “the Medium and Long-term Development Plan of Renewable Energ y” [4] until 2020, we can calculate the alternative quantity growth trend of renewable energy in building energy consumption and predict alternative data of 2010 to 2030. By the end of 2010 [5] ,the installation of solar energy water heater amounts to 168 million square me- ters and its alternative fossil energy is about 20 million tons of standard coal; Roof photovoltaic power genera- tion project is up to 4.4 billion kilowatt hour, which re- duces 1.42 million tons of standard coal; Ground source heat Table 1. The development of building energy consumption from 2002 to 2010 (unit: ten thousand tce). Year 2002 2004 2006 2008 2010 North town heating 8584 12925 1 6205 17985 16330 Residential (except the no r t he rn he at i ng ) 11228 12787 14623 16290 47910 Public bu ildings (except the northern heating) 12229 26018 18716 30595 17370 total 32041 51730 49544 64870 83620 annua l rate of growth (%) 6.29 35.32 8.77 16.90 14.23 pump can save 4.6 million tons of standard coal; Me- thane is about 14 billion cubic meters and its alternative energy is 11.14 million tons of standard coal. The total alternative quantity is about 37.16 million tons of stan- dard coal (shown as Table 3), accounting for 4.44% of building e nergy consumption. In 2010, the solar energy water heater area is 168 mil- lion square meters and planning area of 2020 [5] is 800 million square meters. Refer to the growth speed of re- newable energy production from 2010 to 2020, the aver- age annual growth rate comes out to be 16.89%. There- fore we can predict the alternative quantity of solar energy Table 2. The prediction of building energy consumption from 2010 to 2030. Year Population (hundred million) Building area (hundred Million m2) Building energy consumption (hundred million tce) Personal building energy consumption (kgce/per) 2010 13.40 453 8.36 623.88 2015 13.70 513.17 10.17 742.57 2020 14.00 569.36 18.32 1308.28 2030 14.50 632.05 27.11 1870.08 Table 3. the alternative quantity prediction of renewable energy in building energy consumption from 2010 to 2030 (conve r ted into ten thousand tce/year). year 2010 2015 2020 2030 Solar water heater ten thousand m2 16800 34661 80000 230000 ten thousand tc e/year 2000 3943 9100 26163 Roof photovolta ic power generation hundred million kW ⋅ h 44 62 188 804 ten thousand tc e/year 142 201 6 08 2605 Shallow Geothermal energy ten thousand tc e/year 460 1000 2200 10522 Methane hundred million m3 140 200 440 1383 ten t housand tc e/year 1114 1591 3500 11000 Total ten thousand tc e/year 3716 6735 15408 50289 Proportion in building energy consumption % 4.44 6.62 10.06 22.18  M.-H. CAI, L. TAN G Copyright © 2013 SciRes. EPE 293 Table 4. Prediction of renewable energy in building energy consumption under different situations from 2010 to 2030 (conve r ted into ten thousand tce/year). N year 2010 2015 2020 2030 1 ba seline scenario 3716 6735 15408 5 0289 Proportion(%) 4.44 6.62 10.06 22.18 2 People know deeply 3901 7071 16179 52804 Proportion(%) 4.67 6.95 10.56 23.29 3 Well-establ is he d p o licy 4087 7408 16949 55318 Proportion(%) 4.89 7.28 11.06 24.40 4 Mat ure technol o gy 4087 7408 16949 55318 Proportion(%) 4.89 7.28 11.06 24.40 5 People know deeply + Well-establ is he d p o licy 4273 7745 17719 57832 Proportion(%) 5.11 7.61 11.57 25.51 6 People know deeply+Mature techn ology 4273 7745 17719 57832 Proportion(%) 5.11 7.61 11.57 25.51 N year 2010 2015 2020 2030 7 Well-establish-ed policy + Mat ure technol o gy 4459 8081 18490 60347 Proportion(%) 5.33 7.95 12.07 26.61 8 Best scene 4645 8418 19260 62861 Proportion(%) 5.56 8.28 12.57 27.72 Proportion: the prop ortion of renewable energy consumption in total build- ing energy consumption. water heater in 2015 and 2030. According to the same calculation methods, the alternative quantity of roof photovoltaic power generation, shallow geothermal energy and methane can be respectively predicted from 2010 to 2030 and the related data converted into unity unit: te n t ho usand t ce/year, shown in Table 3. Until 2030, renewable energy in building applications can save 502.89 million tce and is 13.5 times that of 2010, ac- counting for 22.18% of the total energy consumption. It can ease the shortage of conventional energy sources which can be used in any other field. 2.3. The Alterna tive Quan tit y of Renewable Energy in Building Energy Consumption under Different Situations (2010-2030) In the situa tional a nal ysis, b ecause of the popular ut iliza- tion technology of the renewable energy in building, we can assume 5% of increase rate. Moreover, due to the standard system and incentive policy improvement, it makes the alternative quantity increased by 10%. Besides, it will be increased b y 10% due to the mature utilization technology of renewable energy. In these ways, this re- search explores the alternative quantity of renewable energy in building under various situations (shown as Table 4). When it comes to be the best scene, which means people know deeply, standard system and incentive pol- icy of renewable energy construction become more per- fect and utilization technology of renewable energy is mature, the alternative quantity is up to 628.61 million tce, accounting for 27.72% of building energy consump- tion. It’s 125.72 million tce more than baseline scenario. 3. Conclusions Based on 2010, this study explores the potential of re- newable energy development in building energy con- sumption in 2030 and uses scenario analysis method to predict the alternative quantity of renewable energy in different situations. So the relevant departments led to realizing energy saving direction and key areas of re- newab le e nerg y in the f utur e. It will be bo und to improve the building integration technology and perfect building design specif ic a tions. 4. Acknowled ge ments We thank the support from the National Natural Science Foundation of China (51078092), “Yangcheng scholar” project of Education Bureau of Guangzhou (10A039G) and G uangz hou cit y-be longe d uni versi ty research project of E ducation Burea u of Guangzhou (10A020). REFERENCES [1] Qinghua University Building Energy Research Center, 2012 Annual Report on China Building Energy Efficien- cy, 2012. [2] Qinghua University Building Energy Research Center, 2008 Annual Report on China Building Energy E fficien- cy, 2008 [3] National Bureau of Statistics of the People's Republic of China, 2001-2011China Statistical Yearbook, 2001-2011. [4] National Development and Reform Commission of the People's Republic of China, Medium and Long-term De- velopment Plan of Renewable Energy of the People's Republi c of China, 2007. [5] National Energy Bureau of the People's Republic of Chi- na, Renewable Energy Development 1025 planning, 2012. |