S. LENG ET AL. 271
and classify the information modules. An analysis pro-
gram is designed to complete the automatic modeling
process.
1) User needs to co mplete the drawing work of device
configuration, user use the created module stencils and
signal line class to complete the configuration diagram.
After the completion of the diagram, assignment function
of the form class is used to complete the assignment of
the common cause group and module in configuration
diagram. According to the objects classification in Table
1, different types of objects must assigned different
properties and methods.
2) After the connection relation is checked, user can
analyze the configuration diagram. Visio Automation
software technology is used to get the object and its
properties and methods. The process of analysis is shown
as the automatic modeling part in Figure 1. At beginning,
the program gets the signal line, then the up- stream and
downstream information module is obtained. Then user
can analyze the feature of object to get the properties and
methods. After the analysis of the module and connection
relations and taking the failure mode into accoun t, a fault
tree file is generated.
3) User inputs the fault tree files through the interface
with Risk Spectrum, the nuclear power safety I&C sys-
tem configuration fault tree analysis work is completed.
3. Safety Configurations Implementation
In this paper, the automatic modeling method is used to
simplify the modeling work of fault tree for nuclear
power safety I&C configuration. The fault tree files are
generated follow the process of automatic modeling, the
structure of the process is shown in Figure 1. After the
fault tree is built, the correctness of automatic modeling
of fault tree must be verified. The implementation can be
divided into two typical parts: the measurement signals
configuration and channel group configuration. After the
implementation, the accuracy of automatic modeling
work is verified deeply and comprehensively.
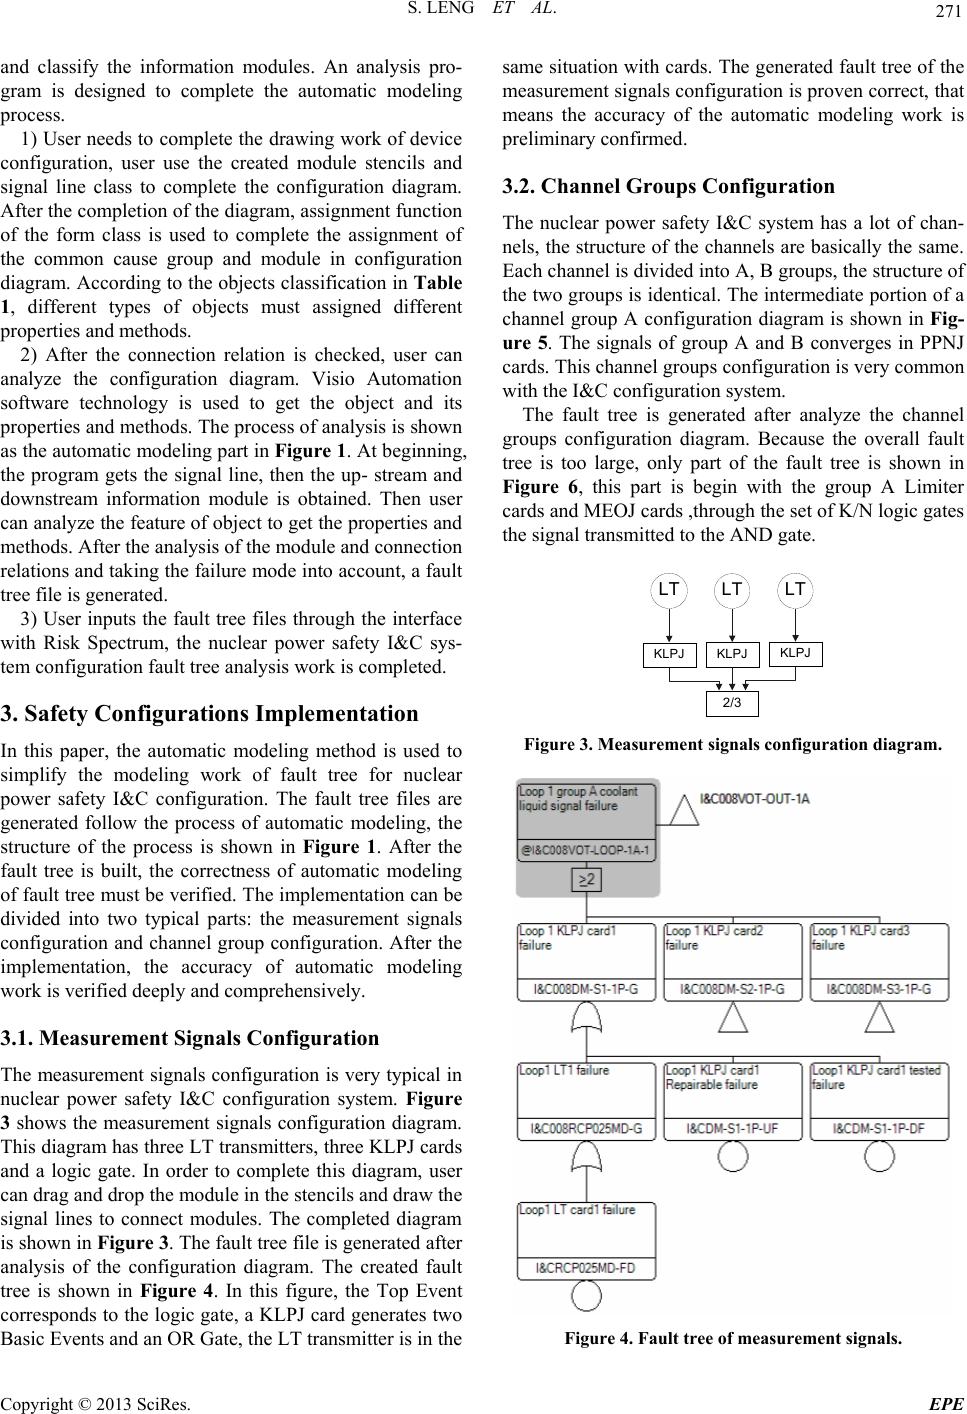
3.1. Measurement Signals Configuration
The measurement signals configuration is very typical in
nuclear power safety I&C configuration system. Figure
3 shows the measurement signals configuration diagram.
This diagram has three LT transmitters, three KLPJ cards
and a logic gate. In order to complete this diagram, user
can drag and drop the module in the stencils and draw the
signal lines to connect modules. The completed diagram
is shown in Figure 3. The fault tree file is generated after
analysis of the configuration diagram. The created fault
tree is shown in Figure 4. In this figure, the Top Event
corresponds to the logic gate, a KLPJ card generates two
Basic Events and an OR Gate, the LT transmitter is in the
same situation with cards. The generated fault tree of the
measurement signals configuration is proven correct, that
means the accuracy of the automatic modeling work is
preliminary confirmed.
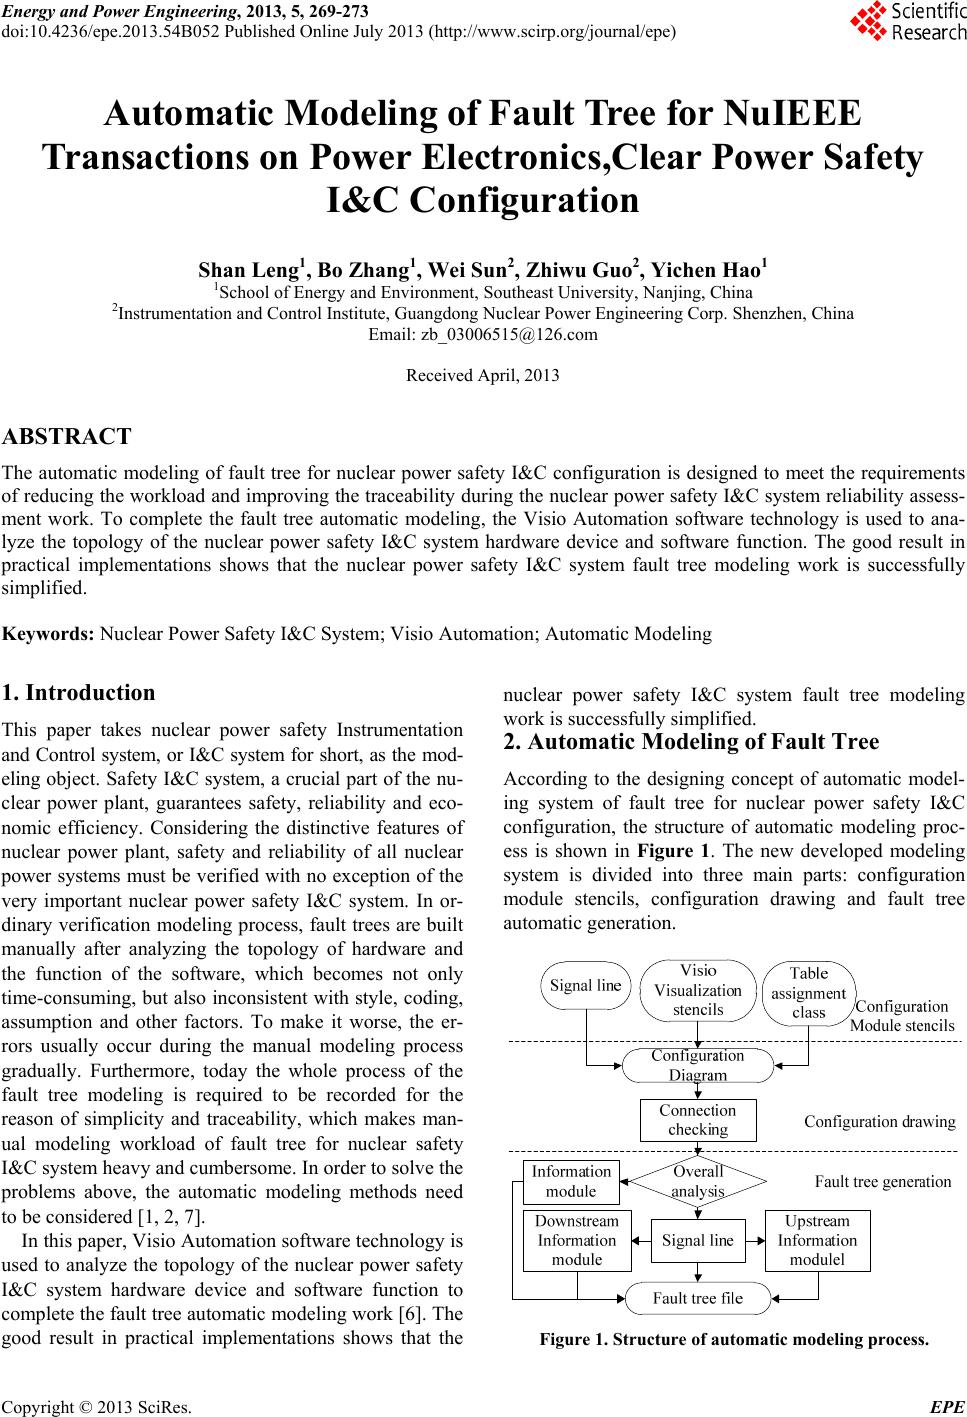
3.2. Channel Groups Configuration
The nuclear power safety I&C system has a lot of chan-
nels, the structur e of the channels are b asically the same.
Each channel is divided into A, B groups, the structure of
the two groups is identical. Th e intermediate portion of a
channel group A configuration diagram is shown in Fig-
ure 5. The signals of group A and B converges in PPNJ
cards. This channel groups configuration is very common
with the I&C configuration system.
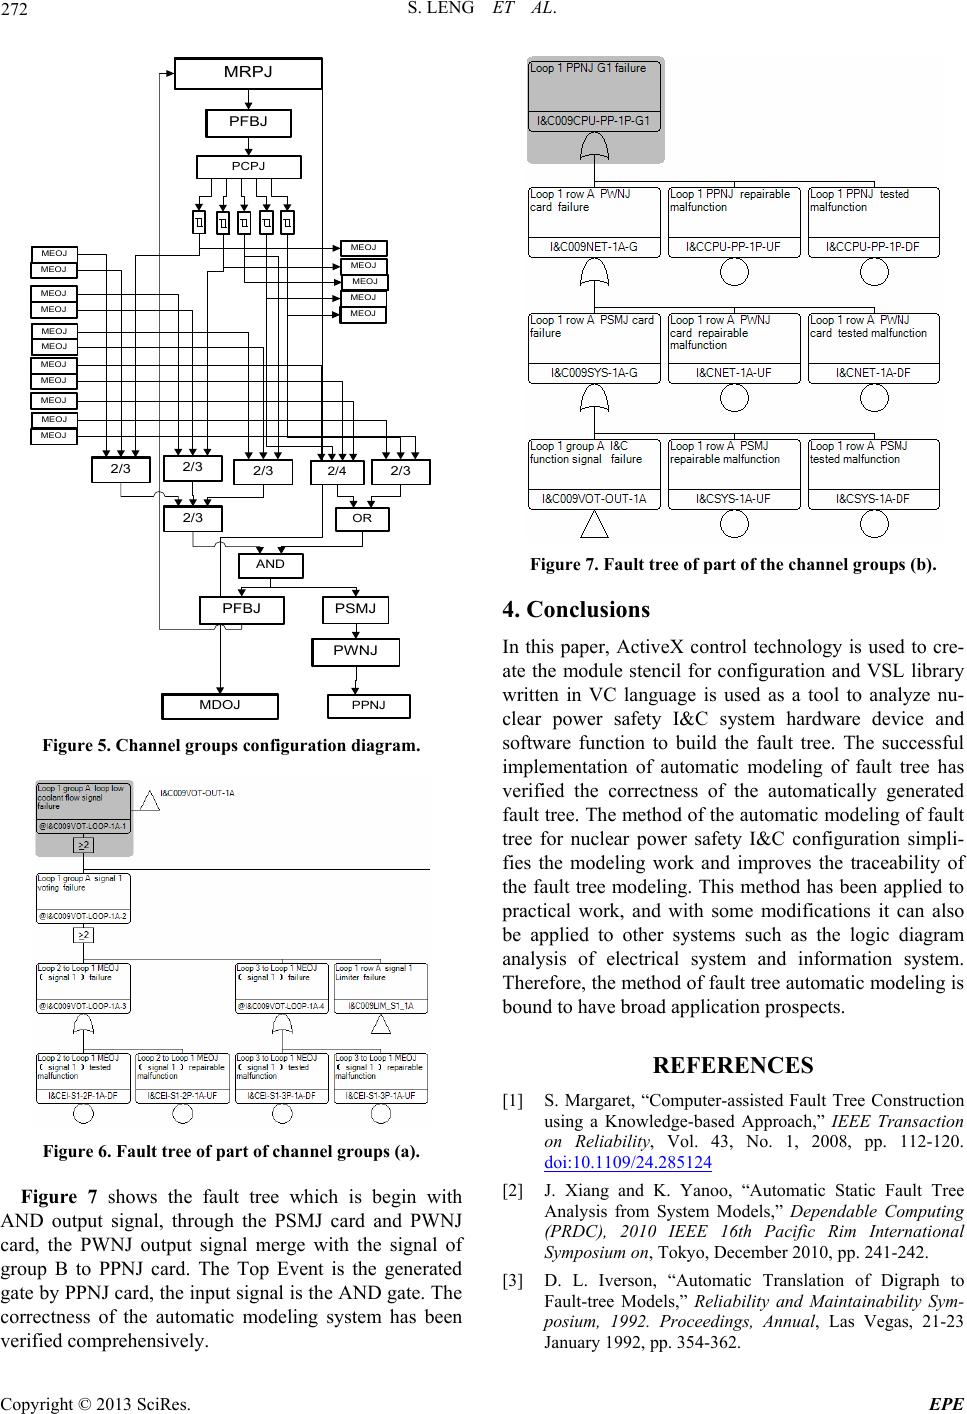
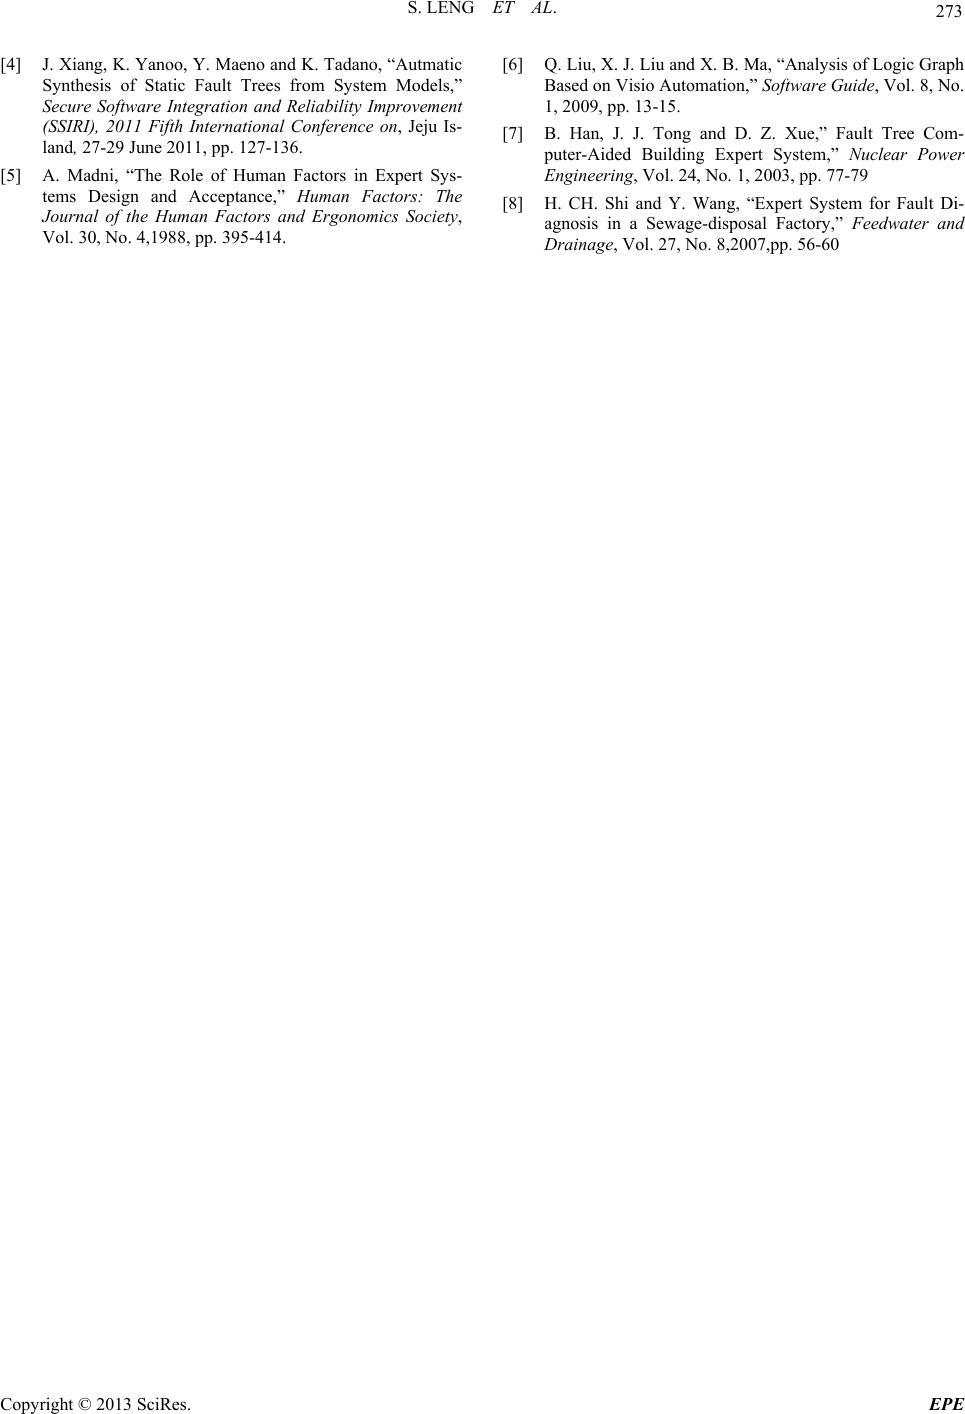
The fault tree is generated after analyze the channel
groups configuration diagram. Because the overall fault
tree is too large, only part of the fault tree is shown in
Figure 6, this part is begin with the group A Limiter
cards and MEOJ cards ,through the set of K/N logic gates
the signal transmitted to the AND gate.
LT
LT
LT
KLPJ
KLPJ
KLPJ
2/3
Figure 3. Measurement signals configuration diagram.
Figure 4. Fault tree of measurement signals.
Copyright © 2013 SciRes. EPE