Energy and Power Engineering, 2013, 5, 189-193
doi:10.4236/epe.2013.54B036 Published Online July 2013 (http://www.scirp.org/journal/epe)
Discussion of a Failure Hot-Spot Endurance Testing Case
for CIGS Thin-Film Photovoltaic Module
Azen Y. Liu, S. L. Lai, Jimmy Yeh
Photovoltaic and Lighting Laboratory, Taiwan Electric Research and Testing Center, Taoyuan, Chinese Taipei
Email: azenliu@ms.tertec.org.tw, lai@ms.tertec.org.tw, jim@ms.tertec.org.tw
Received January, 2013
ABSTRACT
This paper describes the use of steady-state solar simulator for CIGS thin-film photovoltaic module hot-spot endurance
test. In the study, not only are test procedures of hot-spot endurance test in IEC 61646 discussed, but also how to evalu-
ate the performance of steady-state solar simulator by IEC 60904-9 is presented. Three CIGS thin-film PV modules
with the same types are used for hot-spot endurance test in case study. It is found that some of the cell damages and
visual defects on tested PV modules are clearly observed.
Keywords: Hot-spot; Solar Simulator; CIGS; PV Module
1. Introduction
Photovoltaic (PV) module is mainly constructed by the
series/parallel solar cell combinations. In normal light
irradiation, when a serial branch of solar cell is shaded,
the shaded solar cell may considered to be an open circuit
which may required to withstand a large amount of reverse
bias that is sum of remaining solar cells. For a long time
use, such shaded solar cell may need to consume a high
thermal energy, which may thus cause the cell damage to
the shaded solar cell. The phenomenon is so-called PV
module “hot-spot” effect. When design a PV module,
bypass diodes are often used to prevent hot-spot effect.
Otherwise to increase the strength of the material used in
PV module is also a way to eliminate the thermal
destruction caused by hot-spot effect. However, the
discussions of hot-spot endurance problems in CIGS PV
module are not often seen in past efforts [1]. This paper
will therefore present a study of using steady-state solar
simulator for CIGS PV modules hot-spot endurance test.
Some of the failure tests will be discussed in case studies.
2. Standard of Hot-Spot Endurance Test
Hot-spot endurance test for thin-film PV modules is spe-
cified in section 10.9 of IEC 61646 standard [2]. Dif-
ferent cell constructions of PV modules (series, parallel
or series-parallel-series) may provide with different hot-
spot endurance test procedures. This paper will focus on
the discussion of PV modules with series combination
cells. The relevant test procedures are summarized as
below:
2.1. To Find the Worst-case Shading Condition
To set the irradiance of solar simulator to 800 to 1000
W/m2 and to expose the PV module on this irradiance
until thermal stabilization is reached. Measure the I-V
characteristic of unshaded module, and obtain the maxi-
mum power current (Imp) and maximum power (Pmax1).
The black heat-resistant tape (BT) that is cut into a small
piece (similarly width and length of one cell) is used to
cover the PV module; meanwhile, short-circuit current
(Isc) is measured. Move the BT cover parallel to the cells
and gradually increase the shaded module area (number
of shaded cells) until the Isc falls within the range of Imp,
as shown in Figure 1, the worst-case shading condition
is thus found.
Figure 1. An example of worst-case shading condition of
thin-film PV module with series combination cells.
Copyright © 2013 SciRes. EPE
A. Y. LIU ET AL.
190
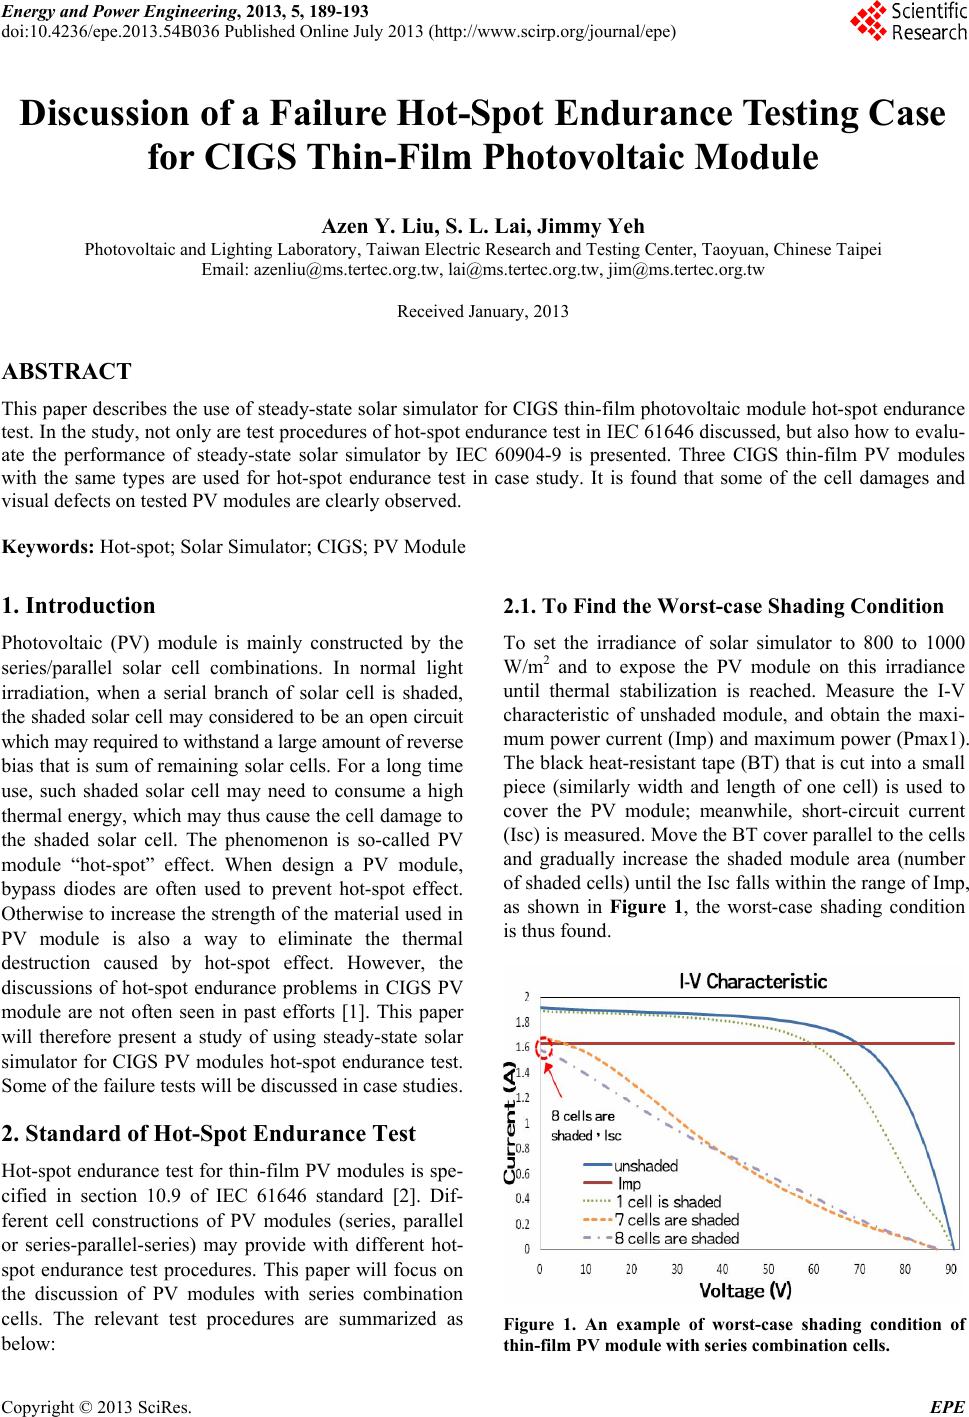
2.2. To Decide the Worst-case Shading Position
Cut the BT into the same size which is found on the
worst-case shading condition. Slowly moves this BT
cover from the bottom to the top of PV module (one cell
distance of each movement) and monitor the Isc of PV
module. To find the module position that possesses the
minimum Isc among the PV entire module, as shown in
Figure 2. Then reduce/add the size of BT cover in small
increments until Isc falls within the range of 0.99 Imp < Isc
< Imp. The final width and position of BT cover deter-
mines the minimum shading area that results in the
worst-case shading condition. This is thus the shaded
area to be used for hot-spot endurance test.
2.3. Other Test Procedure and Test Duration
Place the BT cover on the candidate PV module area and
short-circuit the PV module. Again, expose the PV mod-
ule to an irradiance to 800 to 1000 W/m2 for 1 hour and
control the temperature of PV module to 50 ± 10.
Meanwhile, monitor the value of Isc and keep the PV
module in the condition of maximum power dissipation.
An appropriate temperature detector is necessary used to
determine the hottest area on the shaded cells. Finally,
the visual inspection and insulation test are then used to
judge if the PV module pass/fail in hot-spot endurance
test.
3. Steady-State Solar Simulator
Solar simulator, which simulates the real solar irradiance
and spectrum, is often used to provide a controllable in-
door test field under laboratory condition and can be ei-
ther used for performance measurements of PV cells/
modules or endurance irradiance tests. In general, solar
simulator can be divided into three categories: steady-
state, flash and pulse. The steady-state solar simulator,
possessing a light source form where illumination is
continuous in time, is most often used for low intensity
testing from less than 1 sun up to several suns. The flash
solar simulator, with typical durations of several
milliseconds, includes very high intensities possibly up
to several thousand suns. This type of simulator is often
used to prevent unnecessary heat built up in the device
under test (DUT). The pulse solar simulator, with typical
durations of a few tens milliseconds to several hundred
milliseconds, uses a shutter to quickly control the
illumination of the light from a continuous source. The
advantage of the pulse type simulator consists in the neg-
ligible heat influence to the DUT, which allows DUT to
remain uniformity at ambient temperature and the meas-
uring to be easily and accurately done [3]. In Figure 3,
some experiments are implemented by steady-state solar
simulator (SSSS) in case study, the used SSSS is con-
sisted of 9 xenon lamps, xenon lamp power supply units,
4-wire I-V measuring system, reference cell, thermome-
ter, module mounting plane, etc.
As shown in Table 1, current standard IEC 60904-9
describes three aspects, spectral match, non-uniformity
irradiance and temporal instability of irradiance, to eva-
luate the performance requirement of solar simulator [4].
In general, a solar simulator with class B or better is re-
quired for PV cells/ modules performance testing. Fol-
lowing is the evaluation of SSSS used in the study:
3.1. Spectral Match
The spectral match is presented as the worst difference
between the measured simulator spectral irradiance and
referenced AM 1.5 G spectral irradiance as presented in
IEC 60904-3, respectively, which cover six specified
wavelength intervals between 400 nm and 1100 nm [5].
Figure 4 shows the measured SSSS spectral irradiance
by high-speed spectroradiometer, and the deviations from
AM 1.5 G are calculated in Table 2. It is found the spec-
tral match to all wavelength intervals is among 0.930 to
1.068, which is classified as A by using SSSS.
3.2. Non-Uniformity of Irradiance
The irradiance non-uniformity on the test plane of a
large-area solar simulator for PV cells/modules meas-
urements depends on reflection condition inside the test
apparatus. Base on IEC 60904-9 the designated test area
is divided into at least 64 equally sized test blocks, and
then taken turn to detect the irradiance on each block. In
the study, the test plane is divided into 100 equally sized
test blocks. In Figure 5, the Isc of reference cell is re-
corded to present the irradiance distribution measured on
this test plane. The maximum Isc in test plane is 128.2
mA and the minimum is 124.3 mA. By substitute maxi-
mum and minimum Isc in (1), the non-uniformity of ir-
radiance of 1.54% for used SSSS (classification = A) is
derived.
Figure 2. The procedure of searching worst-case shading position.
Copyright © 2013 SciRes. EPE
A. Y. LIU ET AL. 191
Figure 3. Steady-state solar simulator testing system.
Table 1. Definition of solar simulator classifications.
Temporal instability
Classifications Spectral match to all intervals
specified in IEC 60904-9 Table 1
Non-uniformity of
irradiance Short term instability of
irradiance (STI)
Long term instability of
irradiance (LTI)
A 0.75 - 1.25 2% 0.5% 2%
B 0.6 - 1.4 5% 2% 5%
C 0.4 - 2.0 10% 10% 10%
1000W/m^2
0
0.5
1
1.5
2
2.5
3
3.5
20030040050060070080090010001100 12001300 140015001600
Wavel engt h(nm)
Spectral irradiance(W/m2/nm
)
Simulator
AM1.5G
Figure 4. Measure d spe ctral irradiance of SSSS.
Table 2. Spectral irradiance of lpss and Am 1.5g.
Wavelength range
(nm)
Simulator Irradiance
(1) AM 1.5G (2)(1)/(2)
400-500 20.20 18.4 1.068
500-600 20.80 19.9 1.008
600-700 18.32 18.4 0.965
700-800 14.50 14.9 0.966
800-900 12.43 12.5 1.066
900-1100 13.77 15.9
0.930
Figure 5. Measured irradiance distribution in the test plane (current, A).
Copyright © 2013 SciRes. EPE
A. Y. LIU ET AL.
192
Non-uniformity(%)
max min100%
max min
irradiance irradiance




(1)
3.3. Temporal of Instability of Irradiance
Temporal Instability is the third performance parameter
for SSSS evaluation. It requires the output light to be
stable over time in order to ensure that the lamp fluctua-
tions do not affect the measurement of solar cell effi-
ciency. In general, both short-term instability (STI) and
long-term instability (LTI) should be evaluated. For
SSSS evaluation where the data acquisition system is
integrated into the simulator itself which can simultane-
ously store three separate data (irradiance, voltage and
current), the temporal instability is thus classified as A
for STI. Figure 6 shows instability responses for SSSS, a
sample rate of 6 second and elapsed time 2 hours is util-
ized to calculate LTI. It is found the maximum irradiance
of 1000.82 W/m2 and the minimum irradiance of 998.89
W/m2 is measured within these time durations. LTI of
0.096% is thus calculated that less than a maximum al-
lowable level of 0.5% classified as A is obtained.
4. Case Study
Three CIGS thin-film PV modules with the same speci-
fication are used for hot-spot endurance test in this paper.
Following is the discussion about the trial phenomena
observed on hot-spot endurance test which is performed
on laboratory test environment.
After one hour exposure of hot-spot endurance test,
the corrosion caused on the cell surface of sample 1
module. is obviously found, as show in Figures 7 and 8.
However based on the IEC 61646 standard the cell dam-
age caused by reverse bias in the hot-spot endurance test
was not considered a void or corrosion of the thin-film
layers. Which means if there is no problem in following
visual inspection and insulation test, sample 1 module is
still considered to pass the hot-spot endurance test. The
value of measured insulation resistance for sample 1 is
211 M which is not less than the limitation.
Figure 7. Corrosion effect caused on sample 1 modu (near le
central cell of module).
Figure 8. Corrosion effect caused on sample 1 moduear le (n
module frame.
Figure 9. Broken rear side cover glass of sample 2 module.
It is found that the corrosion phenomenon that oc-
curred on the cells (which is shaded with BT cover) of
sample 2 module after one hour exposure as well, as
shown in Figure 9. The thermal image, which is captured
by IR camera, of sample 2 module can be shown in Fig-
ure 10. A significant heat is concentrated in the position
where BT is covered on sample 2 module. The position is
near with module frame and junction box. For a long
time exposure, the cover glass on the rear side of sample
2 module is broken.
Figure 6. Output light variation of used SSSS.
Copyright © 2013 SciRes. EPE
A. Y. LIU ET AL. 193
Figure 10. Thermal image captured form sample 2 module.
Figure 11. Broken rear side cover glass of sample 3
module.
Figure 12. Thermal image captured form sample 3 module. [5] IEC 60904-3, “Photovoltaic Devices - Part 3: Measure-
ment Principles for Terrestrial Photovoltaic (PV) Solar
Devices with Reference Spectral Irradiance Data,” 2008.
The similar results are presented on sample 3 mod-
ule, but the broken cover glass on the rear side of this
sample is found close to junction box, as shown in Fig-
ures 11 and 12. Sample 2 and 3 module cause the insula-
tion failure due to the broken of module cover glass. The
measured insulation resistance of sample 2 and 3 are
11.45 M and 8.62 M, respectively, which are less
than the limitation of such module type.
5. Conclusions
Carry out of hot-spot endurance test for thin-film PV
module by steady-state solar simulator is presented in
this paper. The performance evaluation of used steady-
state solar simulator based on the procedures described in
IEC 60904-9 standard is presented as well. Three CIGS
thin-film PV modules are used in case study for the dis-
cussion of PV modules face hot-spot effect. It is found
the destruction of cover glass is the most common seen
problem in testing samples. The insufficient stress
strength of rear side cover glass of testing modules is
considered as the main reason in this study.
REFERENCES
[1] A. J. Breeze, “Next Generation Thin-film Solar Cells,”
IEEE Conference on Reliability Physics Symposium
(IRPS), 2008, pp. 168-171.
[2] IEC 61646, “Thin-film Terrestrial Photovoltaic (PV)
Modules – Design Qualification and Type Approval,”
2008.
[3] M. Shimotomai, Y. Shinohara and S. Igari, “The Devel-
opment of the I-V Measurement by Pulsed Multi-flash,
and the Effectiveness,” IEEE Conference Photovoltaic
Energy Conversion (WCPEC), Vol. 2, 2006, pp.
2223-2226.
[4] IEC 60904-9, “Photovoltaic Devices - Part 9: Solar simu-
lator Performance Requirements,” 2007.
Copyright © 2013 SciRes. EPE