Energy and Power Engineering, 2013, 5, 83-88
doi:10.4236/epe.2013.54B016 Published Online July 2013 (http://www.scirp.org/journal/epe)
Generic Reliability Evaluation Method for Industrial
Grids with Variable Frequency Drives
Rongrong Yu1, Yao Chen1, Jiuping Pan2, Richard W Vesel3
1Power Systems, ABB Corporate Research Beijing, China
2Power Technologies, ABB Corporate Research, Raleigh, USA
3EBoP Energy Efficiency, ABB Power Generation, Wickliffe, USA
Email: rongrong.yu@cn.abb.com, cathy-yao.chen@cn.abb.com, jiuping.pan@us.abb.com, richard.w.vesel@us.abb.com
Received January, 2013
ABSTRACT
The paper presents a reliability evaluation method based on fault tree analysis with set theory and minimal cut set as
core algorithm, which can be used to evaluate the reliability for industrial grids with wide application of variable fre-
quency drives. The working principle is introduced firstly, based on which the method development considering differ-
ent system topology designs, backup solutions and redundancy mechanisms are analyzed in details. In the end the pro-
posed method is applied to two cases to show the reliability performance of system with variable frequency drives. The
proposed method is also suitable for analyzing the reliability performance of industrial grids with other types of power
electronic converter technology.
Keywords: Fault Tree Analysis; Minimal Cut Set; Reliability; Industrial Grids; Variable Frequency Drives
1. Introduction
One of the most essential elements contributing to qual-
ity of industrial grids is design of its electrification
scheme. Nowadays in order to increase system efficiency
and reduce energy consumption losses, power electronic
devices like Variable Frequency Drives (VFD) are wide-
ly applied in both power generation and distribution grids.
With introduction of power electronic devices, reliability
of the original system topology may be influenced.
However, conventional reliability evaluation method as
in [1] is designed without considering VFD. As a result,
it’s worthwhile finding a generic approach to evaluate
the reliability of industrial grids with VFDs or other
types of power electronic converter technology to ap-
praise VFD impact and propose improvement solution.
Most commonly used reliability study methods for
power system include Reliability Block Diagram (RBD)
[2], Markov chain [3], Monte Carlo simulation [4] and
Fault Tree Analysis (FTA) [5]. Considering the feature of
industrial grids, for example, multi-input and mul-
ti-output, large quantity of components, known electrifi-
cation scheme, desiring to identify key component(s)
with biggest impact on the entire system reliability, as
well as for the purpose of reflecting reliability trend after
introducing VFDs, FTA is chosen in this paper to de-
velop a generic evaluation algorithm. Minimal cut set is
embedded as basic failure event identification way in
FTA. In the following parts of the paper, firstly, generic
working principle of using FTA to evaluate reliability for
industrial plants is introduced; Secondly, detailed calcu-
lation procedures with minimum cut set and set theory
considering different system topology designs, backup
solutions and redundancy mechanisms are analyzed in
details; thirdly, the proposed method is demonstrated
respectively with two case studies.
2. Principle Analysis of FTA
2.1. Working Principle
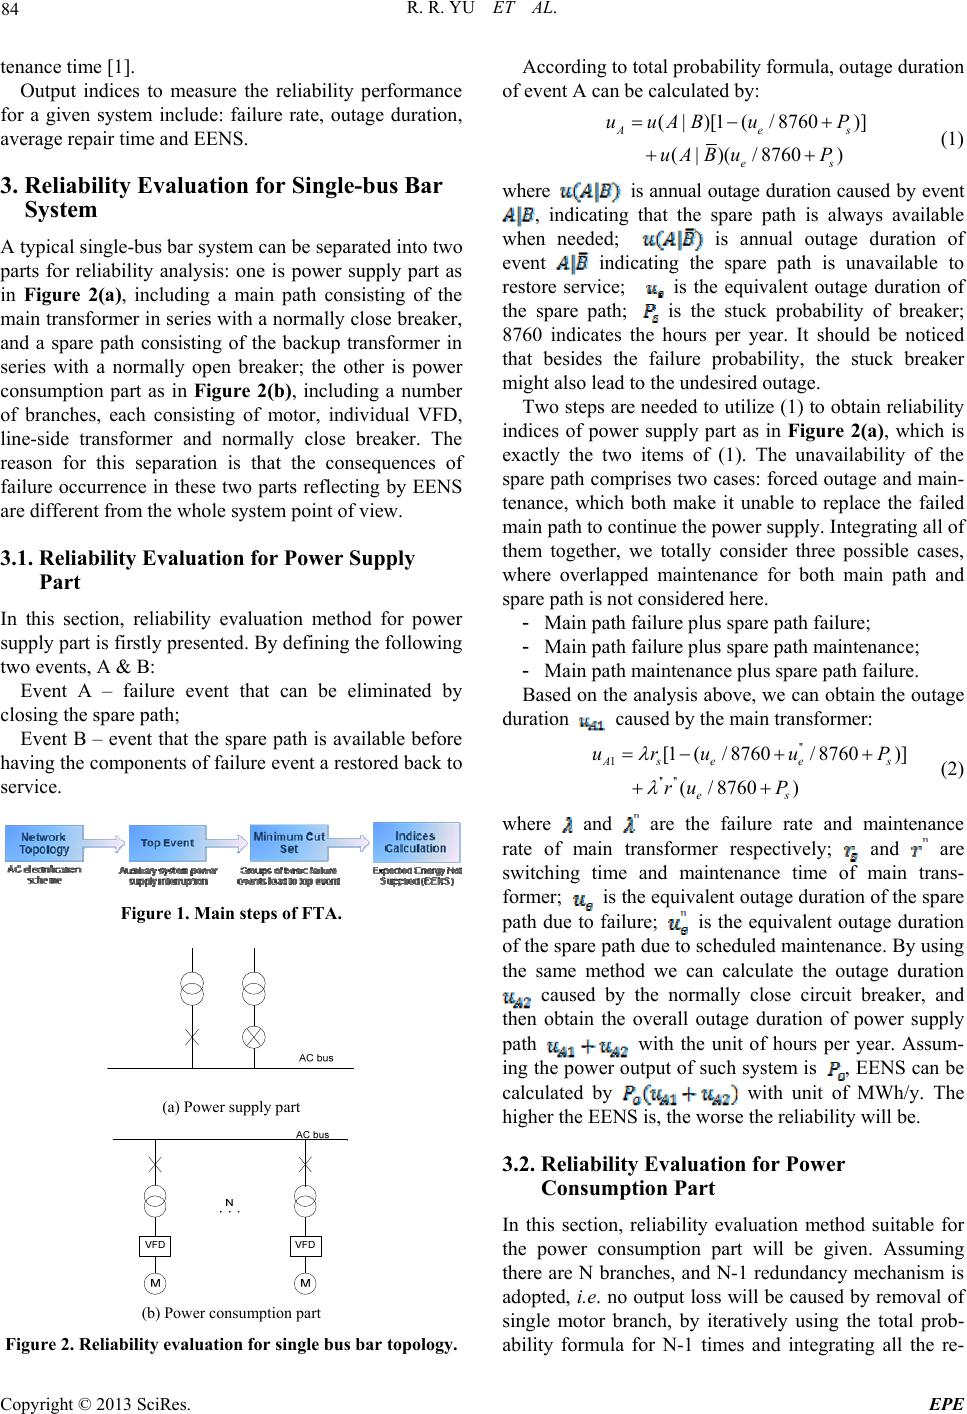
The main steps of FTA are described in Figure 1, start-
ing from network topology definition, e.g. single-bus or
dual- bus power circuit topology; to top event identifica-
tion, which usually refers to system power supply inter-
ruption; to minimum cut set categorization, to come out
with groups of basic failure events that will lead to the
top event; and finally to reliability indices calculation.
The final indicator will be Expected Energy Not Sup-
plied (EENS), i.e. the undesired energy losses due to
reliability issues.
2.2. Input and Output Indices
According to the basic theory of FTA, following com-
ponent reliability data is required as input information to
quantify the reliability indices for each failure event:
total failure rate, active failure rate, repair time, switch-
ing time, stuck probability, maintenance rate and main-
Copyright © 2013 SciRes. EPE
R. R. YU ET AL.
84
tenance time [1].
Output indices to measure the reliability performance
for a given system include: failure rate, outage duration,
average repair time and EENS.
3. Reliability Evaluation for Single-bus Bar
System
A typical single-bus bar system can be separated into two
parts for reliability analysis: one is power supply part as
in Figure 2(a), including a main path consisting of the
main transformer in series with a normally close breaker,
and a spare path consisting of the backup transformer in
series with a normally open breaker; the other is power
consumption part as in Figure 2(b), including a number
of branches, each consisting of motor, individual VFD,
line-side transformer and normally close breaker. The
reason for this separation is that the consequences of
failure occurrence in these two parts reflecting by EENS
are different from the whole system point of view.
3.1. Reliability Evaluation for Power Supply
Part
In this section, reliability evaluation method for power
supply part is firstly presented. By defining the following
two events, A & B:
Event A – failure event that can be eliminated by
closing the spare path;
Event B – event that the spare path is available before
having the components of failure event a restored back to
service.
Figure 1. Main steps of FTA.
(a) Power supply part
(b) Power consumption part
Figure 2. Reliability evaluation for single bus bar topology.
According to total probability formula, outage duration
of event A can be calculated by:
(|)[1(/ 8760)]
(|)(/8760)
Ae
es
uuAB uP
uABuP
s


(1)
where is annual outage duration caused by event
, indicating that the spare path is always available
when needed; is annual outage duration of
event indicating the spare path is unavailable to
restore service; is the equivalent outage duration of
the spare path; is the stuck probability of breaker;
8760 indicates the hours per year. It should be noticed
that besides the failure probability, the stuck breaker
might also lead to the undesired outage.
Two steps are needed to utilize (1) to obtain reliability
indices of power supply part as in Figure 2(a), which is
exactly the two items of (1). The unavailability of the
spare path comprises two cases: forced outage and main-
tenance, which both make it unable to replace the failed
main path to continue the power supply. Integrating all of
them together, we totally consider three possible cases,
where overlapped maintenance for both main path and
spare path is not considered here.
- Main path failure plus spare path failure;
- Main path failure plus spare path maintenance;
- Main path maintenance plus spare path failure.
Based on the analysis above, we can obtain the outage
duration caused by the main transformer:
''
1
'' ''
[1(/ 8760/ 8760)]
(/8760)
As ees
es
uruuP
ru P

 (2)
where and are the failure rate and maintenance
rate of main transformer respectively; and are
switching time and maintenance time of main trans-
former; is the equivalent outage duration of the spare
path due to failure; is the equivalent outage duration
of the spare path due to scheduled maintenance. By using
the same method we can calculate the outage duration
caused by the normally close circuit breaker, and
then obtain the overall outage duration of power supply
path with the unit of hours per year. Assum-
ing the power output of such system is , EENS can be
calculated by with unit of MWh/y. The
higher the EENS is, the worse the reliability will be.
3.2. Reliability Evaluation for Power
Consumption Part
In this section, reliability evaluation method suitable for
the power consumption part will be given. Assuming
there are N branches, and N-1 redundancy mechanism is
adopted, i.e. no output loss will be caused by removal of
single motor branch, by iteratively using the total prob-
ability formula for N-1 times and integrating all the re-
Copyright © 2013 SciRes. EPE
R. R. YU ET AL. 85
sults together, the final EENS caused by the power con-
sumption part can be obtained (Detailed calculation pro-
cedures are ignored here).
11
0
1
1
** *()**(1)
1
Ni
i
EENSPuN ipp
N

(3)
where u and p refer to the outage duration and the outage
probability for each motor branch.
4. Reliability Evaluation for Dual-bus Bar
System
A typical dual-bus bar system is shown in Figure 3,
which can also be separated into two parts for reliability
analysis: one is power supply part including two bus bars
as in Figure 3(a), each supplied by a transformer in se-
ries with a normally close circuit breaker, and with a
normally open circuit breaker in between; the other is
power consumption part including a number of branches
as in Figure 3(b), each consisting of motor, VFDs, line-
side transformer and normally close (or normally open)
circuit breaker.
4.1. Reliability Evaluation for Power Supply
Part
In this section, reliability evaluation method for power
supply part is firstly presented. Different with single bus
bar topology, Set Theory should be introduced to evalu-
ate the reliability of dual (or multiple buses) system. As-
sume event A is outage of bus bar 1 and event B is out-
age of the bus bar 2. As shown in Figure 4, the crossing
section of set A and set B represents the occurrence of
overlapping outage.
(a) Power supply part
(b) Power consumption part
Figure 3. Reliability evaluation for dual bus bar topology.
Figure 4. Set theory based busbar loss.
Based on the set definition and the total probability
formula introduced above, outage duration of busbars
can be obtained using equation below:
()()()
( |)()(| )()(| )()
busbar
uuABuBAuAB
uABPBuB APAuABPB


(4)
where, is the duration of bus bar 1 outage while
bus bar 2 in service; is the duration of bus bar 2
outage while bus bar 1 in service, if
both bus bars are symmetrical; is the duration of
bus bar 1 and 2 both fail. and are the nor-
mal operation probability of bus bar 1 and 2;
if both bus bars are symmetrical.
The EENS of dual-bus system power supply part can
be therefore calculated:
()() ()()
()()
busbar LL
L
EENSPAB uABPBA uBA
PABuAB

(5)
where, is the power loss in case of failure event
, namely one bus bar outage while the other bus bar in
service, if both bus bars are sym-
metrical; is the system overall power loss.
4.2. Reliability Evaluation for Power
Consumption Part
In this section, reliability evaluation method suitable for
the power consumption part will be given. Assuming
there are totally N motor branches connected to bus bar 1
and 2; and N+2 redundancy mechanism is adopted, i.e.
two standby branches (regardless of in the same or sepa-
rate bus bars) can be switched in to maintain the output
in case of the failure or maintenance event of any branch
in operation, the outage duration caused by the power
consumption part can be calculated as follows:
11 1
2
(1 )*
(1)[(2)2*]
N
motor N
Nii Ni
N
i
uCPPu
CPPiu u


(6)
where, P is probability of each motor branch outage
(considering both failure and maintenance); u is outage
duration of each motor branch without standby branch;
u* is outage duration of each motor branch with standby
branch. Assume is the rated power of the motor
branch, the EENS of power consumption part can be
calculated by .
Copyright © 2013 SciRes. EPE
R. R. YU ET AL.
86
5. Case Studies
5.1. Power Plant Auxiliary System
Figure 5(a) shows a simplified Single Line Diagram
(SLD) of a solar thermal power plant auxiliary system [6],
with both main path and spare path for the power supply
part, and totally 13 motor branches with VFDs for the
power consumption part. The motor branches can be
further categorized into three groups as indicated in the
figure. The three groups of motors respectively take re-
sponsibility for driving pumps with three types of func-
tionality:
6 x heat transfer fluid pumps to pump the oil from
the cold pipes through solar field to the hot pipes.
4 x cold tank pumps to pump the cold molten salt
from the cold tank through salt-HTF heat exchanger to
the hot tank, to store extra solar energy during daytime.
3 x hot tank pumps to pump the hot molten salt
from the hot tank through salt-HTF heat exchanger to the
cold tank, to discharge energy for power generation after
sunset.
For each group, N-1 redundancy mechanism is
adopted.
(a) Simplified SLD of power plant auxiliary system
(b) Fault tree of power plant auxiliary system
Figure 5. Reliability case study for power plant auxiliary
system..
By defining the generation reduction as the top failure
event, the fault tree of the given system can be drawn as
shown in Figure 5(b). The analysis is commenced by
calculating reliability indices of each load point in the
electrical auxiliary system, e.g. load point 3 (bus bar) that
will lead to complete loss of generation, and load point 9
(auxiliary motor) that will lead to partial loss of genera-
tion.
Assuming the power generation capacity is 50 MW,
the overall reliability indices for the single bus auxiliary
system can be calculated as shown in Table 1. It can be
observed that, the EENS with regard to the complete
generation loss is mainly caused by power supply part,
which is 33.67 MWh per year; the EENS with regard to
the partial generation loss caused by the motor branches
is 4.14 MWh per year. Totally, for the 50MW power
plant, EENS caused by VFD based auxiliary system is
37.81 MWh/y. It can also be seen from Table 1 that gen-
eration loss caused by VFD is about 5.33 h/y (for each
motor branch), corresponding to 3.15 WMh/y (13 motor
branches), which accounts for over 8% of the overall
EENS. One possible measure to further improve reliabil-
ity is to utilize dual-bus topology which will be exempli-
fied in the next section.
5.2. Water Pumping Station
Figure 6(a) shows a simplified SLD of a water pumping
station, with two bus bars in the power supply part, and
totally 8 motor branches with VFDs for the power con-
sumption part. N+2 redundancy mechanism is adopted,
with two standby motor branches connected to the bus
bars via normally open circuit breakers.
By defining the shortage of pumped water to be the
top event, the fault tree of the given system can be drawn
as shown in Figure 6(b), consisting of two groups of
failure events: motor branch loss, and bus bar loss.
Table 1. Reliability indices for single bus power plant aux-
iliary system.
Forced outages overlapping maintenance
Failure event
λ/y u (h/y) r (h)
1* 0.52 0.43 0.83
2* 0.26 0.09 0.33
3 0.01 0.05 10.00
4 0.01 0.01
1.00
5(4) 0.00 0.00
1.00
Complete loss
6(4) 0.00 0.00
1.00
Total (complete loss) 0.89 0.67 0.76
EENScomplete (MWh/y) 33.67
4 0.26 5.24 20.00
5 0.25 1.01 3.98 Partial loss
6 1.08 4.32 4.00
EENSpartial (MWh/y) 4.14
EENS (MWh/y) 37.81
Note: Bold data means it should be multiplied with 13 (number of motors)
before summing.
Copyright © 2013 SciRes. EPE
R. R. YU ET AL.
Copyright © 2013 SciRes. EPE
87
Using the Set Theory, the basic events leading to the
bus bar failure can be specified. Assuming the power
capacity of each motor is 4.095 MW, the overall reliabil-
ity indices for the dual bus water pumping station can be
calculated as shown in Table 2. The overall energy loss
in this case is 9.97 MWh/y, the majority of which comes
from losses on bus bars. Losses caused by VFD are only
0.002 MWh/y (accounting for only 0.02% of the overall
EENS), which demonstrates the superiority of dual bus
design and N+2 redundancy mechanism. Compare sin-
gle-bus system with dual-bus one, it can be seen that du-
al-bus system has better reliability than single-bus one.
This is because dual busbar topology design can dra-
matically decrease the probability of the total plant loss.
(a) Simplified SLD of water pumping station (b) Fault tree of water pumping station
Figure 1. Reliability case study for water pumping station.
Table 2. Reliability indices for dual bus water pumping station.
Busbar 3 Busbar 11 Busbar 3 & 11
Failure event u (h/y) Failure eventu (h/y) Failure event ubackup fail. (h/y) uback maint. (h/y)
1* 0.38 9* 0.38 1 28.02 8.02
2* 0.08 10* 0.08 2 5.25 0.25
Busbar loss
(power supply loss)
3 0.05 11 0.05 3 0.05 0.05
4 0.01 12 0.01 4 0.008 0.01
5(4) 0.00 13(4) 0.00 5(4) 0.00 0.00
Busbar loss
(motor path active failure loss)
6(4) 0.00 14(4) 0.00 6(4) 0.00 0.00
Bus outage duration (h/y) 0.52 0.52 0.06
EENSbusbar (MWh/y) 4.31 4.31 1.36
4 5.24 4* 0.07
5 1.01 5* 0.00 Motor loss
6 4.32 6* 0.00
Motor outage duration (h/y) 0.00
EENSmot o r (MWh/y) 0.00
EENS (MWh/y) 9.97
R. R. YU ET AL.
88
6. Conclusions
In this paper, a generic reliability evaluation method for
industry grid with VFD applications has been developed
based on fault tree analysis method together with mini-
mal cut set and set theory. Different topology design and
redundancy mechanism have been considered in the al-
gorithm design. Reliability of both single-bus and dual-
bus electrification schemes have been evaluated using the
proposed method. Demonstrated by the two case studies,
the proposed approach can not only quantify the reliabil-
ity of a given system, but also differentiate the undesired
outage caused by individual component, which is impor-
tant to identify the weak point of the system for reliabil-
ity improvement. Furthermore, it is also suitable for ana-
lyzing the reliability of industrial grids with multiple bus
bars, or with other types of power electronic converter
technology.
REFERENCES
[1] R. N. Allan, R. Billinton and M. F. Deoliveire, “Reliabil-
ity Evaluation of the Auxiliary Electrical Systems of
Power Stations,” IEEE Transactions on Power Apparatus
and Systems, Vol. 5, 1977, pp.1441-1449.
doi:10.1109/T-PAS.1977.32472
[2] P. Zhou, H. G. Mou, Y. Liu and L. Zhang, “Reliability
Evaluation for Electromechanical Fuze Based on Series
Model and Parallel Model,” Journal of Detection & Con-
trol, Vo. 31, No. 6, 2009, pp. 51-54.
[3] R. Billinton, H. Chen and J. Zhou, “Generalized n+2
State System Markov Model for Station-Oriented Reli-
ability Evaluation,” IEEE Transactions on Power Systems,
Vol. 12, No. 4, 1997, pp. 1511-1517.
doi:10.1109/59.627850
[4] Y. Ou and L. Goel, “Using Monte Carlo Simulation for
Overall Distribution System Reliability Worth Assess-
ment,” IEE Proceedings: Generation, Transmission and
Distribution, Vol. 146, No. 5, 1999, pp. 535-540.
doi:10.1049/ip-gtd:19990542
[5] R. S. Chanda and P. K. Bhattacharjee, “A Reliability
Approach to Transmission Expansion Planning Using
Fuzzy Fault-Tree Model,” Electric Power Systems Re-
search, Vol. 45, No. 2, 1998, pp. 101-108.
doi:10.1016/S0378-7796(97)01226-1
[6] http://spectrum.ieee.org/energy/environment/largest-solar
-thermal-storage-plant-to-start-up
Copyright © 2013 SciRes. EPE