Paper Menu >>
Journal Menu >>
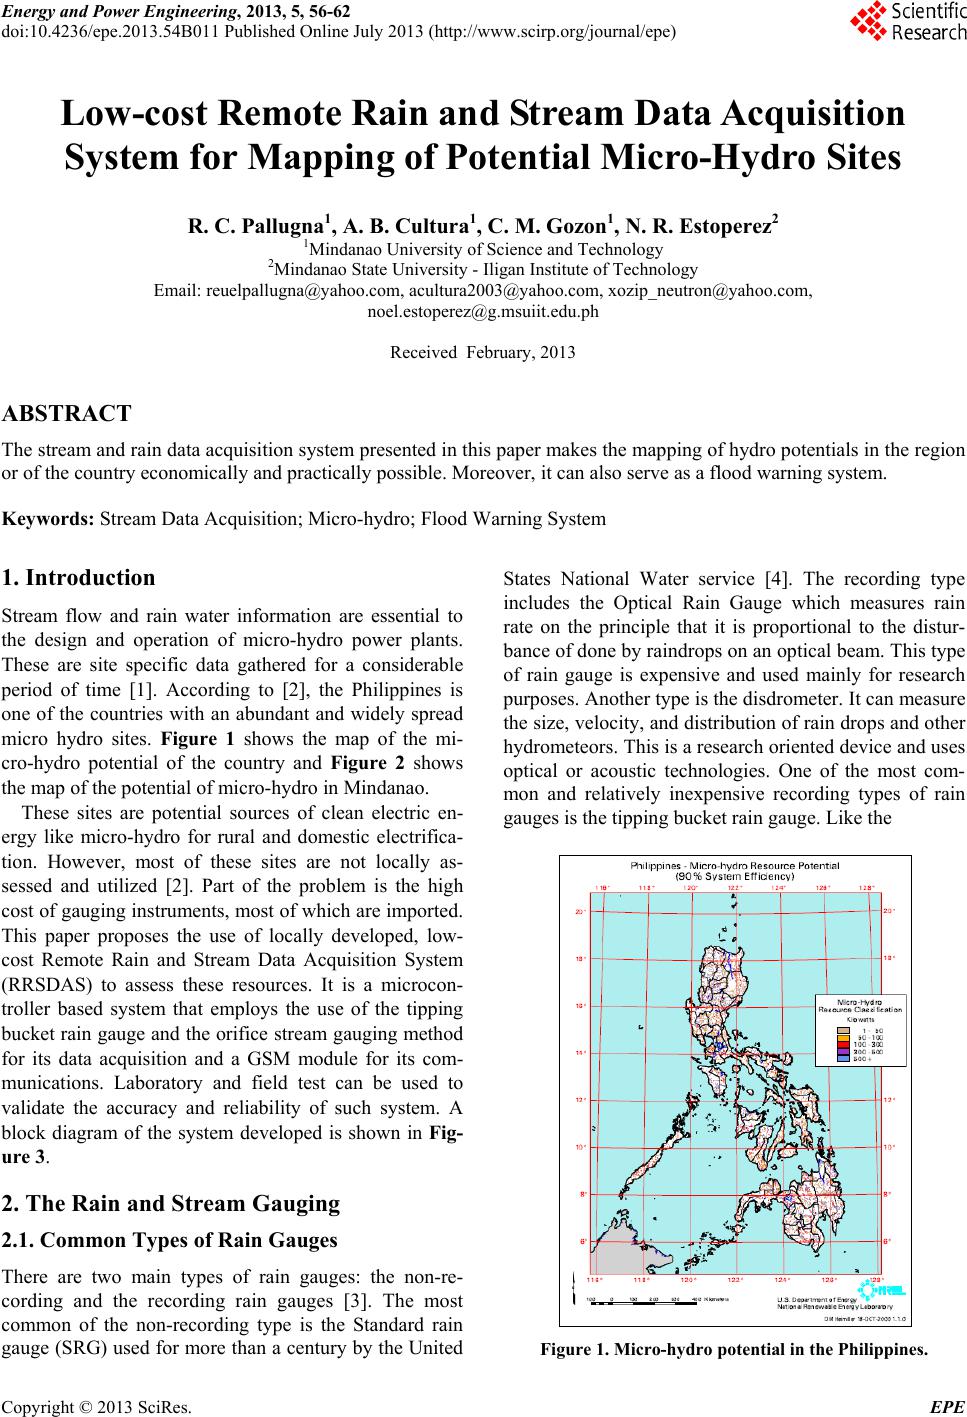 Energy and Power Engineering, 2013, 5, 56-62 doi:10.4236/epe.2013.54B011 Published Online July 2013 (http://www.scirp.org/journal/epe) Low-cost Remote Rain and Stream Data Acquisition System for Mapping of Potential Micro-Hydro Sites R. C. Pallugna1, A. B. Cultura1, C. M. Gozon1, N. R. Estoperez2 1Mindanao University of Science and Technology 2Mindanao State University - Iligan Institute of Technology Email: reuelpallugna@yahoo.com, acultura2003@yahoo.com, xozip_neutron@yahoo.com, noel.estoperez@g.msuiit.edu.ph Received February, 2013 ABSTRACT The stream and rain data acquisition system presented in this paper makes the mapping of hydro potentials in the region or of the country econo micall y and practically possible. Moreover, it can also serve as a flood warning system. Keywords: Stream Data Acquisition; Micro-hydro; Flood Warning System 1. Introduction Stream flow and rain water information are essential to the design and operation of micro-hydro power plants. These are site specific data gathered for a considerable period of time [1]. According to [2], the Philippines is one of the countries with an abundant and widely spread micro hydro sites. Figure 1 shows the map of the mi- cro-hydro potential of the country and Figure 2 shows the map of the potential of micro-hydro in Mindanao. These sites are potential sources of clean electric en- ergy like micro-hydro for rural and domestic electrifica- tion. However, most of these sites are not locally as- sessed and utilized [2]. Part of the problem is the high cost of gauging instruments, most of which are imported. This paper proposes the use of locally developed, low- cost Remote Rain and Stream Data Acquisition System (RRSDAS) to assess these resources. It is a microcon- troller based system that employs the use of the tipping bucket rain gauge and the orifice stream gauging method for its data acquisition and a GSM module for its com- munications. Laboratory and field test can be used to validate the accuracy and reliability of such system. A block diagram of the system developed is shown in Fig- ure 3. 2. The Rain and Stream Gauging 2.1. Common Types of Rain Gauges There are two main types of rain gauges: the non-re- cording and the recording rain gauges [3]. The most common of the non-recording type is the Standard rain gauge (SRG) used for more than a century by the United States National Water service [4]. The recording type includes the Optical Rain Gauge which measures rain rate on the principle that it is proportional to the distur- bance of done by raindrops on an optical beam. This type of rain gauge is expensive and used mainly for research purposes. Another type is the disdrometer. It can measure the size, velocity, and distribution of rain drops and other hydrometeors. This is a research oriented device and uses optical or acoustic technologies. One of the most com- mon and relatively inexpensive recording types of rain gauges is the tipping buck et rain gauge. Like the Figure 1. Micro-hydro potential in the Philippines. Copyright © 2013 SciRes. EPE 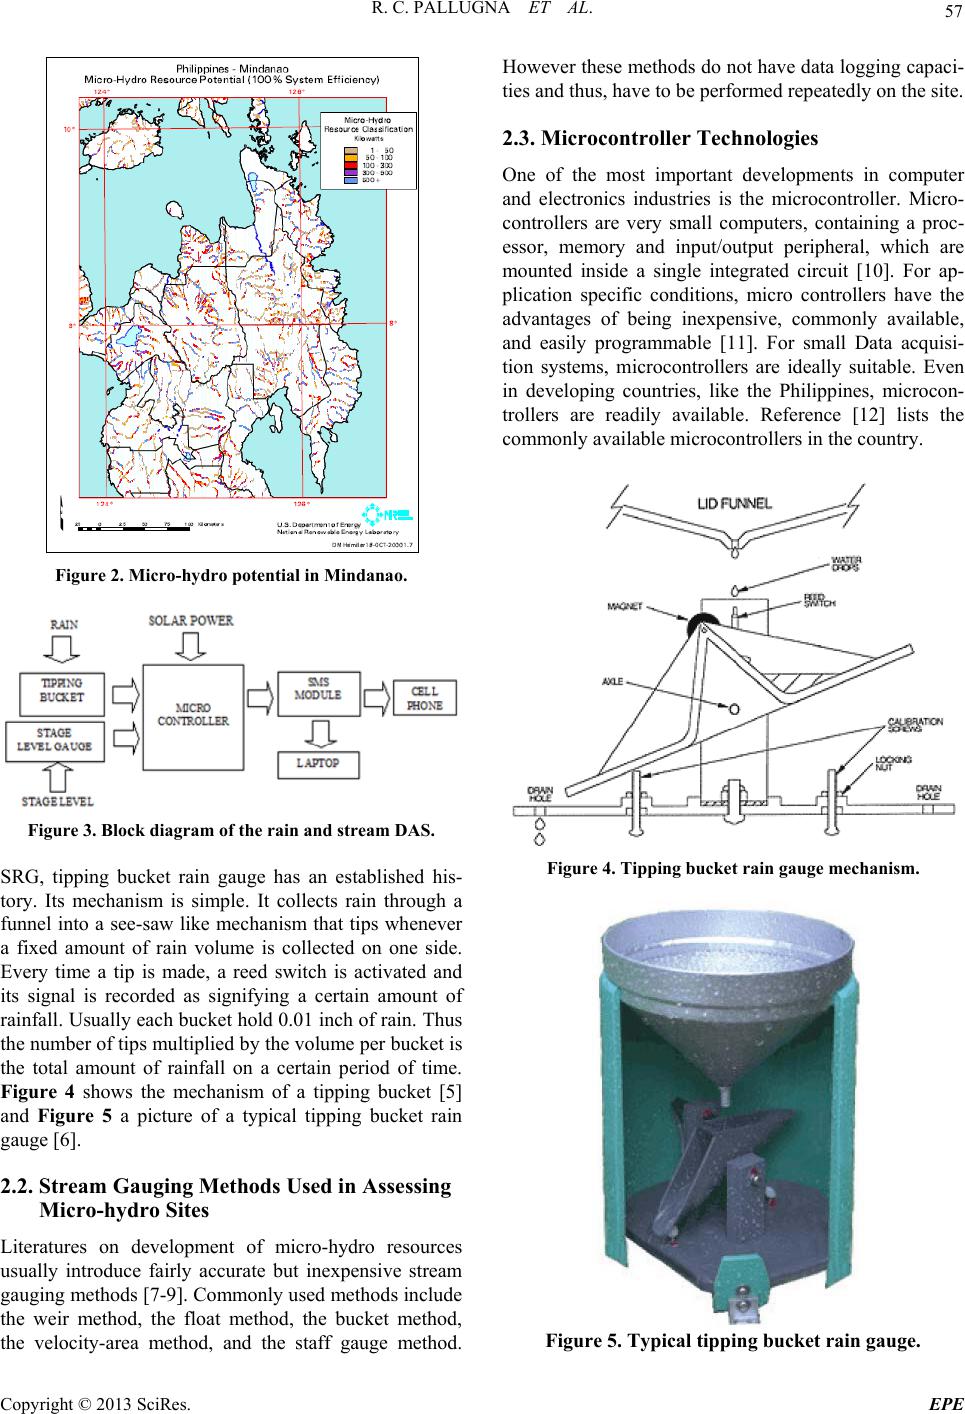 R. C. PALLUGNA ET AL. 57 Figure 2. Micro-hydro potential in Mindanao. Figure 3. Block diagram of the rain and stream DAS. SRG, tipping bucket rain gauge has an established his- tory. Its mechanism is simple. It collects rain through a funnel into a see-saw like mechanism that tips whenever a fixed amount of rain volume is collected on one side. Every time a tip is made, a reed switch is activated and its signal is recorded as signifying a certain amount of rainfall. Usually each bucket hold 0.01 inch of rain. Thus the number of tips multiplied b y the volume per bu cket is the total amount of rainfall on a certain period of time. Figure 4 shows the mechanism of a tipping bucket [5] and Figure 5 a picture of a typical tipping bucket rain gauge [6]. 2.2. Stream Gauging Methods Used in Assessing Micro-hydro Sites Literatures on development of micro-hydro resources usually introduce fairly accurate but inexpensive stream gauging methods [7-9]. Co mmonly used methods include the weir method, the float method, the bucket method, the velocity-area method, and the staff gauge method. However these methods do not have data logging capaci- ties and thus, have to be performed repeatedly on the site. 2.3. Microcontroller Technologies One of the most important developments in computer and electronics industries is the microcontroller. Micro- controllers are very small computers, containing a proc- essor, memory and input/output peripheral, which are mounted inside a single integrated circuit [10]. For ap- plication specific conditions, micro controllers have the advantages of being inexpensive, commonly available, and easily programmable [11]. For small Data acquisi- tion systems, microcontrollers are ideally suitable. Even in developing countries, like the Philippines, microcon- trollers are readily available. Reference [12] lists the commonly available microcontrollers in th e coun try. Figure 4. Tipping bucket rain gauge mechanism. Figure 5. Typical tipping bucket rain gauge. Copyright © 2013 SciRes. EPE 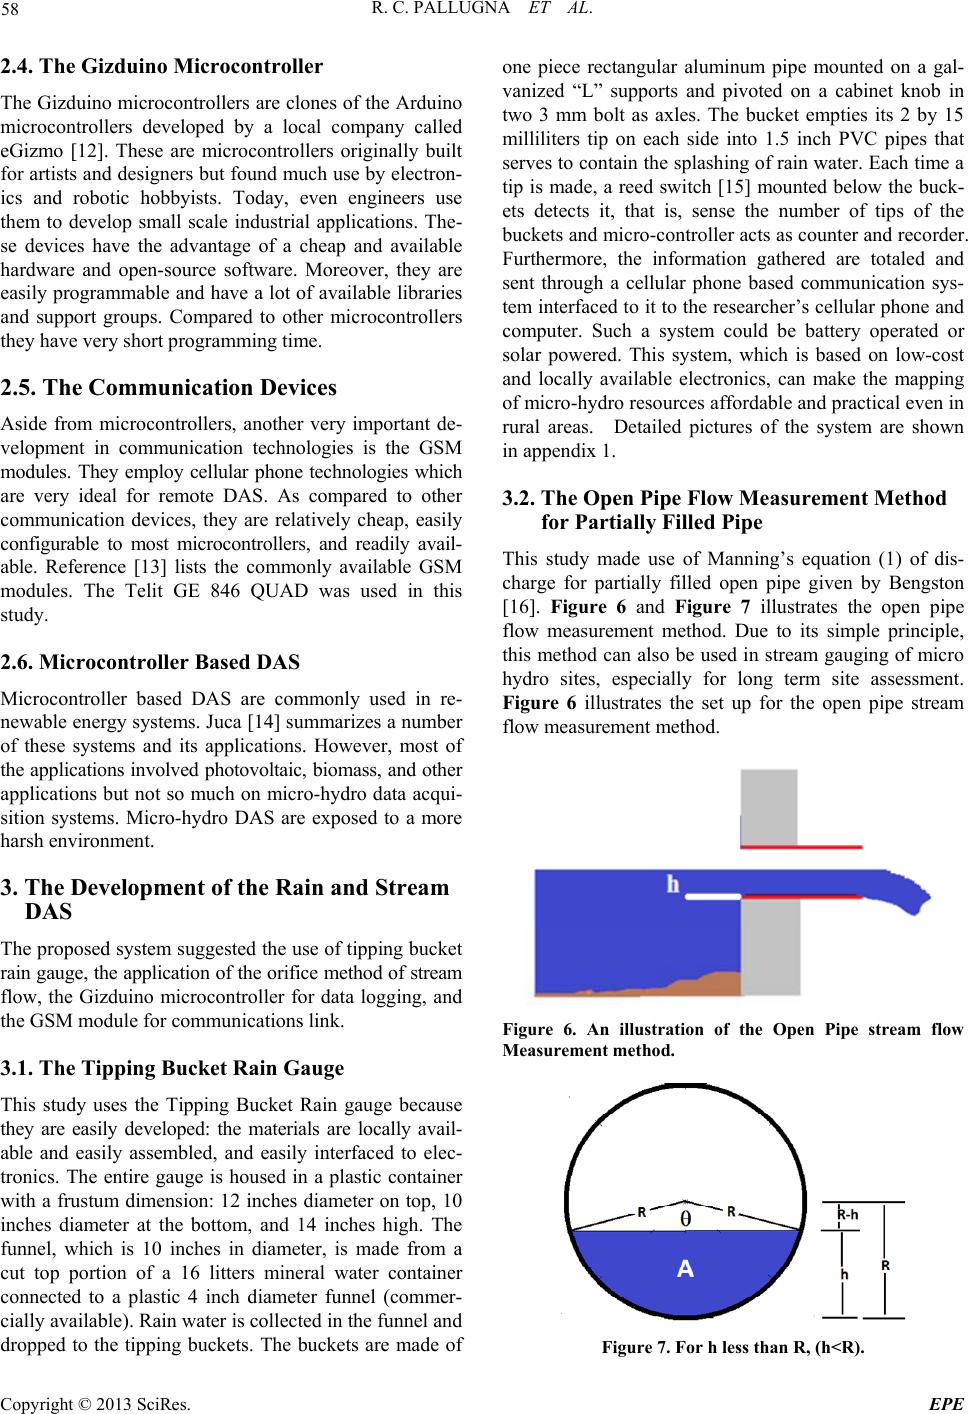 R. C. PALLUGNA ET AL. 58 2.4. The Gizduino Microcontroller The Gizduino microcontrollers are clones of the Arduino microcontrollers developed by a local company called eGizmo [12]. These are microcontrollers originally built for artists and designers but found much use by electron- ics and robotic hobbyists. Today, even engineers use them to develop small scale industrial applications. The- se devices have the advantage of a cheap and available hardware and open-source software. Moreover, they are easily programmable and have a lot of available libraries and support groups. Compared to other microcontrollers they have very short pr o gramming time . 2.5. The Communication Devices Aside from microcontrollers, another very important de- velopment in communication technologies is the GSM modules. They employ cellular phone technologies which are very ideal for remote DAS. As compared to other communication devices, they are relatively cheap, easily configurable to most microcontrollers, and readily avail- able. Reference [13] lists the commonly available GSM modules. The Telit GE 846 QUAD was used in this study. 2.6. Microcontroller Based DAS Microcontroller based DAS are commonly used in re- newable energy systems. Juca [14] summarizes a number of these systems and its applications. However, most of the applications involved photovoltaic, biomass, and other applications but not so much on micro-hydro data acqui- sition systems. Micro-hydro DAS are exposed to a more harsh environment. 3. The Development of the Rain and Stream DAS The proposed system suggested the use of tipping bucket rain gauge, the application of the orifice method of stream flow, the Gizduino microcontroller for data logging, and the GSM module for communications link. 3.1. The Tipping Bucket Rain Gauge This study uses the Tipping Bucket Rain gauge because they are easily developed: the materials are locally avail- able and easily assembled, and easily interfaced to elec- tronics. The entire gauge is housed in a plastic container with a frustum dimension: 12 inches diameter on top, 10 inches diameter at the bottom, and 14 inches high. The funnel, which is 10 inches in diameter, is made from a cut top portion of a 16 litters mineral water container connected to a plastic 4 inch diameter funnel (commer- cially available). Rain water is collected in the funnel and dropped to the tipping buckets. The buckets are made of one piece rectangular aluminum pipe mounted on a gal- vanized “L” supports and pivoted on a cabinet knob in two 3 mm bolt as axles. The bucket empties its 2 by 15 milliliters tip on each side into 1.5 inch PVC pipes that serves to contain the sp lashing of rain water. Each time a tip is made, a reed switch [15] mounted below the buck- ets detects it, that is, sense the number of tips of the buckets and micro-controller acts as counter and recorder. Furthermore, the information gathered are totaled and sent through a cellular phone based communication sys- tem interfaced to it to the researcher’s cellular phone and computer. Such a system could be battery operated or solar powered. This system, which is based on low-cost and locally available electronics, can make the mapping of micro-hydro re sources aff ord able and practical even in rural areas. Detailed pictures of the system are shown in appendix 1. 3.2. The Open Pipe Flow Measurement Method for Partially Filled Pipe This study made use of Manning’s equation (1) of dis- charge for partially filled open pipe given by Bengston [16]. Figure 6 and Figure 7 illustrates the open pipe flow measurement method. Due to its simple principle, this method can also be used in stream gauging of micro hydro sites, especially for long term site assessment. Figure 6 illustrates the set up for the open pipe stream flow measurement method. Figure 6. An illustration of the Open Pipe stream flow Measurement method. Figure 7. For h less than R, (h<R). Copyright © 2013 SciRes. EPE 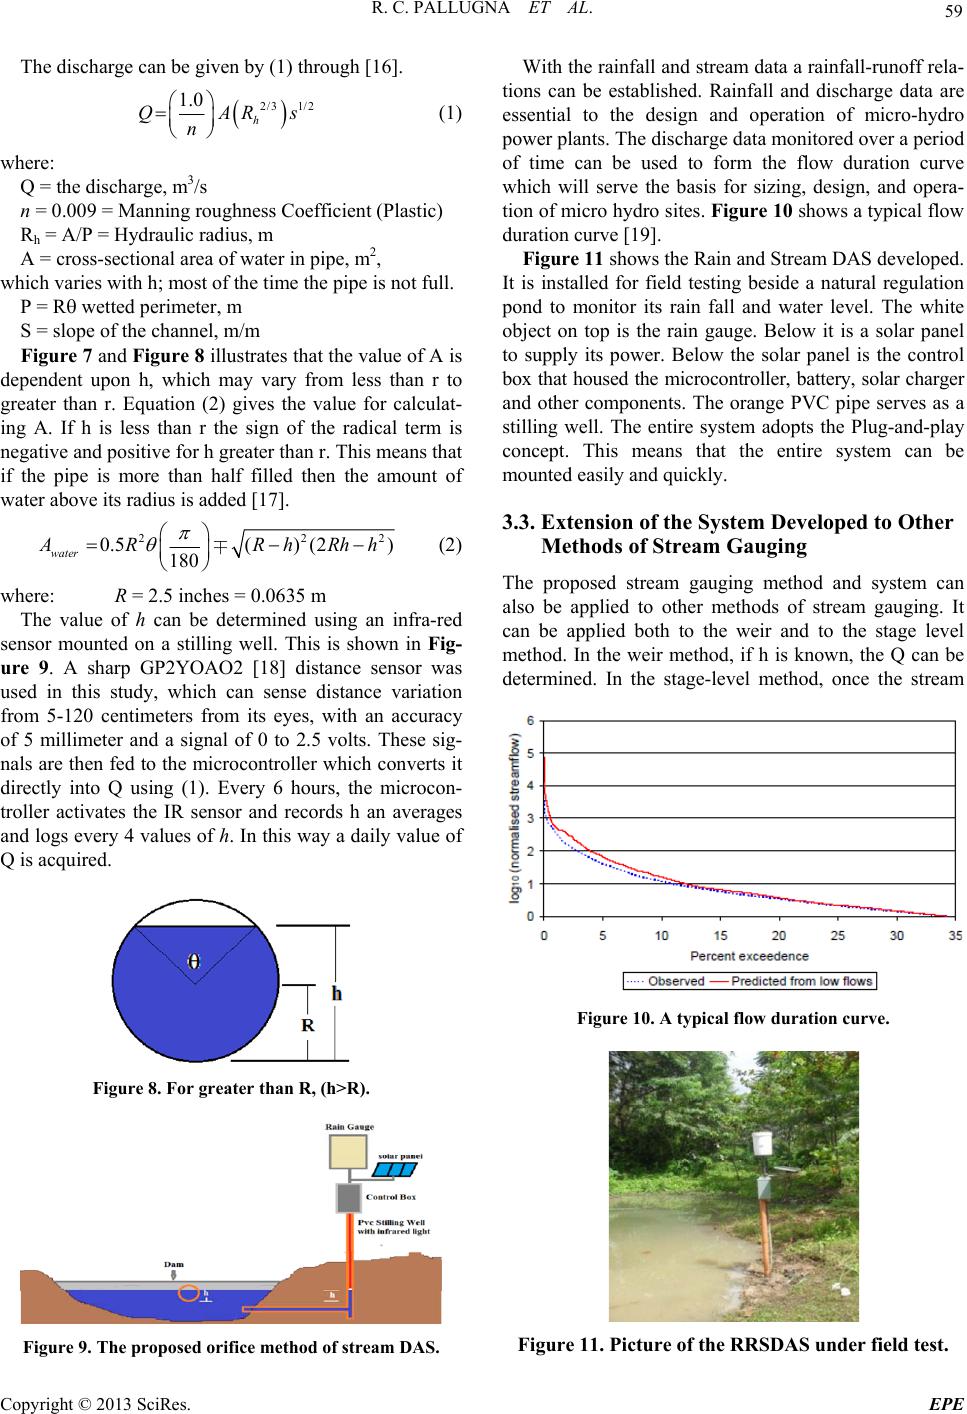 R. C. PALLUGNA ET AL. 59 The dischar ge can be given by (1 ) through [16]. 2/3 1/2 1.0 h QAR n s (1) where: Q = the discharge, m3/s n = 0.009 = Manning roughness Coefficient (Plastic) Rh = A/P = Hydraulic radius, m A = cross-sectional area of water in pipe, m2, which varies with h; most of the time the pipe is not full. P = R wetted perimeter, m S = slope of the channe l, m/m Figure 7 and Figure 8 illustrates that the value of A is dependent upon h, which may vary from less than r to greater than r. Equation (2) gives the value for calculat- ing A. If h is less than r the sign of the radical term is negative and positive for h greater than r. This means that if the pipe is more than half filled then the amount of water above its radius is added [17]. 22 0.5() (2) 180 water 2 A RRhRh h (2) where: R = 2.5 inches = 0.0635 m The value of h can be determined using an infra-red sensor mounted on a stilling well. This is shown in Fig- ure 9. A sharp GP2YOAO2 [18] distance sensor was used in this study, which can sense distance variation from 5-120 centimeters from its eyes, with an accuracy of 5 millimeter and a signal of 0 to 2.5 volts. These sig- nals are then fed to the micro controller which converts it directly into Q using (1). Every 6 hours, the microcon- troller activates the IR sensor and records h an averages and logs every 4 values of h. In this way a daily value of Q is acquired. Figure 8. For greater than R, (h>R). With the rainfall and stream data a rainfall-runoff rela- tions can be established. Rainfall and discharge data are essential to the design and operation of micro-hydro power plants. The discharge data monitored over a period of time can be used to form the flow duration curve which will serve the basis for sizing, design, and opera- tion of micro hydro sites. Figure 10 shows a typical flow duration curve [19]. Figure 11 shows the Rain and Stream DAS developed. It 3.3. Extension of the System Developed to Other The can is installed for field testing beside a natural regulation pond to monitor its rain fall and water level. The white object on top is the rain gauge. Below it is a solar panel to supply its power. Below the solar panel is the control box that housed the microcontroller, battery, solar charger and other components. The orange PVC pipe serves as a stilling well. The entire system adopts the Plug-and-play concept. This means that the entire system can be mounted easily and quickly. Methods of Stream Gauging proposed stream gauging method and system also be applied to other methods of stream gauging. It can be applied both to the weir and to the stage level method. In the weir method, if h is known, the Q can be determined. In the stage-level method, once the stream Figure 10. A typical flow duration curve. Figure 11. Picture of the RRSDAS unde r field test. Figure 9. The proposed orifice method of stream DAS. Copyright © 2013 SciRes. EPE  R. C. PALLUGNA ET AL. 60 ra - 4. Results and Discussion th in a laboratory set up Table 1 shows the re rther processed to ob ting is known and the stag e-discharge relation is estab lished then the discharge can be determined for every value of stag e. The proposed DAS was tested bo and in on of the micro-hydro sites in the region. The re- sults are shown in the next sections, The Rain field test gauge results. sult of the r ain gauge dat a loggi ng. The values of the loggings are fu tain a graphical relation. This is shown in Figure 12. Equations (3) and (4) were used to calculate the rainfall [20]. 3 1000 mm ml ml mm mm NxV x RA (3) 2 4 mm d A (4) where: e amount of daily rain fall inmillimeters m) at the month of Feb- ru Table 1. Rain gauge data logging. Rmm = th N = number of tips per day Vml = volume of rain per tip (ml) 1000 mm3 /ml = conversion factor Amm = area of funnel (mm2) d = diameter of funnel (254 m It can be seen from Figure 12 th ary was a rainy month. Reaching up to the maximum of 9 millimeters of rain. 0.00 1.00 2.00 3.00 4.00 5.00 6.00 7.00 8.00 9.00 10.00 Height(mm) Date AmountofDailyRainful Figure 12. Graphical display of rainfall loggings. 0.06 0 0.06 0 0.05 0 0.06 0 0.05 0 0.06 0 0.05 0 0.05 0 0.06 0 0.06 0 0.06 0 0.06 0 Series1 0.00.00.00.00.00.00.00.00.00.00.00.0 ‐ 0.0010 0.0020 0.0030 0.0040 0.0050 0.0060 Discharge Stage versusDisch argegraph Figure 13. Stage versus discharge curve using the Open pipe Flow me thod. 4.1. The Result of the Stream Gauge Tests The stream gauge was tested in comparison with a veloc- ity-area method using a standard PRICE TYPE AA (Na- kaasa model 8154) current meter and the bucket method. The results are recorded and illustrated in the graphical result in Figures 13, 14, and 15. Results indicated the validity and accuracy of the ori- fice method and system. The average discharge of the three methods is consistent within three decimal values of 0.004 cubic meters per second. Copyright © 2013 SciRes. EPE  R. C. PALLUGNA ET AL. 61 0.06 0 0.06 0 0.05 0 0.06 0 0.05 0 0.06 0 0.05 0 0.05 0 0.06 0 0.06 0 0.06 0 0.06 0 Series1 0.0 0.0 0.00.0 0.0 0.0 0.00.0 0.0 0.0 0.00.0 ‐ 0.0010 0.0020 0.0030 0.0040 0.0050 0.0060 Discharge Stageversu sDisc hargegrap h Figure 13. Stage versus discharge curve using the Open pipe Flow me thod. 0 0.0005 0.001 0.0015 0.002 0.0025 0.003 0.0035 0.004 0.05 0.050.05 0.05 0.050.05 0.05 0.050.05 0.05 0.050.05 StagevsDischar ge Graph Disch arge Figure 14. Stage vs discharge graph using the Velocity method using Current Meter. - Ar- ea 0.00000 0.00100 0.00200 0.00300 0.00400 0.00500 0.00600 0.00700 0.00800 1 23 45 6 78 91011121314151617181920 Disch a rgevs.Trialsgraph Discharge Figure 15. Discharge versus Trials graph using the Bu Method. esented in the graphical re three decimal values d analyzing Rain and stream Data for assessing of micro-hydro sites and ydro p ower plants . flood warning system, turn ing on alarms whenever a certain amount of rainfall or stage The remote rain and data acquisition can also be applied to the weir and sta gauging. ion System for Micro of the Micro Hydro 10 November, 2011 , PTY LTD, Australia k on How to Develop y, Philippines, 2009 th Arduino,” O’Reilly Me- cket [9] DOE, “Manual for Micro-hydropower Development,” Department of Energ 4.2. The Result of the Stream Gauge Tests The stream gauge was tested in comparison with a veloc- ity-area method using a standard PRICE TYPE AA (Na- kaasa model 8154) current meter and the bucket method. The results are recorded and repr sult in Figures 13, 14, and 15. Results indicated the validity and accuracy of the ori- fice method and system. The average discharge of the three methods is consistent within of 0.004 cubic meters per second. 4.3. The Computer Interface A computer interface can be used to generate a graphical display of the results using Microsoft excel. This is a very convenient way of gathering an developi ng micro-h 5. Conclusions Results indicated validity of the low-cost remote rain and stream data acquisition system developed. Moreover, the validity of the orifice method of stream flow was verified. The ability of the DAS to measure the stag e of th e stream could also be used as a level is exceeded. 6. Recommendations ff gauge method of stream REFERENCES [1] D. J. Calubad, et al., “Data Acquisit Hydro Electric Power Plant,” ECE student Forum, De La Salle University, Philippines, 2005 [2] NREL Final Report, “Assessment Resources in the Philippines,” NREL, USA, 2000. [3] Rainfall Measurement at a Point, http://www.ncdc.noaa.gov; Accessed 10 November 2011 [4] Rainfall Measurement at a Point, http://www.ncdc.noaa.gov; Accessed [5] “Schematic of Tipping Bucket,” Weathershack.com Henderson Harbor, New York, USA [6] “Waterlog,” Distributed by Semrad [7] “British Hydropower Association a Guide to UK Mini-hydro Developments,” 2005 [8] C. Penche, “Layman’s Guideboo Small Hydro Site,” European Small Hydro Association (ESHA), Belgica, Brussels, 1998 [10] http://en.wikipedia.org/wiki/Microcontrollers, Accessed 10 November 2011 [11] M. Banzi, “Getting Started wi dia, Inc., Sebastopol, CA, USA, 2008 [12] “Egizmo,” www.egizmo.com [13] “Telit GE846 QUAD,” GSM board, www.gsm-modem.de, Acessed 15 November 2011 [14] S. S. Juca, “Low Cost Concept for Data Acquisition Sys- ensors, An MDPI Journal,www.mdpi.com tems Applied to Decentralized Renewable Energy Plants,” S Copyright © 2013 SciRes. EPE  R. C. PALLUGNA ET AL. Copyright © 2013 SciRes. EPE 62 ull Pipe 1948 8] “Using Sharp IR Sensor for Distance Calculation,” http://luckylarry.co.uk/arduino-projects [15] “Reed and Relay Electronics India,” LTD, reed- sen- sor.com [16] H. H. Bengston, “Spreadsheet Use for Parially F [19] Flow Calculation,” CED Engineering, Stony Point, New York, U.S.A. and Sons, New York, USA, [17] DOE, “Manual for Micro-hydropower Development,” Department of Energy, Philippines,2009 [1 [20] “Weir Metho D. A. Post, “A New Method for Estimating Flow Duration Curves: An Application to the Burdekin River Catchment,” North Queensland, Australia, CSRISO land and water, Davies Laboratory, Townsville, Queensland, Australia. C. Penche, “Layman’s Guidebook on How to Develop Small Hydro Site,” European Small Hydro Asso,(ESHA), Belgica, Brussels, 1998. |