J. Biomedical Science and Engineering, 2011, 4, 76-81
doi:10.4236/jbise.2011.41010 Published Online January 2011 (http://www.SciRP.org/journal/jbise/
JBiSE
).
Published Online January 2011 in SciRes. http://www.scirp.org/journal/JBiSE
Hematocrit level correlates with lungs resistivity in elderly
patients with cardiogenic pulmonary edema
Marina Arad1, Avraham Adunsky1, Sharon Zlochiver2, Ofer Barnea2, Shimon Abboud2
1Department of Geriatric Rehabilitation Sheba Medical Center, Tel-Hashomer, and Sackler Faculty of Medicine, Tel Aviv University,
Tel Aviv, Israel; 2Department of Biomedical Engineering; Tel-Aviv University, Tel Aviv, Israel.
Email: aradm@post.tau.ac.il
Received 17 September 2010; revise 22 September 2010; accepted 26 September 2010.
ABSTRACT
Regular monitoring of pulmonary congestion in car-
diogenic pulmonary edema (CPE) patients is neces-
sary for its adequate management via pharmaceuti-
cal treatment. It is well known that the development
of CPE is accompanied with an increase in hema-
tocrit, plasma protein concentration and colloid os-
motic pressure due to the decrease in the plasma
volume. In the present study the mean left and right
lung resistivity values taken pre- and post treatment
with diuretics using a hybrid bio-impedance electri-
cal impedance tomography system were correlate to
the measured changes in hematocrit level. A marginal
significant correlation was found between the abso-
lute mean lung resistivity and hematocrit levels
(Pearson’s correlation coefficient of R = 0.4, p-value =
0.057). When the change in the mean lung resistivity
of a patient was plotted vs. the change in hematocrit
readout, a significant linear corr elation was found (R =
0.7, p-value = 0.02). These results support the validity
of the resistivity measurements using bio-impedance
system in monitoring changes of pulmonary edema in
CPE patients.
Keywords: Bio-impedance; Parametric EIT; Cardiogenic
Pulmonary Edema; Hematocrit
1. INTRODUCTION
Congestive heart failure and a consequent CPE are a
major health problem in the western world. Cardiogenic
pulmonary edema (CPE) is a pathological condition in
which extravasation of fluid and colloid from the pul-
monary capillaries into the interstitium and alveoli of the
lungs occurs as a result of increased hydrostatic pressure
in these capillaries that exceeds the plasma oncotic
pressure. This happens when the heart’s function is im-
paired (heart failure) in conditions such as pulmonary
venous outflow obstruction, left ventricular failure,
ischemic heart disease, myocardial infarction or left
atrial myxoma tumor, to the effect that blood cannot be
sufficiently pumped in proportion to the tissues’ meta-
bolic demand. As a result, a compensatory increase in
pulmonary venous pressure is developed [1,2].
The development of CPE is accompanied with an in-
crease in hematocrit, plasma protein concentration and
colloid osmotic pressure due to the decrease in the
plasma volume. In a study conducted on 95 CPE patients
and 71 control subjects, a significant difference in he-
matocrit level was found between the two groups (44.3
vs. 42.1% for the CPE and control groups, respectively).
Moreover, a gradual decrease in the hematocrit level was
observed for the CPE group during therapy for those
patients whose condition was improved post-treatment
(from 44.5 0.8 to 41.3 0.8%, n = 65) [3]. Similar
results were observed by the same research group in an
additional study [4]. In that study, the effect of CPE
therapy using furosemide, morphine and oxygen on
various plasma parameters was measured in CPE pa-
tients. A statistically significant decrease in hematocrit
from 42.8 1.9 to 36.7 1.8% was found after an aver-
age of 21.3 hours of treatment (n = 10, p-value < 0.001).
This decrease was in conjunction with a difference be-
tween the urine output and fluid intake of 2.823 0.848l.
Further demonstration for the correlation between the
lungs fluid volume and hematocrit was given in another
study conducted on a group of 10 CPE patients that were
treated with large doses on intravenous furosemide [5].
In that study, hemodilution was detected 2 hours after
the start of treatment, resulting in a significant reduction
of blood viscosity and hematocrit. The hematocrit was
reduced by a mean of 3% and 5.4% at 30 and 120 min-
utes after the start of treatment.
The gradual filling of the lungs with fluids during the
development of CPE results in substantial changes in the
electric impedance of the lungs, as the lung fluids exhibit
higher conductivity in relation to the electrically insulat-
ing air. Since the lungs are the largest in volume organ in
M. Arad et al. / J. Biomedical Science and Engineering 4 (2011) 76-81
Copyright © 2011 SciRes. JBiSE
77
the thoracic volume, such impedance changes are ex-
pected to be large enough to be non-invasively detected
on the body surface via impedance measurement.
Therefore, the bio-impedance technique may be utilized
as an alternative non-invasive CPE monitoring method.
We previously reported on a newly developed hybrid
EIT system (CardioInspect, Tel-Aviv University, Israel)
that combines principles from the bio-impedance and
EIT techniques and enables the reconstruction of the
separate left and right lung resistivity values. The sys-
tem’s performance was studied on both healthy and CHF
patients, and its capability to diagnose and monitor pa-
tients was demonstrated [6-10]. Here we examine the
correlation between the measured left and right lung
resistivity values to the hematocrit level in a group of
CHF patients during diuretics treatment.
2. METHODS
2.1. Clinical Study
A clinical study was conducted in the geriatric depart-
ment in Tel-Hashomer hospital, Ramat-Gan, Israel. The
study included 12 CHF patients (n = 4/8, male/female,
mean age 78 10 years) that were diagnosed and found
having pulmonary edema and were under monitoring
and CPE management. All participants signed an in-
formed consent form, and the study was approved by the
local Helsinki committee. Two bio-impedance meas-
urements were taken. The first measurement was taken
as a reference measurement to determine the lungs’ re-
sistivity value pre-treatment. The second measurement
was taken following treatment with diuretics, morphine
and oxygen. In addition to the bio-impedance measure-
ments, blood samples were taken at the two measuring
times, and hematocrit level was assessed as part of a
complete blood count. All bio-impedance measurements
were taken shortly after the patients were asked to sit
rested to ensure shallow tidal respiration and minimal
body movements that may impair reproducibility of the
results.
2.2. Bio-impedance System
We employed the portable PulmoTrace hybrid bio-im-
pedance measurement system (CardioInspect, Tel-Aviv
University, Tel-Aviv Israel). The system has been previ-
ously studied and described in detail [6-10]. Briefly, the
system comprises of three units (Figure 1): 1) an
8-electrode belt is attached around the patient’s chest at
the plane of the fifth intercostals space in the mid-
clavicular line. The electrodes are Ag/AgCl disposable,
and they are attached at equal angular distance from
each other using 8 adjustable elongation segments on
the belt; 2) an analog unit generates the injection current
(3 mA ptp, 20 kHz) and directs the current through a
Figure 1. PulmoTrace hybrid bio-impedance measurement
system.
demultiplexer to the appropriate pair of electrodes. The
developing voltages at the rest of the electrodes are
measured differentially, amplified, filtered and digitized
for analysis. The current injection is done in the opposite
injection scheme, i.e. a total of 4 injections is performed,
for each 5 voltages are measured with the remaining 6
electrodes, yielding 20 independent measurements; and
3) an interface unit includes a microprocessor that proc-
esses the digitized voltage measurements and solves a
parametric inverse-problem to estimate the left and right
lung resistivity values. The reconstruction algorithm is
based on an iterative, parameterized Newton-Raphson
inverse solver as previously reported [6]. The results are
shown on an LCD screen, and can be printed out. The
system is powered by a rechargeable battery to ensure
electrical safety in the hospital environment. A custom
ECG signal is taken by the system prior to the bio-im-
pedance measurements, in order to synchronize the cur-
rent injections and surface voltage measurements to the
iso-potential phase of the ECG, so that to ensure a simi-
lar heart geometrical configuration between measure-
ments. The entire measurement procedure lasts less than
1 minute and completely painless.
2.3. Statistics
Data were fitted using linear regression, and Pearson’s
correlation coefficient was computed to check the strength
of linear dependence. The significance of correlation was
assessed using a transformation into t-statistics. A p-value
of less than 0.05 was considered statistically significant.
3. RESULTS
Table 1 summarizes the bio-impedance and hematocrit
measurements that were taken for all 12 patients at the
two measuring phases–pre-treatment (reference) and
M. Arad et al. / J. Biomedical Science and Engineering 4 (2011) 76-81
Copyright © 2011 SciRes.
78
JBiSE
Table 1. Bio-medical and hematocrit level measurements.
Patient # Sex Age Reference measurement Post-treatment measurement
Mean lung resistivity
[ cm]
HCT Level
(%) Mean lung resistivity
[ cm] HCT Lev el
(%)
1 F 92 853 38.6 800 39.6
2 M 80 1083 44.9 1231 43.1
3 F 91 824 31 889 33.2
4 F 73 715 33.3 834 36.9
5 M 69 625 38.2 675 36.1
6 F 69 861 29.2 1200 38
7 F 88 1060 35.8 1061 33.2
8 F 77 771 34.5 852 33.6
9 F 83 660 28.3 753 30.5
10 M 84 884 41.5 935 41.5
11 F 81 996 35.1 1089 38.1
12 M 58 871 43.4 859 44.3
post-treatment. A two-sample paired t-test showed that
the mean lung resistivity was significantly different be-
tween the two measurements: 850.3 145.6 vs. 931.5
176.1 cm, pre- and post-treatment, respectively
(p-value = 0.016); on the other hand, the hematocrit lev-
els between the measurements were not significantly
different: 36.2 5.4% vs. 37.3 4.3%, pre- and
post-treatment, respectively (p-value = 0.217). A linear
regression analysis showed marginal significant correla-
tion between the absolute mean lung resistivity and he-
matocrit levels, when all 24 measurements were pooled
together, with a Pearson’s correlation coefficient of R =
0.4 (p-value = 0.057), see Figure 2. However, when the
change in the mean lung resistivity of a patient was
plotted vs. the change in hematocrit readout, a signifi-
cant linear correlation was found as can be seen in Fig-
ure 3 (R = 0.7, p-value = 0.02).
4. DISCUSSION
In this work, we have correlated the bio-impedance
measurements of a group of CPE elderly patients with
the hematocrit level, pre- and post treatment with diuret-
ics in order to study the feasibility of the system in
monitoring CPE management in these patients. The
bio-impedance measurements were performed with a
novel hybrid bio-impedance measurement system (Pul-
moTrace by CardioInspect). Proper management of CPE
includes routine monitoring the patient’s condition and
administration of preload and/or afterload reduction
drugs, most notably loop diuretic agents (such as fu-
rosemide) in order to remove excessive lung fluids via
urine passing. Over dosage of diuretics, however, may
generate negative effects such as hypovolemia that re-
duces cardiac output, as well as hypokalemia due to re-
duced concentration of potassium in the blood circula-
tion. As a consequence, high efficacy of diuretics treat-
ment for managing CPE is tightly linked to a sensitive
and continuous monitoring of the level of lung fluids
[11].
At present, pulmonary edema severity level is moni-
tored either invasively or non-invasively. Invasive meth-
ods, e.g. single or double thermal die dilution and direct
measurement of the capillary wedge pressure, require
catheterization, and are therefore intrusive, may result in
medical complications and can only be employed in
clinical conditions during hospitalization. The thermal
die dilution technique is also subject to errors in condi-
tions such as pulmonary vascular perfusion or unilateral
lung disease, and despite being considered gold-standard
has low accuracy of 20-30% [12]. Non-invasive methods
are comprised of imaging systems, most notably X-ray
radiographs, computerized tomography (CT) and mag-
netic resonance imaging (MRI). While X-ray radio-
graphs are widely practiced, their sensitivity and accu-
racy are inconsistent and subjective [13,14], especially
in cases of coexisting pulmonary diseases [15]. On the
other hand, high resolution imaging achieved by CT or
MRI provides high accuracy in measuring lung fluids of
M. Arad et al. / J. Biomedical Science and Engineering 4 (2011) 76-81
Copyright © 2011 SciRes. JBiSE
79
Figure 2. Correlation between mean lung resistivity value and
hematocrit (n = 24, R = 0.4, p-value = 0.057).
Figure 3. Correlation between mean lung resistivity value
change and hematocrit change (n = 12, R = 0.7, p-value = 0.02).
~3%, but cannot be utilized routinely due to either high
ionizing radiation or the large expenses involved.
The bio-impedance technique has been proposed al-
ready in the late 1960’s for evaluating the lungs fluid
volume. Global measurements of the transthoracic im-
pedance as an indirect marker for lungs fluid level was
performed by Pomeranz et al. (1969, 1970) on a canine
model [16,17]. In a common transthoracic measurement
configuration, low magnitude and frequency electrical
current is injected via a pair of electrodes and the devel-
oping voltage between the thorax extremities is simulta-
neously measured, either by the same pair of electrodes
or by a different pair of electrodes (2 or 4 electrode con-
figuration, respectively). During the last decades, nu-
merous experimental and clinical studies have employed
and improved the global transthoracic impedance meas-
urement for monitoring pulmonary edema, in both ani-
mal and human models [18-21]. The technique was also
commercialized, e.g. the BioZ system (CardioDynamics,
San Diego, CA) that extracts thoracic fluid content and
additional hemodynamic and cardiac parameters [22].
Despite the attractiveness of the transthoracic bio-im-
pedance technique for monitoring lungs fluid volume, a
major disadvantage is that the technique provides only a
global mark of average thoracic impedance, and the rela-
tive contributions of the various thoracic organs or even
the separate lung lobes to the measured value cannot be
assessed. A tomographic variation of the bio-impedance
technique for pulmonary function evaluation was first
presented in the mid 1980’s, with the development of the
electrical impedance tomography (EIT) systems [23-25].
These systems can provide a tomographic image of the
electrical impedance spatial distribution in a 2D slice of
the thorax, or even in a 3D volume. EIT is based on se-
quential injection of current via different pairs of elec-
trodes that are located along the thoracic perimeter, and
measurement of the surface voltages with the rest of the
electrodes. The data provided for the various directions
of injections enable utilization of reconstruction algo-
rithms (linear or non-linear) that solve the so-called “in-
verse-problem” of EIT, i.e. the estimation of the internal
distribution of impedance that is most probable to result
in the set of measured voltages. Various custom-built
EIT systems were studied in both animal and human
models [26-28]; however, this method seems to suffer
from low resolution reconstructions, uneven spatial sen-
sitivity to conductivity perturbations, artifacts arising
from numerical reconstruction errors and extremely low
signal to noise errors [29]. Most of these limitations are
inherent to EIT, due to the mathematical ill-posedeness
of the inverse-problem that is solved. The hybrid system
that was employed here overcomes the major limitation
of EIT systems by employing the inverse problem algo-
rithm to reconstruct only two parameters–the left and the
right lung resistivity values. As a result, the reconstruc-
tion problem becomes well-posed, and the optimization
algorithm is robust, with minimized sensitivity to meas-
urement noises, either geometrical or electrical [6].
In our previous studies we have shown that the system
reproducibility on healthy subjects is <2%, for both
within and between tests, with measured signal-to-noise
ratio of ~75dB [6]. We also demonstrated that the system
doesn’t show dependency on various anthropometric
parameters (e.g. body-mass index, age, height and
weight). In other studies we found good diagnostic
separation capability between healthy subjects and CHF
patients, and long-term monitoring of CPE management
was validated by tracing the measurements during pa-
tient treatment and comparing the bio-impedance meas-
urements to various indirect measures for pulmonary
M. Arad et al. / J. Biomedical Science and Engineering 4 (2011) 76-81
Copyright © 2011 SciRes. JBiSE
80
congestion e.g. urine output [8] and X-ray diagnosis [9].
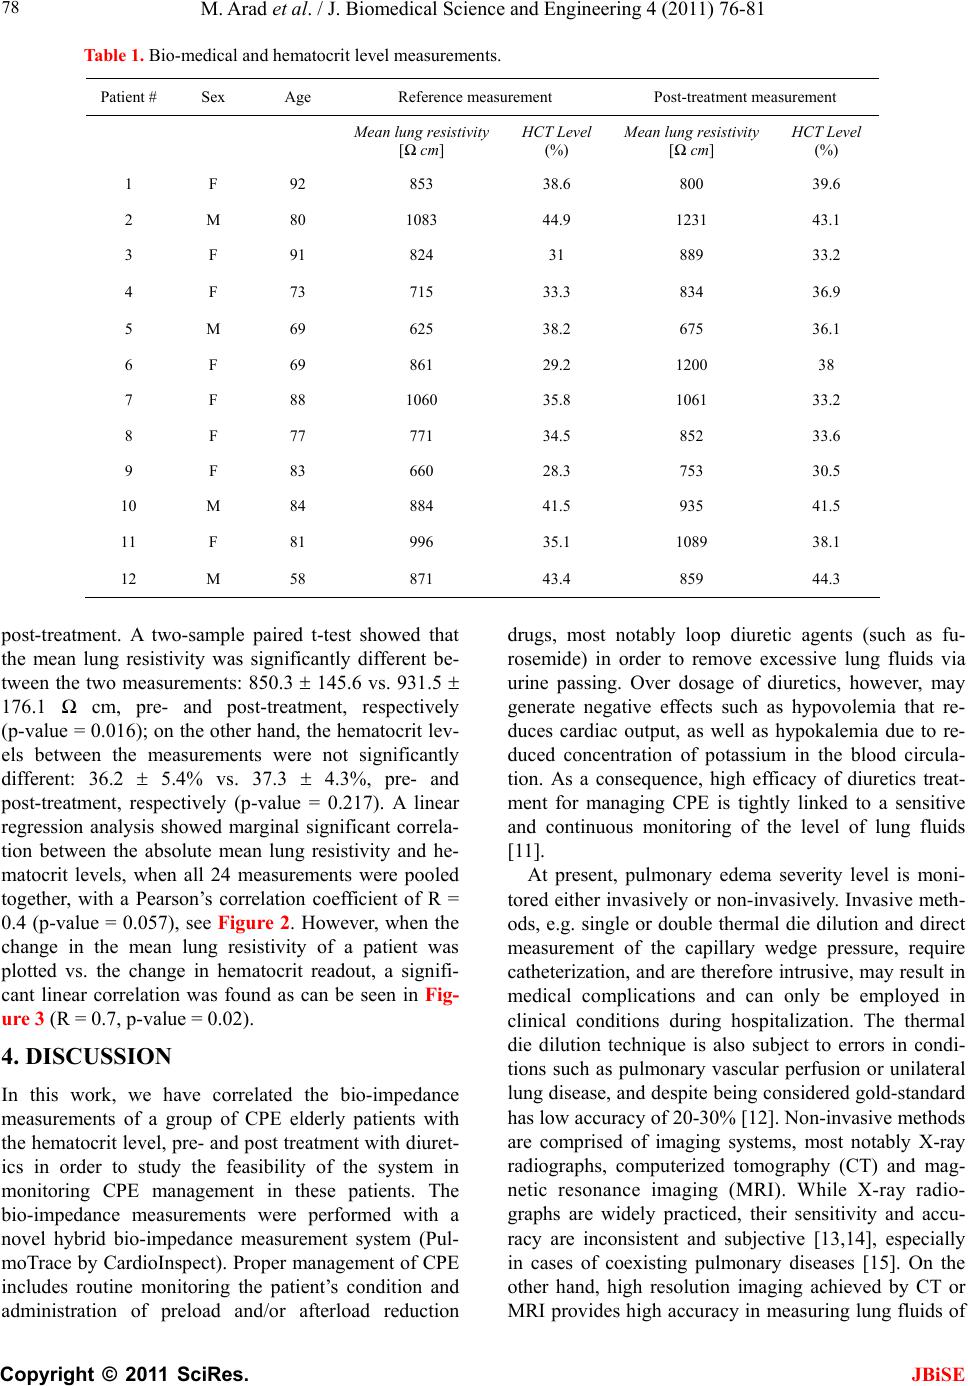
In contrast to the hematocrit, the mean lung resistivity
value was found to be significantly different between the
two measurement phases in the CPE patients (i.e., meas-
urements taken pre- and post-treatment, p-value = 0.016).
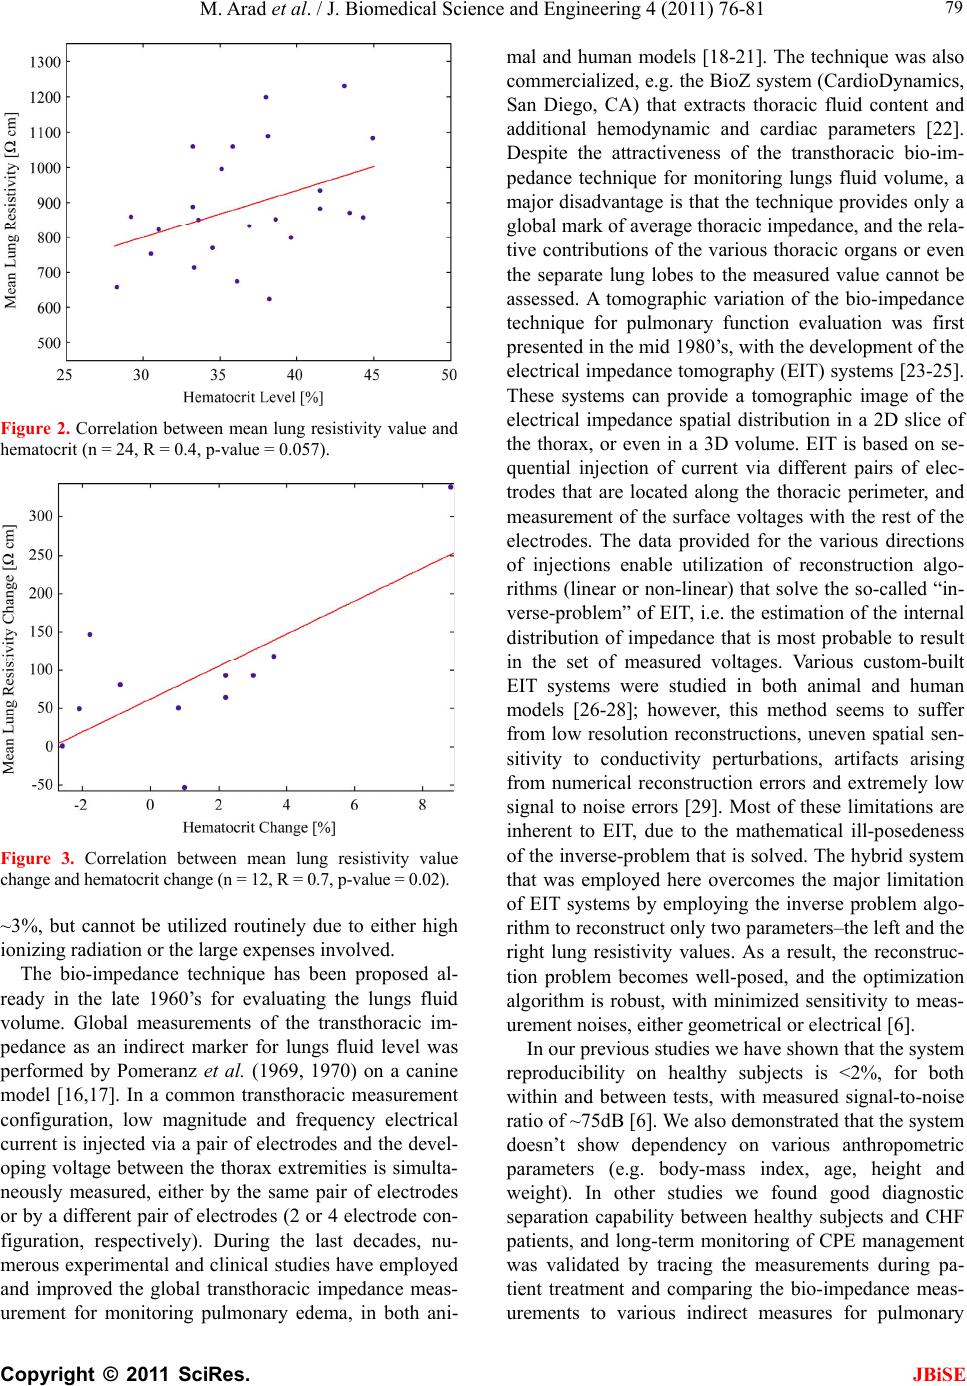
Nevertheless, the results in this study show a significant
correlation between the changes in the measured mean
lung resistivity value by the hybrid EIT system to
changes in hematocrit level following diuretic treatment
of CPE patients (R = 0.7, p-value = 0.02). As a conse-
quence, the validity of lung resistivity measurements by
the system is further supported, and it is proposed that
bio-impedance measurements such as those taken in this
study may be a non-invasive, cost-efficient and pa-
tient-friendly supplement or alternative to other moni-
toring methods for pulmonary congestion.
This study is preliminary and consists of a small num-
ber of subjects, resulting in a large variability in the
changes of mean lung resistivity. Nevertheless, encour-
aging results in this study show a significant correlation
between the changes in the measured mean lung resistiv-
ity value by the hybrid EIT system to changes in hema-
tocrit level following diuretic treatment of CPE patients.
A follow-up large scale study that would address these
limitations would be a subject of a further research.
5. ACKNOWLEDGEMENTS
This work was partially supported by a grant from the ELA KODESZ
Institute for Cardiac Physical Sciences and Engineering.
REFERENCES
[1] Guyton, A.C. (2007) Textbook of medical physiology.
W.B. Saunders Company, Philadelphia.
[2] Fromm, R.E. Jr, Varon, J. and Gibbs, L.R. (1995) Con-
gestive heart failure and pulmonary edema for the emer-
gency physician. Journal of Emergency Medicine, 13,
71-87. doi:10.1016/0736-4679(94)00125-1
[3] Figueras, J. and Weil, M.H. (1977) Increases in plasma
oncotic pressure during acute Cardiogenic pulmonary
edema. Circulation, 55, 195-199.
[4] Figueras, J. and Weil, M.H. (1978) Blood volume prior to
and following treatment of acute Cardiogenic pulmonary
edema. Circulation, 57, 349-355.
[5] Jahnsen, T., Skovborg, F., Hansen, F., Larsen, J., Nordin,
H. and Strom, T. (1983) Variations in blood viscosity in
patients with acute Cardiogenic pulmonary oedema
treated with frusemide. Scandinavian Journal of Clinical
and Laboratory Investigation, 43, 297-300.
[6] Zlochiver, S., Arad, M., Radai, M.M., Barak-Shinar, D.,
Krief, H., Engelman, T., Ben Yehuda, R., Adunsky, A.
and Abboud, S. (2007) A portable bio-impedance system
for monitoring lung resistivity. Medical Engineering and
Physics, 29, 93-100.
doi:10.1016/j.medengphy.2006.02.005
[7] Zlochiver, S., Radai, M.M., Barak-Shinar, D., Ben Gal,
T., Yaari, V., Strasberg, B. and Abboud, S. (2005) Moni-
toring lung resistivity changes in congestive heart failure
patients using the bioimpedance technique. Congestive
Heart Failure, 11 , 289-293.
doi:10.1111/j.1527-5299.2005.04459.x
[8] Freimark, D., Arad, M., Sokolover, R., Zlochiver, S. and
Abboud, S. (2007) Monitoring lung fluid content in CHF
patients under intra-venous diuretics treatment using
bio-impedance measurements. Physiological Measure-
ment, 28, s269-s277. doi:10.1088/0967-3334/28/7/S20
[9] Arad, M., Zlochiver, S., Davidson, T., Shovman, O.,
Shoenfeld, Y., Adunsky, A. and Abboud, S. (2009) Esti-
mating pulmonary congestion in elderly patients using
bio-impedance technique: correlation with clinical ex-
amination and X-ray results. Medical Engineering and
Physics, 31, 959-963.
doi:10.1016/j.medengphy.2009.05.008
[10] Arad, M., Zlochiver, S., Davidson, T., Shoenfeld, Y.,
Adunsky, A. and Abboud, S. (2009) The detection of
pleural effusion using a parametric EIT technique.
Physiological Measurement, 30, 421-428.
doi:10.1088/0967-3334/30/4/006
[11] Schuller, D., Mitchell, J.P., Calandrino, F.S. and Schuster,
D.P. (1991) Fluid balance during pulmonary edema.
Chest, 100, 1068-1075.
doi:10.1378/chest.100.4.1068
[12] Brown, B.H., Flewelling, R., Griffiths, H., Harris, N.D.,
Leathard, A.D., Lu, L., Morice, A.H., Neufeld, G.R.,
Nopp, P. and Wang, W. (1996) EITS changes following
oleic acid induced lung water. Physiological Measure-
ment, 17, A117-A130.
doi:10.1088/0967-3334/17/4A/016
[13] Chakko, S., Woska, D., Martinez, H., de Marchena, E.,
Futterman, L., Kessler, K.M. and Myerberg, R.J. (1991)
Clinical, radiographic and hemodynamic correlations in
chronic congestive heart failure: conflicting results may
lead to inappropriate care. American Journal of Medicine,
90, 353-359.
[14] Liebman, P.R., Philips, E., Weisel, R., Ali, J. and Hecht-
man, H.B. (1978) Diagnostic value of the portable chest
x-ray technic in pulmonary edema. American Journal of
Surgery, 135, 604-604.
doi:10.1016/0002-9610(78)90045-4
[15] Gehlbach, B.K. and Geppert, E. (2004) The pulmonary
manifestations of left heart failure. Chest, 125, 669-682.
doi:10.1378/chest.125.2.669
[16] Pomerantz, M., Baumgartner, R., Lauridson, J. and
Eiseman, B. (1969) Transthoracic electrical impedance
for the early detection of pulmonary edema. Surgery, 66,
260-268.
[17] Pomerantz, M., Delgado, F., and Eiseman, B. (1970)
Clinical evaluation of transthoracic electrical impedance
as a guide to intrathoracic fluid volumes. Annals of Sur-
gery, 171, 686-694.
doi:10.1097/00000658-197005000-00007
[18] Kubicek, W.G., Patterson, R.P. and Witsoe, D.A. (1970)
Impedance cardiograph as a non-invasive method of
monitoring cardiac function and other parameters of the
cardiovascular system. Annals of the New York Academy
of Sciences, 170, 724-732.
doi:10.1111/j.1749-6632.1970.tb17735.x
[19] Fein, A., Grossman, R.F., Jones, J.G., Goodman, P.C. and
Murray, J.F. (1979) Evaluation of transthoracic electrical
M. Arad et al. / J. Biomedical Science and Engineering 4 (2011) 76-81
Copyright © 2011 SciRes.
81
JBiSE
impedance in the diagnosis of pulmonary edema. Circu-
lation, 60, 1156-1160.
[20] Saunders, C.E. (1988) The use of transthoracic electrical
bioimpedance in assessing thoracic fluid status in emer-
gency department patients. American Journal of Emer-
gency Medicine, 6, 337-340.
doi:10.1016/0735-6757(88)90151-9
[21] Charach, G., Rabinovich, P., Grosskopf, I. and Weintraub,
M. (2001) Transthoracic monitoring of the impedance of
the right lung in patients with cardiogenic pulmonary
edema. Critical Care Medicine, 29, 1137-1144.
doi:10.1097/00003246-200106000-00008
[22] Greenberg, B.H., Hermann, D.D., Pranulis, M.F., Lazio,
L. and Cloutier, D. (2000) Reproducibility of impedance
cardiography hemodynamic measures in clinically stable
heart failure patients. Congestive Heart Failure, 6, 74-80.
doi:10.1111/j.1527-5299.2000.80140.x
[23] Brown, B.H., Barber, D.C. and Seagar, A.D. (1985) Ap-
plied potential tomography: possible clinical applications.
Clinical Physics and Physiological Measurement, 6,
109-121. doi:10.1088/0143-0815/6/2/002
[24] Harris, N.D., Suggett, A.J., Barber, D.C. and Brown, B.H.
(1987) Applications of applied potential tomography in
respiratory medicine. Clinical Physics and Physiological
Measurement, 8, 155-165.
doi:10.1088/0143-0815/8/4A/020
[25] Harris, N.D., Suggett, A.J., Barber, D.C. and Brown B.H.
(1988) Applied potential tomography: a new technique
for monitoring pulmonary function. Clinical Physics and
Physiological Measurement, 9, 79-85.
[26] Newell, J.C., Edic, P.M., Ren, X., Larson-Wiseman, J.L.
and Danyleiko, M.D. (1996) Assessment of acute pul-
monary edema in dogs by electrical impedance imaging.
IEEE Transactions on Biomedical Engineering, 43,
133-138. doi:10.1109/10.481982
[27] Frerichs, I., Hahn, G., Schroder, T. and Hellige, G. (1998)
Electrical impedance tomography in monitoring experi-
mental lung injury. Intensive Care Medicine, 24, 829-
836. doi:10.1007/s001340050673
[28] Noble, T.J., Harris, N.D., Morice, A.H., Milnes, P. and
Brown, B.H. (2000) Diuretic induced change in lung
water assessed by electrical impedance tomography.
Physiological Measurement, 21, 155-163.
doi:10.1088/0967-3334/21/1/319
[29] Lionheart, W.R. (2004) EIT reconstruction algorithms:
pitfalls, challenges and recent developments. Physio-
logical Measurement, 25, 125-142.
doi:10.1088/0967-3334/25/1/021