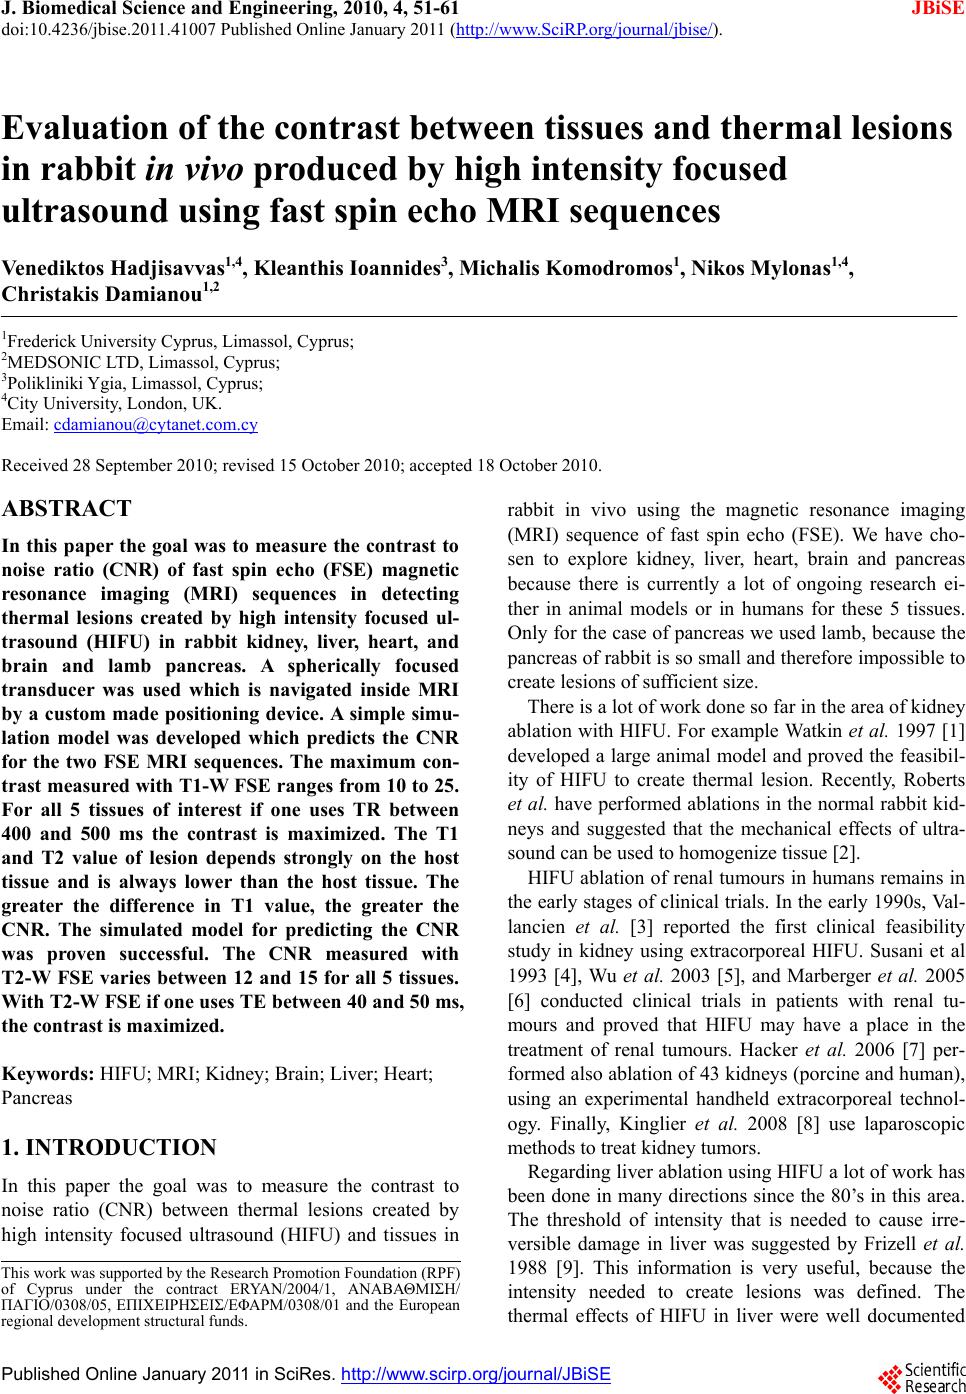
 J. Biomedical Science and Engineering, 2010, 4, 51-61 doi:10.4236/jbise.2011.41007 Published Online January 2011 (http://www.SciRP.org/journal/jbise/ JBiSE ). Published Online January 2011 in SciRes. http://www.scirp.org/journal/JBiSE Evaluation of the contrast between tissues and thermal lesions in rabbit in vivo produced by high intensity focused ultrasound using fast spin echo MRI sequences Venediktos Hadjisavvas1,4, Kleanthis Ioannides3, Michal is Kom o dromos1, Nikos Mylonas1,4, Christakis Damianou1,2 1Frederick University Cyprus, Limassol, Cyprus; 2MEDSONIC LTD, Limassol, Cyprus; 3Polikliniki Ygia, Limassol, Cyprus; 4City University, London, UK. Email: cdamianou@cytanet.com.cy Received 28 September 2010; revised 15 October 2010; accepted 18 October 2010. ABSTRACT In this paper the goal was to measure the contrast to noise ratio (CNR) of fast spin echo (FSE) magnetic resonance imaging (MRI) sequences in detecting thermal lesions created by high intensity focused ul- trasound (HIFU) in rabbit kidney, liver, heart, and brain and lamb pancreas. A spherically focused transducer was used which is navigated inside MRI by a custom made positioning device. A simple simu- lation model was developed which predicts the CNR for the two FSE MRI sequences. The maximum con- trast measured with T1-W FSE ranges from 10 to 25. For all 5 tissues of interest if one uses TR between 400 and 500 ms the contrast is maximized. The T1 and T2 value of lesion depends strongly on the host tissue and is always lower than the host tissue. The greater the difference in T1 value, the greater the CNR. The simulated model for predicting the CNR was proven successful. The CNR measured with T2-W FSE varies between 12 and 15 for all 5 tissues. With T2-W FSE if one uses TE between 40 and 50 ms, the contrast is maximized. Keywords: HIFU; MRI; Kidney; Brain; Liver; Heart; Pancreas 1. INTRODUCTION In this paper the goal was to measure the contrast to noise ratio (CNR) between thermal lesions created by high intensity focused ultrasound (HIFU) and tissues in rabbit in vivo using the magnetic resonance imaging (MRI) sequence of fast spin echo (FSE). We have cho- sen to explore kidney, liver, heart, brain and pancreas because there is currently a lot of ongoing research ei- ther in animal models or in humans for these 5 tissues. Only for the case of pancreas we used lamb, because the pancreas of rabbit is so small and therefore impossible to create lesions of sufficient size. There is a lot of work done so far in the area of kidney ablation with HIFU. For example Watkin et a l. 1997 [1] developed a large animal model and proved the feasibil- ity of HIFU to create thermal lesion. Recently, Roberts et al. have performed ablations in the normal rabbit kid- neys and suggested that the mechanical effects of ultra- sound can be used to homogenize tissue [2]. HIFU ablation of renal tumours in humans remains in the early stages of clinical trials. In the early 1990s, Val- lancien et al. [3] reported the first clinical feasibility study in kidney using extracorporeal HIFU. Susani et al 1993 [4], Wu et al. 2003 [5], and Marberger et al. 2005 [6] conducted clinical trials in patients with renal tu- mours and proved that HIFU may have a place in the treatment of renal tumours. Hacker et al. 2006 [7] per- formed also ablation of 43 kidneys (porcine and human), using an experimental handheld extracorporeal technol- ogy. Finally, Kinglier et al. 2008 [8] use laparoscopic methods to treat kidney tumors. Regarding liver ablation using HIFU a lot of work has been done in many directions since the 80’s in this area. The threshold of intensity that is needed to cause irre- versible damage in liver was suggested by Frizell et al. 1988 [9]. This information is very useful, because the intensity needed to create lesions was defined. The thermal effects of HIFU in liver were well documented This work was supported by the Research Promotion Foundation (RPF) of Cyprus under the contract ERYAN/2004/1, ΑΝΑΒΑΘΜΙΣΗ/ ΠΑΓΙΟ/0308/05, ΕΠΙΧΕΙΡΗΣΕΙΣ/ΕΦΑΡΜ/0308/01 and the European regional development structural funds. 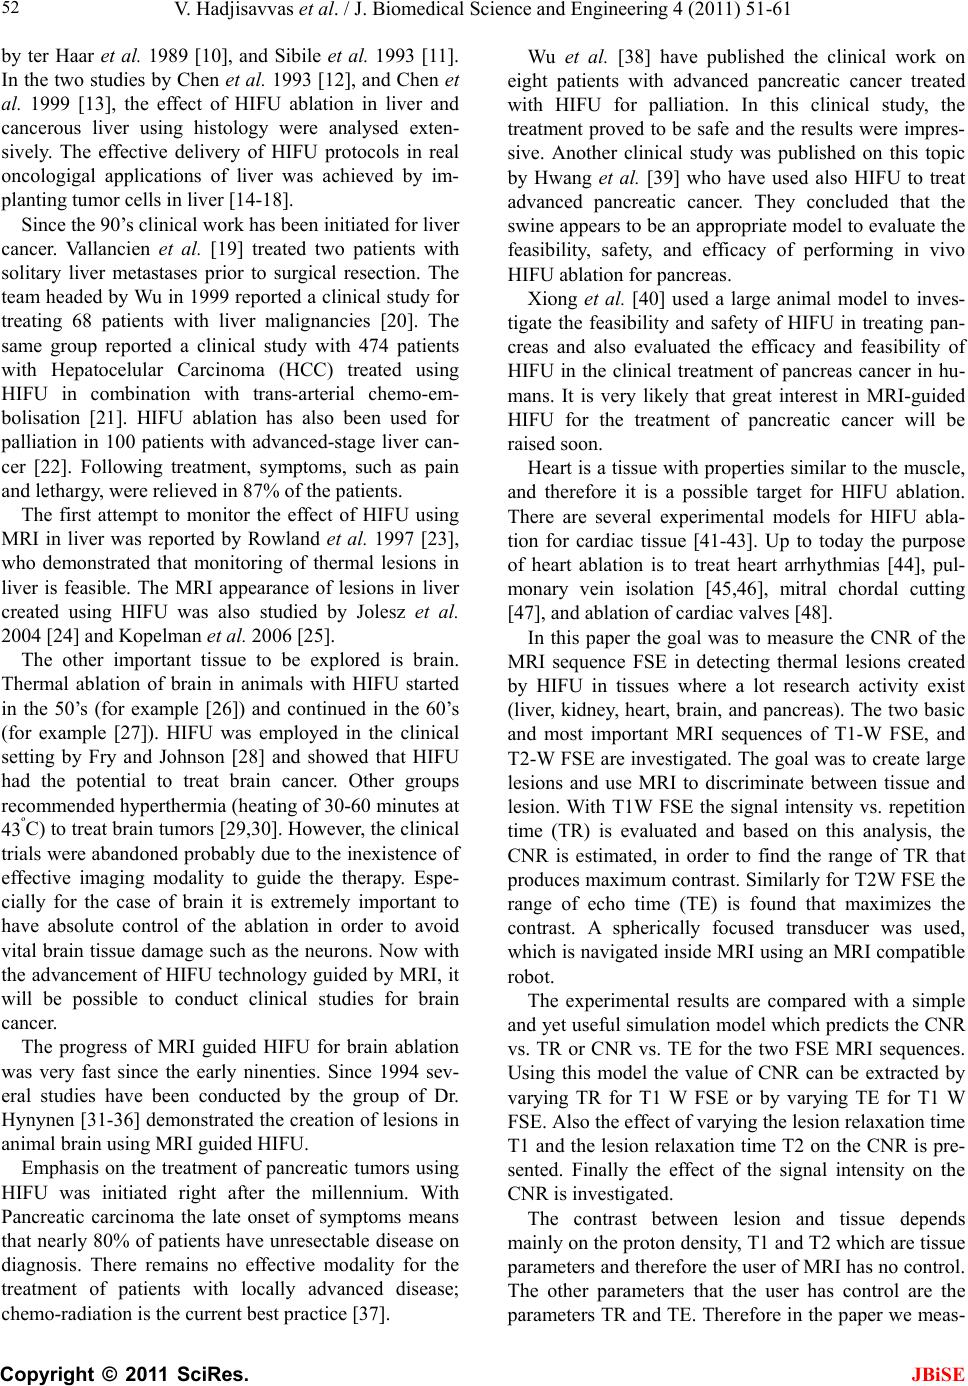 V. Hadjisavvas et al. / J. Biomedical Science and Engineering 4 (2011) 51-61 Copyright © 2011 SciRes. JBiSE 52 by ter Haar et al. 1989 [10], and Sibile et al. 1993 [11]. In the two studies by Chen et al. 1993 [12], and Chen et al. 1999 [13], the effect of HIFU ablation in liver and cancerous liver using histology were analysed exten- sively. The effective delivery of HIFU protocols in real oncologigal applications of liver was achieved by im- planting tumor cells in liver [14-18]. Since the 90’s clinical work has been initiated for liver cancer. Vallancien et al. [19] treated two patients with solitary liver metastases prior to surgical resection. The team headed by Wu in 1999 reported a clinical study for treating 68 patients with liver malignancies [20]. The same group reported a clinical study with 474 patients with Hepatocelular Carcinoma (HCC) treated using HIFU in combination with trans-arterial chemo-em- bolisation [21]. HIFU ablation has also been used for palliation in 100 patients with advanced-stage liver can- cer [22]. Following treatment, symptoms, such as pain and lethargy, were relieved in 87% of the patients. The first attempt to monitor the effect of HIFU using MRI in liver was reported by Rowland et al. 1997 [23], who demonstrated that monitoring of thermal lesions in liver is feasible. The MRI appearance of lesions in liver created using HIFU was also studied by Jolesz et al. 2004 [24] and Kopelman et al. 2006 [25]. The other important tissue to be explored is brain. Thermal ablation of brain in animals with HIFU started in the 50’s (for example [26]) and continued in the 60’s (for example [27]). HIFU was employed in the clinical setting by Fry and Johnson [28] and showed that HIFU had the potential to treat brain cancer. Other groups recommended hyperthermia (heating of 30-60 minutes at 43ºC) to treat brain tumors [29,30]. However, the clinical trials were abandoned probably due to the inexistence of effective imaging modality to guide the therapy. Espe- cially for the case of brain it is extremely important to have absolute control of the ablation in order to avoid vital brain tissue damage such as the neurons. Now with the advancement of HIFU technology guided by MRI, it will be possible to conduct clinical studies for brain cancer. The progress of MRI guided HIFU for brain ablation was very fast since the early ninenties. Since 1994 sev- eral studies have been conducted by the group of Dr. Hynynen [31-36] demonstrated the creation of lesions in animal brain using MRI guided HIFU. Emphasis on the treatment of pancreatic tumors using HIFU was initiated right after the millennium. With Pancreatic carcinoma the late onset of symptoms means that nearly 80% of patients have unresectable disease on diagnosis. There remains no effective modality for the treatment of patients with locally advanced disease; chemo-radiation is the current best practice [37]. Wu et al. [38] have published the clinical work on eight patients with advanced pancreatic cancer treated with HIFU for palliation. In this clinical study, the treatment proved to be safe and the results were impres- sive. Another clinical study was published on this topic by Hwang et al. [39] who have used also HIFU to treat advanced pancreatic cancer. They concluded that the swine appears to be an appropriate model to evaluate the feasibility, safety, and efficacy of performing in vivo HIFU ablation for pancreas. Xiong et al. [40] used a large animal model to inves- tigate the feasibility and safety of HIFU in treating pan- creas and also evaluated the efficacy and feasibility of HIFU in the clinical treatment of pancreas cancer in hu- mans. It is very likely that great interest in MRI-guided HIFU for the treatment of pancreatic cancer will be raised soon. Heart is a tissue with properties similar to the muscle, and therefore it is a possible target for HIFU ablation. There are several experimental models for HIFU abla- tion for cardiac tissue [41-43]. Up to today the purpose of heart ablation is to treat heart arrhythmias [44], pul- monary vein isolation [45,46], mitral chordal cutting [47], and ablation of cardiac valves [48]. In this paper the goal was to measure the CNR of the MRI sequence FSE in detecting thermal lesions created by HIFU in tissues where a lot research activity exist (liver, kidney, heart, brain, and pancreas). The two basic and most important MRI sequences of T1-W FSE, and T2-W FSE are investigated. The goal was to create large lesions and use MRI to discriminate between tissue and lesion. With T1W FSE the signal intensity vs. repetition time (TR) is evaluated and based on this analysis, the CNR is estimated, in order to find the range of TR that produces maximum contrast. Similarly for T2W FSE the range of echo time (TE) is found that maximizes the contrast. A spherically focused transducer was used, which is navigated inside MRI using an MRI compatible robot. The experimental results are compared with a simple and yet useful simulation model which predicts the CNR vs. TR or CNR vs. TE for the two FSE MRI sequences. Using this model the value of CNR can be extracted by varying TR for T1 W FSE or by varying TE for T1 W FSE. Also the effect of varying the lesion relaxation time T1 and the lesion relaxation time T2 on the CNR is pre- sented. Finally the effect of the signal intensity on the CNR is investigated. The contrast between lesion and tissue depends mainly on the proton density, T1 and T2 which are tissue parameters and therefore the user of MRI has no control. The other parameters that the user has control are the parameters TR and TE. Therefore in the paper we meas- 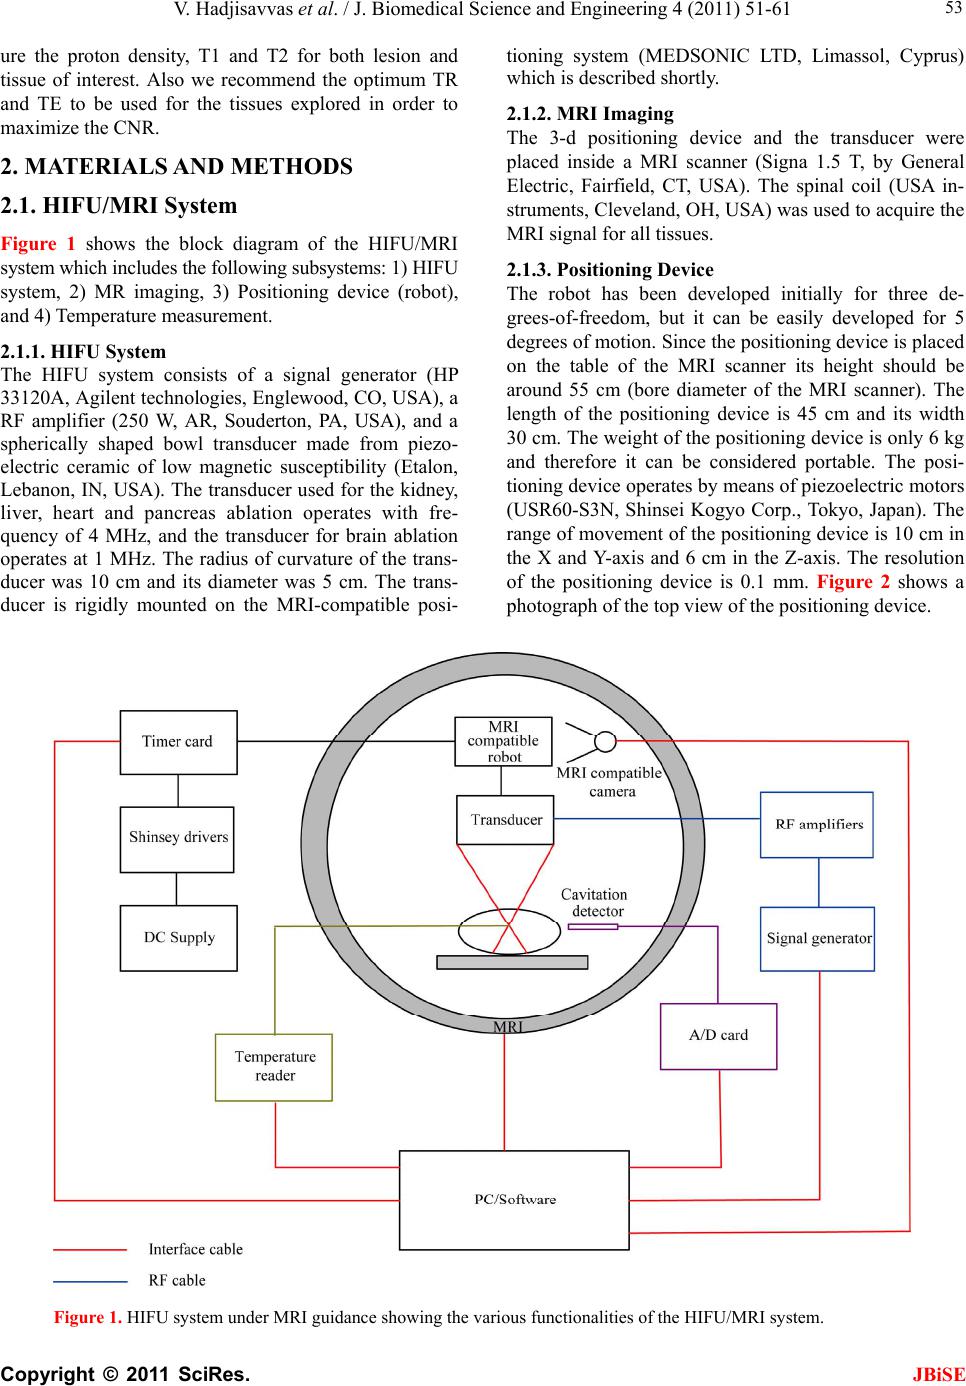 V. Hadjisavvas et al. / J. Biomedical Science and Engineering 4 (2011) 51-61 Copyright © 2011 SciRes. 53 tioning system (MEDSONIC LTD, Limassol, Cyprus) which is described shortly. ure the proton density, T1 and T2 for both lesion and tissue of interest. Also we recommend the optimum TR and TE to be used for the tissues explored in order to maximize the CNR. 2.1.2. M RI Imaging The 3-d positioning device and the transducer were placed inside a MRI scanner (Signa 1.5 T, by General Electric, Fairfield, CT, USA). The spinal coil (USA in- struments, Cleveland, OH, USA) was used to acquire the MRI signal for all tissues. 2. MATERIALS AND METHODS 2.1. HIFU/MRI System Figure 1 shows the block diagram of the HIFU/MRI system which includes the following subsystems: 1) HIFU system, 2) MR imaging, 3) Positioning device (robot), and 4) Temperature measurement. 2.1.3. Position i n g De vi c e The robot has been developed initially for three de- grees-of-freedom, but it can be easily developed for 5 degrees of motion. Since the positioning device is placed on the table of the MRI scanner its height should be around 55 cm (bore diameter of the MRI scanner). The length of the positioning device is 45 cm and its width 30 cm. The weight of the positioning device is only 6 kg and therefore it can be considered portable. The posi- tioning device operates by means of piezoelectric motors (USR60-S3N, Shinsei Kogyo Corp., Tokyo, Japan). The range of movement of the positioning device is 10 cm in the X and Y-axis and 6 cm in the Z-axis. The resolution of the positioning device is 0.1 mm. Figure 2 shows a photograph of the top view of the positioning device. 2.1.1. HIFU System The HIFU system consists of a signal generator (HP 33120A, Agilent technologies, Englewood, CO, USA), a RF amplifier (250 W, AR, Souderton, PA, USA), and a spherically shaped bowl transducer made from piezo- electric ceramic of low magnetic susceptibility (Etalon, Lebanon, IN, USA). The transducer used for the kidney, liver, heart and pancreas ablation operates with fre- quency of 4 MHz, and the transducer for brain ablation operates at 1 MHz. The radius of curvature of the trans- ducer was 10 cm and its diameter was 5 cm. The trans- ducer is rigidly mounted on the MRI-compatible posi- Figure 1. HIFU system under MRI guidance showing the various functionalities of the HIFU/MRI system. JBiSE  V. Hadjisavvas et al. / J. Biomedical Science and Engineering 4 (2011) 51-61 Copyright © 2011 SciRes. JBiSE 54 Figure 2. Top view of the positioning device. 2.1.4. Temper atur e Measur ement Temperature is measured using a data acquisition system (HP 34970A, Agilent technologies, Englewood, CO, USA). Temperature is sensed using a 50-μm diameter T-type copper-costantan thermocouple (Physitemp In- struments, Inc. New Jersey, USA) which is MRI com- patible. The thermocouple is placed in the tissue by means of a catheter. The thermocouple measures the temperature at the focus. This is achieved by applying low-intensity (low enough not to cause tissue damage) and during the application of ultrasound the transducer is scanned accordingly in order to detect the maximum temperature. This establishes positioning of the thermo- couple in the focus of the transducer. The temperature error of the thermocouple is in the order of 0.1°C. 2.1.5. In Vitro Experiments Since the pancreas of rabbit is small, for the case of pan- creas we used lamb pancreas in vitro. The acoustical coupling of Figure 3. A was used for the in vitro ex- periments. With this method the tissue is placed outside the water container which is filled with degassed water. Due to the weight of the water container the coupling with this method is excellent. This method can be de- scribed as a superior to inferior approach, meaning that the transducer is on top of the tissue. The tissue was placed on top of an absorbing material in order to shield adjacent tissue form stray radiation from the bottom. The transducer was placed on the arm of the positioning device and was immersed in the water tank, thus providing good acoustical coupling between tissue and transducer. Any bubbles that may have col- lected under the face of the transducer face were re- moved in order to eliminate any reflections. In all ex- periments the pancreas were extracted from freshly slaughtered lamb, and the experiment was conducted in the same day. In total 6 pancreases were used. 2.1.6 In Vivo Experiments In the animal experiments for liver, kidney, and heart the (a) (b) Figure 3. Coupling methods (a) pancreas in vitro and kidney, liver, heart in vivo, (b) in vivo brain coupling (lateral propaga- tion of ultrasound). coupling method of Figure 3(a) was used. Only for the case of heart the rabbit’s chest was open surgically in order to expose the heart. In Figure 3(b) the approach used for acoustical coupling is lateral meaning that ul- trasound propagates to the tissue either from left or right. This method is used to couple ultrasound to the brain in vivo. The tissue with this method has to be in good con- tact with the water container in order to achieve good coupling. For the in vivo experiments, adult rabbits from Cyprus were used weighing approximately 3.5-4 kg. The rabbit has been proven as a good animal model for monitoring the effects of HIFU using MRI 31-36. Additionally, the cost of conducting experiments with rabbits is low. To- tally 15 rabbits were used in the experiments. The rab- bits were anaesthetized using a mixture of 500 mg of ketamine (100 mg/mL, Aveco, Ford Dodge, IA), 160 mg of xylazine (20 mg/mL, Loyd Laboratories, Shenandoah, IA), and 20 mg of acepromazine (10 mg/mL, Aveco, Ford Dodge, IA) at a dose of 1 mL/kg. Presence of the skull in the ultrasonic path not only distorts the field by reflection, but may also destroy the underlying tissue in contact with it by absorbing ultra- sonic energy and dissipating it as heat. A craniotomy adequate in extent to permit unimpeded passage of the cone of sound was imperative. The extent of the crani- otomy depends on the solid angle of radiation and the depth of the target from the cranial surface. The larger the angle and the deeper the target, the larger the size of craniotomy needed. For the transducer used and a target depth of 1 cm, a circular craniotomy of 3 cm in diameter was adequate. The animal experiments protocol was approved by the national body in Cyprus responsible for animal studies (Ministry of Agriculture, Animal Ser- vices). 2.1.7. HIFU Parameters The in situ spatial average intensity was estimated based on the applied power and the half-power width of the beam of the transducer. The details of the intensity esti- mation can be found in Damianou 2004 et al. [49]. In order to create large lesions, a grid pattern of 3 x 3 or 4 x 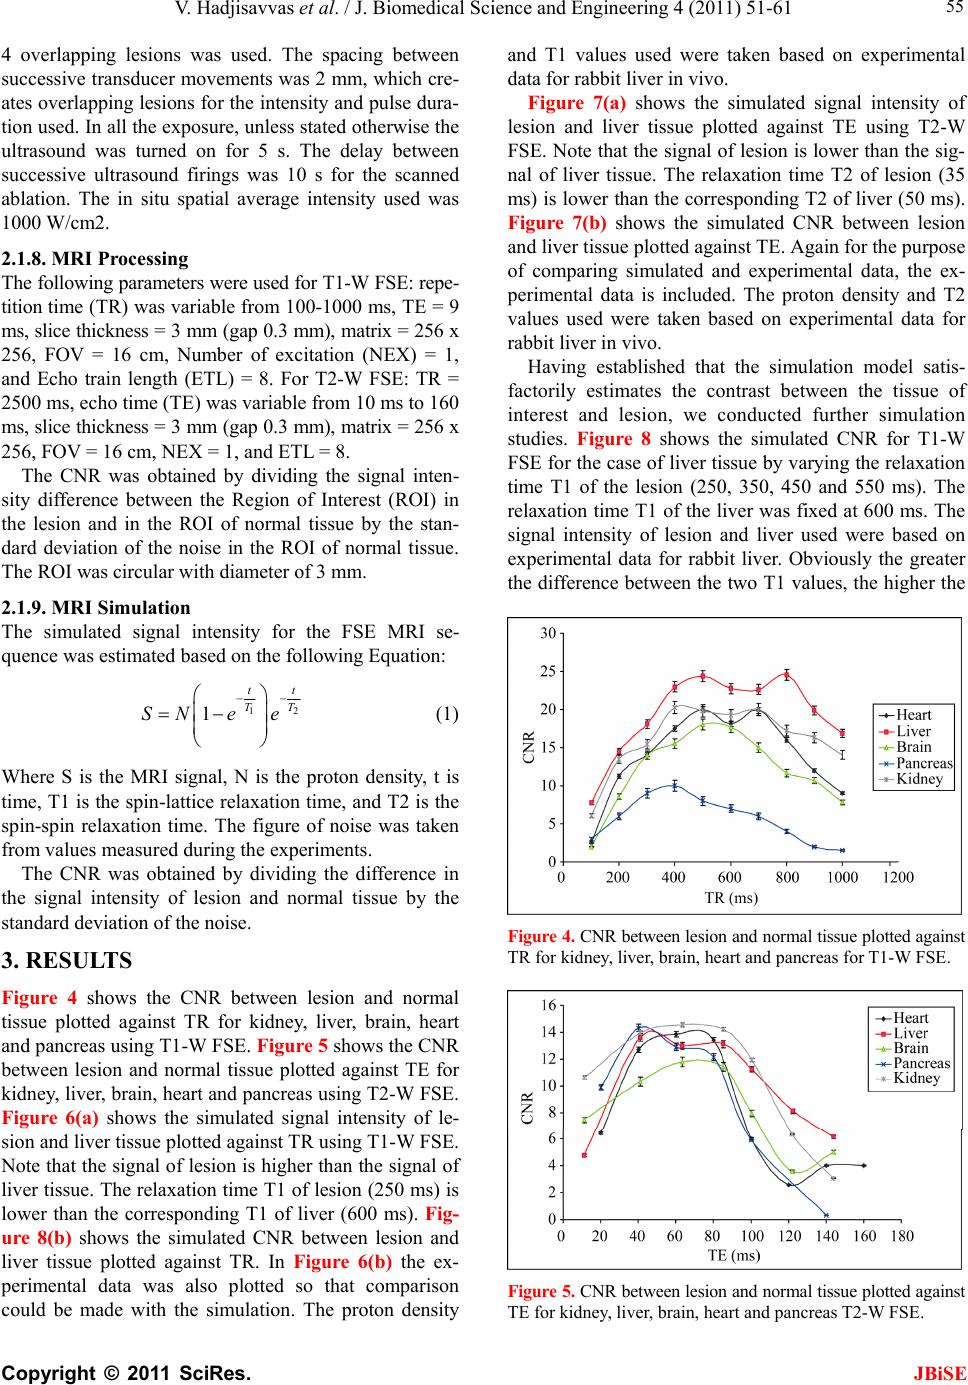 V. Hadjisavvas et al. / J. Biomedical Science and Engineering 4 (2011) 51-61 Copyright © 2011 SciRes. JBiSE 55 4 overlapping lesions was used. The spacing between successive transducer movements was 2 mm, which cre- ates overlapping lesions for the intensity and pulse dura- tion used. In all the exposure, unless stated otherwise the ultrasound was turned on for 5 s. The delay between successive ultrasound firings was 10 s for the scanned ablation. The in situ spatial average intensity used was 1000 W/cm2. 2.1.8. MRI Processing The following parameters were used for T1-W FSE: repe- tition time (TR) was variable from 100-1000 ms, TE = 9 ms, slice thickness = 3 mm (gap 0.3 mm), matrix = 256 x 256, FOV = 16 cm, Number of excitation (NEX) = 1, and Echo train length (ETL) = 8. For T2-W FSE: TR = 2500 ms, echo time (TE) was variable from 10 ms to 160 ms, slice thickness = 3 mm (gap 0.3 mm), matrix = 256 x 256, FOV = 16 cm, NEX = 1, and ETL = 8. The CNR was obtained by dividing the signal inten- sity difference between the Region of Interest (ROI) in the lesion and in the ROI of normal tissue by the stan- dard deviation of the noise in the ROI of normal tissue. The ROI was circular with diameter of 3 mm. 2.1.9. M RI Simulati on The simulated signal intensity for the FSE MRI se- quence was estimated based on the following Equation: 1 1 tt TT SNe e 2 (1) Where S is the MRI signal, N is the proton density, t is time, T1 is the spin-lattice relaxation time, and T2 is the spin-spin relaxation time. The figure of noise was taken from values measured during the experiments. The CNR was obtained by dividing the difference in the signal intensity of lesion and normal tissue by the standard deviation of the noise. 3. RESULTS Figure 4 shows the CNR between lesion and normal tissue plotted against TR for kidney, liver, brain, heart and pancreas using T1-W FSE. Figure 5 shows the CNR between lesion and normal tissue plotted against TE for kidney, liver, brain, heart and pancreas using T2-W FSE. Figure 6(a) shows the simulated signal intensity of le- sion and liver tissue plotted against TR using T1-W FSE. Note that the signal of lesion is higher than the signal of liver tissue. The relaxation time T1 of lesion (250 ms) is lower than the corresponding T1 of liver (600 ms). Fig- ure 8(b) shows the simulated CNR between lesion and liver tissue plotted against TR. In Figure 6(b) the ex- perimental data was also plotted so that comparison could be made with the simulation. The proton density and T1 values used were taken based on experimental data for rabbit liver in vivo. Figure 7(a) shows the simulated signal intensity of lesion and liver tissue plotted against TE using T2-W FSE. Note that the signal of lesion is lower than the sig- nal of liver tissue. The relaxation time T2 of lesion (35 ms) is lower than the corresponding T2 of liver (50 ms). Figure 7(b) shows the simulated CNR between lesion and liver tissue plotted against TE. Again for the purpose of comparing simulated and experimental data, the ex- perimental data is included. The proton density and T2 values used were taken based on experimental data for rabbit liver in vivo. Having established that the simulation model satis- factorily estimates the contrast between the tissue of interest and lesion, we conducted further simulation studies. Figure 8 shows the simulated CNR for T1-W FSE for the case of liver tissue by varying the relaxation time T1 of the lesion (250, 350, 450 and 550 ms). The relaxation time T1 of the liver was fixed at 600 ms. The signal intensity of lesion and liver used were based on experimental data for rabbit liver. Obviously the greater the difference between the two T1 values, the higher the Figure 4. CNR between lesion and normal tissue plotted against TR for kidney, liver, brain, heart and pancreas for T1-W FSE. Figure 5. CNR between lesion and normal tissue plotted against TE for kidney, liver, brain, heart and pancreas T2-W FSE. 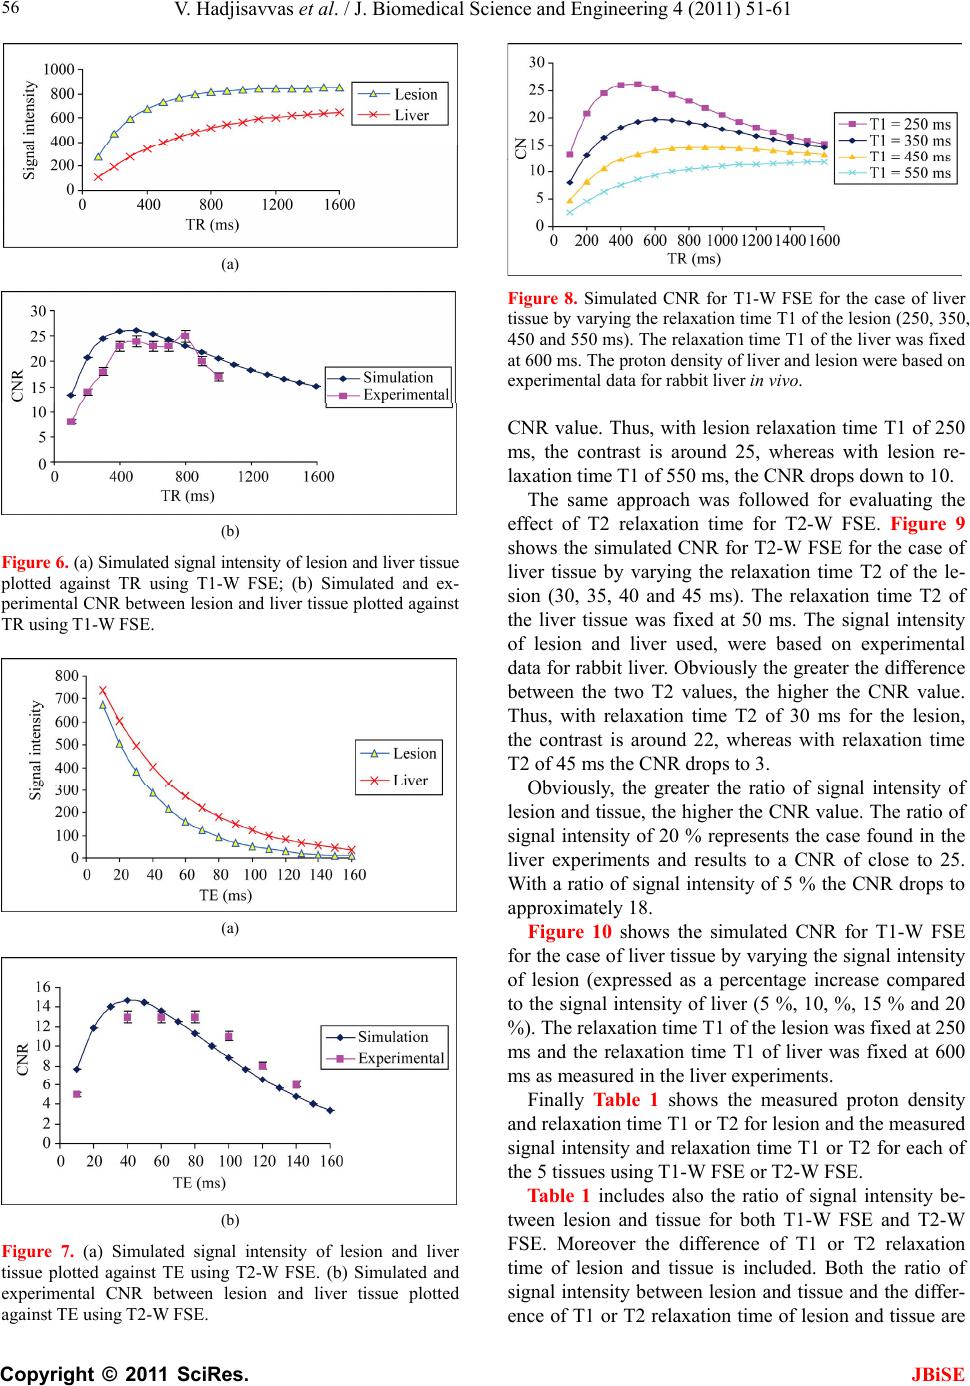 V. Hadjisavvas et al. / J. Biomedical Science and Engineering 4 (2011) 51-61 Copyright © 2011 SciRes. JBiSE 56 (a) (b) Figure 6. (a) Simulated signal intensity of lesion and liver tissue plotted against TR using T1-W FSE; (b) Simulated and ex- perimental CNR between lesion and liver tissue plotted against TR using T1-W FSE. (a) (b) Figure 7. (a) Simulated signal intensity of lesion and liver tissue plotted against TE using T2-W FSE. (b) Simulated and experimental CNR between lesion and liver tissue plotted against TE using T2-W FSE. Figure 8. Simulated CNR for T1-W FSE for the case of liver tissue by varying the relaxation time T1 of the lesion (250, 350, 450 and 550 ms). The relaxation time T1 of the liver was fixed at 600 ms. The proton density of liver and lesion were based on experimental data for rabbit liver in vivo. CNR value. Thus, with lesion relaxation time T1 of 250 ms, the contrast is around 25, whereas with lesion re- laxation time T1 of 550 ms, the CNR drops down to 10. The same approach was followed for evaluating the effect of T2 relaxation time for T2-W FSE. Figure 9 shows the simulated CNR for T2-W FSE for the case of liver tissue by varying the relaxation time T2 of the le- sion (30, 35, 40 and 45 ms). The relaxation time T2 of the liver tissue was fixed at 50 ms. The signal intensity of lesion and liver used, were based on experimental data for rabbit liver. Obviously the greater the difference between the two T2 values, the higher the CNR value. Thus, with relaxation time T2 of 30 ms for the lesion, the contrast is around 22, whereas with relaxation time T2 of 45 ms the CNR drops to 3. Obviously, the greater the ratio of signal intensity of lesion and tissue, the higher the CNR value. The ratio of signal intensity of 20 % represents the case found in the liver experiments and results to a CNR of close to 25. With a ratio of signal intensity of 5 % the CNR drops to approximately 18. Figure 10 shows the simulated CNR for T1-W FSE for the case of liver tissue by varying the signal intensity of lesion (expressed as a percentage increase compared to the signal intensity of liver (5 %, 10, %, 15 % and 20 %). The relaxation time T1 of the lesion was fixed at 250 ms and the relaxation time T1 of liver was fixed at 600 ms as measured in the liver experiments. Finally Table 1 shows the measured proton density and relaxation time T1 or T2 for lesion and the measured signal intensity and relaxation time T1 or T2 for each of the 5 tissues using T1-W FSE or T2-W FSE. Ta b l e 1 includes also the ratio of signal intensity be- tween lesion and tissue for both T1-W FSE and T2-W FSE. Moreover the difference of T1 or T2 relaxation time of lesion and tissue is included. Both the ratio of signal intensity between lesion and tissue and the differ- ence of T1 or T2 relaxation time of lesion and tissue are 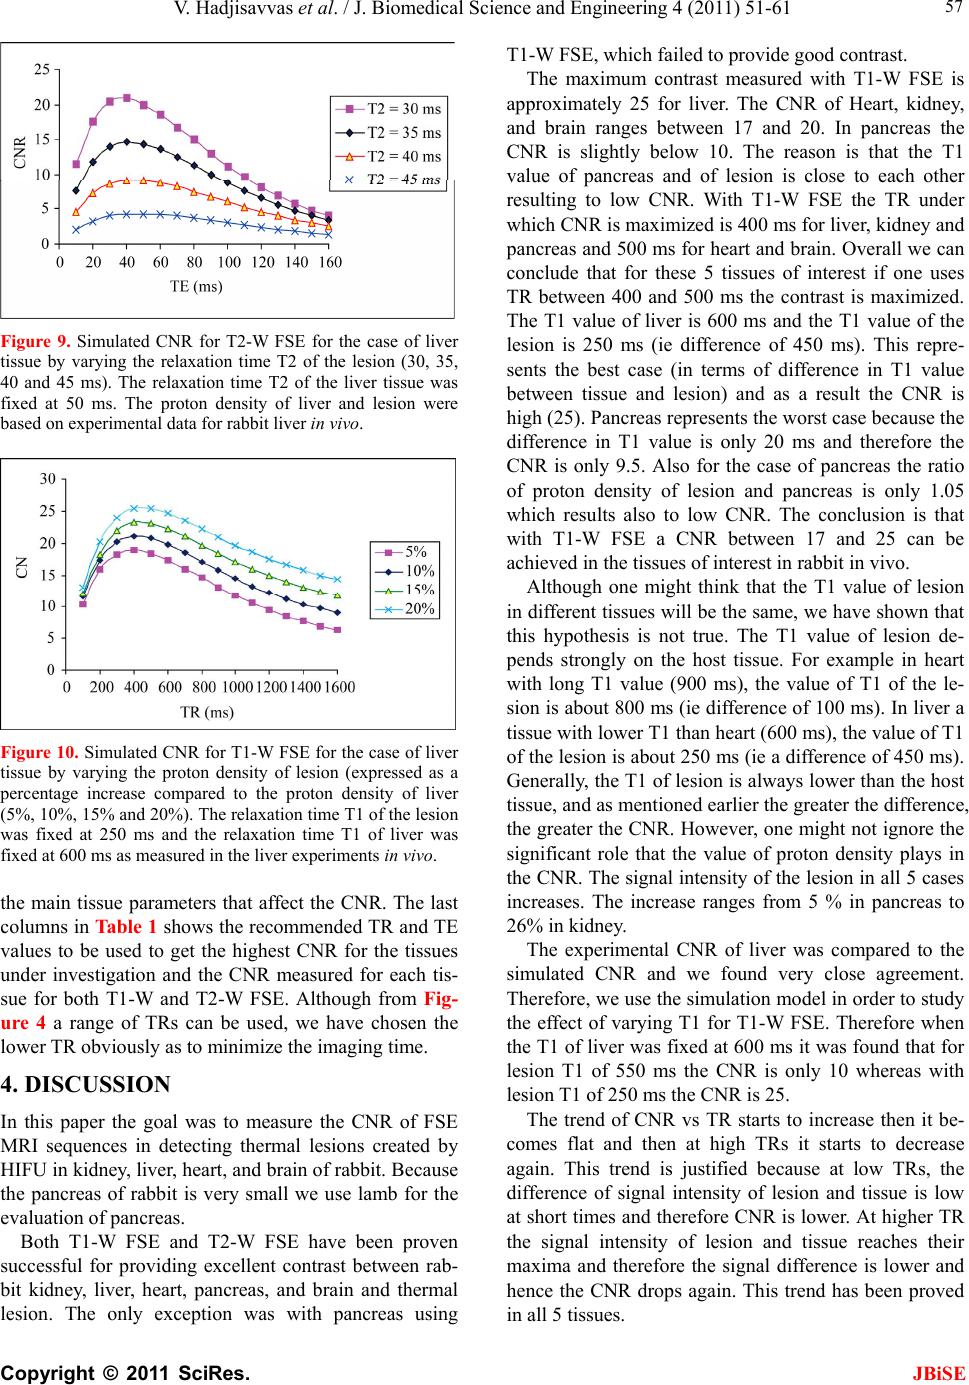 V. Hadjisavvas et al. / J. Biomedical Science and Engineering 4 (2011) 51-61 Copyright © 2011 SciRes. JBiSE 57 Figure 9. Simulated CNR for T2-W FSE for the case of liver tissue by varying the relaxation time T2 of the lesion (30, 35, 40 and 45 ms). The relaxation time T2 of the liver tissue was fixed at 50 ms. The proton density of liver and lesion were based on experimental data for rabbit liver in vivo. Figure 10. Simulated CNR for T1-W FSE for the case of liver tissue by varying the proton density of lesion (expressed as a percentage increase compared to the proton density of liver (5%, 10%, 15% and 20%). The relaxation time T1 of the lesion was fixed at 250 ms and the relaxation time T1 of liver was fixed at 600 ms as measured in the liver experiments in vivo. the main tissue parameters that affect the CNR. The last columns in Tab le 1 shows the recommended TR and TE values to be used to get the highest CNR for the tissues under investigation and the CNR measured for each tis- sue for both T1-W and T2-W FSE. Although from Fig- ure 4 a range of TRs can be used, we have chosen the lower TR obviously as to minimize the imaging time. 4. DISCUSSION In this paper the goal was to measure the CNR of FSE MRI sequences in detecting thermal lesions created by HIFU in kidney, liver, heart, and brain of rabbit. Because the pancreas of rabbit is very small we use lamb for the evaluation of pancreas. Both T1-W FSE and T2-W FSE have been proven successful for providing excellent contrast between rab- bit kidney, liver, heart, pancreas, and brain and thermal lesion. The only exception was with pancreas using T1-W FSE, which failed to provide good contrast. The maximum contrast measured with T1-W FSE is approximately 25 for liver. The CNR of Heart, kidney, and brain ranges between 17 and 20. In pancreas the CNR is slightly below 10. The reason is that the T1 value of pancreas and of lesion is close to each other resulting to low CNR. With T1-W FSE the TR under which CNR is maximized is 400 ms for liver, kidney and pancreas and 500 ms for heart and brain. Overall we can conclude that for these 5 tissues of interest if one uses TR between 400 and 500 ms the contrast is maximized. The T1 value of liver is 600 ms and the T1 value of the lesion is 250 ms (ie difference of 450 ms). This repre- sents the best case (in terms of difference in T1 value between tissue and lesion) and as a result the CNR is high (25). Pancreas represents the worst case because the difference in T1 value is only 20 ms and therefore the CNR is only 9.5. Also for the case of pancreas the ratio of proton density of lesion and pancreas is only 1.05 which results also to low CNR. The conclusion is that with T1-W FSE a CNR between 17 and 25 can be achieved in the tissues of interest in rabbit in vivo. Although one might think that the T1 value of lesion in different tissues will be the same, we have shown that this hypothesis is not true. The T1 value of lesion de- pends strongly on the host tissue. For example in heart with long T1 value (900 ms), the value of T1 of the le- sion is about 800 ms (ie difference of 100 ms). In liver a tissue with lower T1 than heart (600 ms), the value of T1 of the lesion is about 250 ms (ie a difference of 450 ms). Generally, the T1 of lesion is always lower than the host tissue, and as mentioned earlier the greater the difference, the greater the CNR. However, one might not ignore the significant role that the value of proton density plays in the CNR. The signal intensity of the lesion in all 5 cases increases. The increase ranges from 5 % in pancreas to 26% in kidney. The experimental CNR of liver was compared to the simulated CNR and we found very close agreement. Therefore, we use the simulation model in order to study the effect of varying T1 for T1-W FSE. Therefore when the T1 of liver was fixed at 600 ms it was found that for lesion T1 of 550 ms the CNR is only 10 whereas with lesion T1 of 250 ms the CNR is 25. The trend of CNR vs TR starts to increase then it be- comes flat and then at high TRs it starts to decrease again. This trend is justified because at low TRs, the difference of signal intensity of lesion and tissue is low at short times and therefore CNR is lower. At higher TR the signal intensity of lesion and tissue reaches their maxima and therefore the signal difference is lower and hence the CNR drops again. This trend has been proved in all 5 tissues. 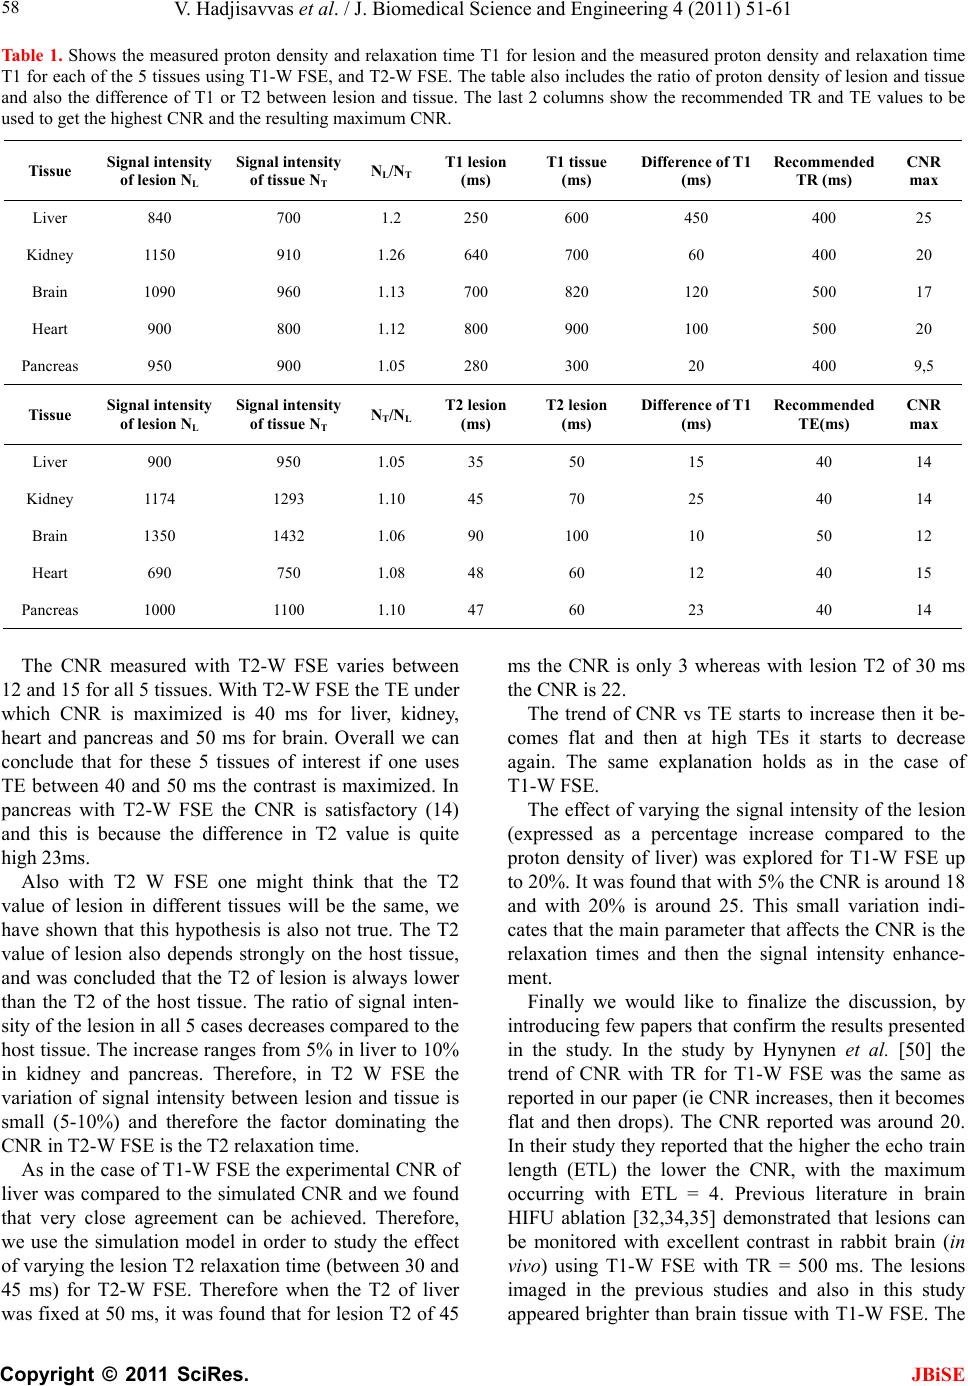 V. Hadjisavvas et al. / J. Biomedical Science and Engineering 4 (2011) 51-61 Copyright © 2011 SciRes. 58 JBiSE Tabl e 1. Shows the measured proton density and relaxation time T1 for lesion and the measured proton density and relaxation time T1 for each of the 5 tissues using T1-W FSE, and T2-W FSE. The table also includes the ratio of proton density of lesion and tissue and also the difference of T1 or T2 between lesion and tissue. The last 2 columns show the recommended TR and TE values to be used to get the highest CNR and the resulting maximum CNR. Tissue Signal intensity of lesion NL Signal intensity of tissue NT NL/NT T1 lesion (ms) T1 tissue (ms) Difference of T1 (ms) Recommended TR (ms) CNR max Liver 840 700 1.2 250 600 450 400 25 Kidney 1150 910 1.26 640 700 60 400 20 Brain 1090 960 1.13 700 820 120 500 17 Heart 900 800 1.12 800 900 100 500 20 Pancreas 950 900 1.05 280 300 20 400 9,5 Tissue Signal intensity of lesion NL Signal intensity of tissue NT NT/NL T2 lesion (ms) T2 lesion (ms) Difference of T1 (ms) Recommended TE(ms) CNR max Liver 900 950 1.05 35 50 15 40 14 Kidney 1174 1293 1.10 45 70 25 40 14 Brain 1350 1432 1.06 90 100 10 50 12 Heart 690 750 1.08 48 60 12 40 15 Pancreas 1000 1100 1.10 47 60 23 40 14 The CNR measured with T2-W FSE varies between 12 and 15 for all 5 tissues. With T2-W FSE the TE under which CNR is maximized is 40 ms for liver, kidney, heart and pancreas and 50 ms for brain. Overall we can conclude that for these 5 tissues of interest if one uses TE between 40 and 50 ms the contrast is maximized. In pancreas with T2-W FSE the CNR is satisfactory (14) and this is because the difference in T2 value is quite high 23ms. Also with T2 W FSE one might think that the T2 value of lesion in different tissues will be the same, we have shown that this hypothesis is also not true. The T2 value of lesion also depends strongly on the host tissue, and was concluded that the T2 of lesion is always lower than the T2 of the host tissue. The ratio of signal inten- sity of the lesion in all 5 cases decreases compared to the host tissue. The increase ranges from 5% in liver to 10% in kidney and pancreas. Therefore, in T2 W FSE the variation of signal intensity between lesion and tissue is small (5-10%) and therefore the factor dominating the CNR in T2-W FSE is the T2 relaxation time. As in the case of T1-W FSE the experimental CNR of liver was compared to the simulated CNR and we found that very close agreement can be achieved. Therefore, we use the simulation model in order to study the effect of varying the lesion T2 relaxation time (between 30 and 45 ms) for T2-W FSE. Therefore when the T2 of liver was fixed at 50 ms, it was found that for lesion T2 of 45 ms the CNR is only 3 whereas with lesion T2 of 30 ms the CNR is 22. The trend of CNR vs TE starts to increase then it be- comes flat and then at high TEs it starts to decrease again. The same explanation holds as in the case of T1-W FSE. The effect of varying the signal intensity of the lesion (expressed as a percentage increase compared to the proton density of liver) was explored for T1-W FSE up to 20%. It was found that with 5% the CNR is around 18 and with 20% is around 25. This small variation indi- cates that the main parameter that affects the CNR is the relaxation times and then the signal intensity enhance- ment. Finally we would like to finalize the discussion, by introducing few papers that confirm the results presented in the study. In the study by Hynynen et al. [50] the trend of CNR with TR for T1-W FSE was the same as reported in our paper (ie CNR increases, then it becomes flat and then drops). The CNR reported was around 20. In their study they reported that the higher the echo train length (ETL) the lower the CNR, with the maximum occurring with ETL = 4. Previous literature in brain HIFU ablation [32,34,35] demonstrated that lesions can be monitored with excellent contrast in rabbit brain (in vivo) using T1-W FSE with TR = 500 ms. The lesions imaged in the previous studies and also in this study appeared brighter than brain tissue with T1-W FSE. The  V. Hadjisavvas et al. / J. Biomedical Science and Engineering 4 (2011) 51-61 Copyright © 2011 SciRes. JBiSE 59 decrease of lesion T1 was also reported by Hynynen et al. [51] in dog thigh muscle in vivo. Finally it was reported [52] that the signal of lesion in kidney in vivo with T1-W FSE increases (up 30% at 73˚C), which is in agreement with the findings of this study. The signal enhancement of lesion in kidney in vivo was also dem- onstrated in the study by Damianou et al. [49]. REFERENCES [1] Watkin, N.A., Morris, S.B., Rivens, I.H. and Ter Haar, G.R. (1997) High-intensity focused ultrasound ablation of the kidney in a large animal model. Journal of Endourology, 11, 191-196. doi:10.1089/end.1997.11.191 [2] Roberts, W.W., Hall, T.L., Ives, K., Wolf, J.S., Jr, Fowlkes, J.B. and Cain, C.A. (2006) Pulsed cavitational ultrasound: A noninvasive technology for controlled tis- sue ablation (histotripsy) in the rabbit kidney. Journal of Urology, 175, 734-738. doi:10.1016/S0022-5347(05)00141-2 [3] Vallancien, G., Chartier-Kastler, E., Harouni, M., Chopin, D. and Bougaran, J. (1993) Focused extracorporeal py- rotherapy: Experimental study and feasibility in man. Seminars in Urology, 11 , 7-9. [4] Susani, M., Madersbacher, S., Kratzik, C., Vingers, L. and Marberger, M. (1993) Morphology of tissue destruc- tion induced by focused ultrasound. European Urology, 23, 34-38. [5] Wu, F., Wang, Z.B., Chen, W.Z., Bai, J., Zhu, H. and Qiao, T.Y. (2003) Preliminary experience using high in- tensity focused ultrasound for the treatment of patients with advanced stage renal malignancy. Journal of Urol- ogy, 170, 2237-2240. doi:10.1097/01.ju.0000097123.34790.70 [6] Marberger, M., Schatzl, G., Cranston, D. and Kennedy, J.E. (2005) Extracorporeal ablation of renal tumours with high-intensity focused ultrasound. BJU International, 95, 52-55. doi:10.1111/j.1464-410X.2005.05200.x [7] Hacker, A., Michel, M.S., Marlinghaus, E., Kohrmann, K.U. and Alken, P. (2006) Extracorporeally induced ablation of renal tissue by high-intensity focused ultra- sound. BJU International, 97, 779-785. doi:10.1111/j.1464-410X.2006.06037.x [8] Klingler, C., Susani, M., Seip, R., Mauermann, J., Sanghvi, N. and Marberger, M. (2008) A novel approach to energy ablative therapy of small renal tumours: laparoscopic high-intensity focused ultrasound. European Urology, 53, 810-818. doi:10.1016/j.eururo.2007.11.020 [9] Frizzell, L. (1988) Threshold dosages for damage to mammalian liver by high intensity focused ultrasound. IEEE Transactions on Ultrasonics, Ferroelectrics and Frequency Control, 35, 578-581. doi:10.1109/58.8036 [10] ter Haar, G., Sinnett, D. and Rivens, I. (1989) High inten- sity focused ultrasound—A surgical technique for the teatment of discrete liver tumors. Physics in Medicine and Biology, 34, 1743-1750. doi:10.1088/0031-9155/34/11/021 [11] Sibille, A., Pra,t F., Chapelon, J.Y., Fadil, F.A., Henry, L., Theillere, Y., Ponchon, T. and Cathignol, D. (1993) Ex- tracorporeal ablation of liver tissue by high-intensity fo- cused ultrasound. Oncology, 50, 375-379. doi:10.1159/000227213 [12] Chen, L., Rivens, I., ter Haar, G., Riddler, S., Hill, C.R. and Bensted, J.P. (1993) Histological changes in rat liver tumours treated with high-intensity focused ultrasound. Ultrasound in Medicine & Biology, 19, 67-74. doi:10.1016/0301-5629(93)90019-K [13] Chen, L., ter Haar, G., Robertson, D., Bensted, J.P. and Hill, C.R. (1999) Histological study of normal and tu- mor-bearing liver treated with focused ultrasound. Ul- trasound in Medicine & Biology, 25, 847-56. doi:10.1016/S0301-5629(99)00028-9 [14] Yang, R., Reilly, C.R., Rescorla, F.J., Faught, P.R., Sanghvi, N.T., Fry, F.J., Franklin Jr, T.D., Lumeng, L. and Grosfeld, J.L. (1991) High-intensity focused ultra- sound in the treatment of experimental liver cancer. Ar- chives of Surgery, 126, 1002-1010. [15] Sibille, A., Prat, F., Chapelon, J.Y., abou el Fadil, F., Henry, L., Theilliere, Y., Ponchon, T. and Cathignol, D. (1993) Characterization of extracorporeal ablation of normal and tumor-bearing liver tissue by high intensity focused ultrasound. Ultrasound in Medicine & Biology, 19, 803-813. doi:10.1016/0301-5629(93)90096-7 [16] Prat, F., Centarti, M., Sibille, A., Fadil, F.A., Henry, L., Chapelon, J.Y. and Cathignol, D. (1995) Extracorporeal high-intensity focused ultrasound for VX2 liver tumors in the rabbit. Hepatology, 21, 832-836. [17] Cheng, S.Q., Zhou, Z.D., Tang, Z.Y., Yu, Y., Wang, H.Z., Bao, S.S. and Qian, D.C. (1997) High-intensity focused ultrasound in the treatment of experimental liver tumour. Journal of Cancer Research and Clinical Oncology, 123, 219-223. doi:10.1007/s004320050050 [18] Chen, L., ter Haar, G., Hill, C.R., Eccles, S.A. and Box, G. (1998) Treatment of implanted liver tumors with focused ultrasound. Ultrasound in Medicine & Biology, 24, 1475-1488. doi:10.1016/S0301-5629(98)00134-3 [19] Vallancien, G., Harouni, M., Veillon, B., Mombet, A., Prapotnich, D., Brisset, J.M. and Bougaran, J. (1992) Focused extracorporeal pyrotherapy: Feasibility study in man. Journal of Endourology, 6, 173-181. doi:10.1089/end.1992.6.173 [20] Wu, F., Chen, W. and Bai, J. (1999) Effect of high-inten- sity focused ultrasound on patients with hepatocellular cancer–preliminary report. Chinese Journal of Ultra- sonog, 8, 213-216. [21] Wu, F., Wang, Z.B., Chen, W.Z., Zou, J.Z., Bai, J., Zhu, H., Li, K.Q., Xie, F.L., Jin, C.B., Su, H.B., et al. (2004) Extracorporeal focused ultrasound surgery for treatment of human solid carcinomas: Early Chinese clinical ex- perience. Ultrasound in Medicine & Biology, 30, 245- 260. doi:10.1016/j.ultrasmedbio.2003.10.010 [22] Li, C.X., Xu, G.L., Jiang, Z.Y., Li, J.J., Luo, G.Y., Shan, H.B., Zhang, R. and Li, Y. (2004) Analysis of clinical ef- fect of high-intensity focused ultrasound on liver cancer. World Journal of Gastroenterology, 10, 2201-2204. [23] Rowland, I.J., Rivens, I., Chen, L., Lebozer, C.H., Collins, D.J., ter Haar, G.R. and Leach, M.O. (1997) MRI study of hepatic tumours following high intensity fo- cused ultrasound surgery. British Journal of Radiology, 70, 144-153. [24] Jolesz, F., Hynynen, K., McDannold, N., Freundlich, D.  V. Hadjisavvas et al. / J. Biomedical Science and Engineering 4 (2011) 51-61 Copyright © 2011 SciRes. JBiSE 60 and Kopelman, D. (2004) Noninvasive thermal ablation of hepatocellular carcinoma by using magnetic resonance imaging-guided focused ultrasound. Gastroenterology, 127, S242-S247. doi:10.1053/j.gastro.2004.09.056 [25] Kopelman, D., Inbar, Y., Hanannel, A., Freundlich, D., Castel, D., Perel, A., Greenfeld, A., Salamon, T., Sareli, M., Valeanu, A. and Papa, M. (2006) Magnetic reso- nance-guided focused ultrasound surgery (MRgFUS): Ablation of liver tissue in a porcine model. European Journal of Radiology, 59, 157-162. doi:10.1016/j.ejrad.2006.04.008 [26] Fry, W., Mosberg, W., Barnard, J. and Fry, F. (1954) Production of focal destructive lesions in the central nervous system with ultrasound. Journal of Neurosurgery , 11, 471-478. doi:10.3171/jns.1954.11.5.0471 [27] Lele, P.P. (1962) A simple method for production of trackless focal lesions with focused ultrasound. Journal of Physiology, 160, 494-512. [28] Fry, F. and Johnson, L.K. (1978) Tumor irradiation with intense ultrasound. Ultrasound in Medicine & Biology, 4, 337-341. doi:10.1016/0301-5629(78)90022-4 [29] Britt, R.H., Lyons, B.E., Pounds, D.W., Prionas, S.D. (1983) Feasibility of ultrasound hyperthermia in the treatment of malignant brain tumors. Med Instrumenta- tion, 7, 172-177. [30] Guthkelch, A.N., Carter, L.P., Cassady, J.R., Hynynen, K.H., Iacono, R.P., Johnson, P.C., Obbens, E.A., Roemer, R.B., Seeger, J.F. and Shimm, D.S. (1991) Treatment of malignant brain tumors with focused ultrasound hyper- thermia and radiation: Results of a phase I trial. Journal of Neuro-Oncology, 10, 271-284. doi:10.1007/BF00177540 [31] Vykhodtseva, N.I., Hynynen, K. and Damianou, C. (1994) Pulse duration and peak intensity during focused ultra- sound surgery: theoretical and experimental effects in rabbit brain in vivo. Ultrasound in Medicine & Biology, 20, 987-1000. doi:10.1016/0301-5629(94)90058-2 [32] Hynynen, K., Vykhodtseva, N.I., Chung, A.H., Sorrentino, V., Colucci, V. and Jolesz, F.A. (1997) Ther- mal effects of focused ultrasound on the brain: determi- nation with MR imaging. Radiology, 204, 247-253. [33] Vykhodtseva, N., Sorrentino, V., Jolesz, F.A., Bronson, R.T. and Hynynen, K. (2000) MRI detection of the ther- mal effects of focused ultrasound on the brain. Ultra- sound in Medicine & Biology, 26, 871-880. doi:10.1016/S0301-5629(00)00216-7 [34] Hynynen, K. McDannold, N. Vykhodtseva, N. and Jolesz, F. (2001) Noninvasive MR Imaging–guided Focal Open- ing of the Blood-Brain-Barrier in Rabbits. Radiology, 230, 640-646. doi:10.1148/radiol.2202001804 [35] Hynynen, K., McDannold, N., Martin, H., Jolesz, F. and Vykhodtseva, N. (2003) The threshold for brain damage in rabbits induced by bursts of ultrasound in the presence of an ultrasound contrast agent (Optison), Ultrasound in Medicine & Biology, 29, 473-481. doi:10.1016/S0301-5629(02)00741-X [36] Hynynen, K., McDannold, N., Sheikov, N., Jolesz, F. and Vykhodtseva, N. (2005) Local and reversible blood–brain barrier disruption by noninvasive focused ultrasound at frequencies suitable for trans-skull sonications. Neuroi- mage, 24, 12-20. doi:10.1016/j.neuroimage.2004.06.046 [37] Whittington, R., Neuberg, D., Tester, W.J., Benson 3rd, A.B. and Haller, D.G. (1995) Protracted intravenous fluorouracil infusion with radiation therapy in the man- agement of localized pancreaticobiliary carcinoma: A phase I Eastern Cooperative Oncology Group Trial. Journal of Clinical Oncology, 13, 227-232. [38] Wu, F, Wang, Z.B., Zhu, H., Chen, W.Z., Zou, J.Z., Bai, J., Li, K.Q., Jin, C.B., Xie, F.L. and Su, H.B. (2005) Fea- sibility of US-guided high-intensity focused ultrasound treatment in patients with advanced pancreatic cancer: Initial experience. Radiology, 236, 1034-1040. doi:10.1148/radiol.2362041105 [39] Hwang, J.H., Yak-Nam, W., Starr, F., Xinbo, F., Marla, P., Warren, C. and Mitchell, S. (2006) The development of a large animal model to evaluate the feasibility, safety, and efficacy of extracorporeal HIFU therapy of the pancreas. Proceedings of 6th International Symposium on Thera- peutic Ultrasound. Oxford, 30 August-2 September 2006. [40] Xiong, L., Huang, X., Yao, S., Yu, J., Hwang, J., Wang, X. and Fei, X. (2006) An experimental study of high inten- sity focused ultrasound on pig’s pancreas and results of early human clinical experience in pancreatic cancer. Proceedings of 6th International Symposium on Thera- peutic Ultrasound. Oxford, 30 August-2 September 2006. [41] He, D.S., Zimmer, J.E., Marcus, F.I., et al. (1995) Appli- cation of ultrasound energy for intracardiac ablation of arrhythmias. European Heart Journal, 16, 961-966. [42] Strickberger, S.A., Tokano, T., Kluiwstra, J.A., et al. (1999) Extracardiac ablation of the canine atrioventricu- lar junction by use of high intensity focused ultrasound. Circulation, 100, 203-208. [43] Lee, L.A., Simon, C., Bove, E.L., et al. (2000) High in- tensity focused ultrasound effect on cardiac tissues: Po- tential for clinical application. Echocardiography, 17, 563-566. doi:10.1046/j.1540-8175.2000.00563.x [44] Engel, D.J., Muratore, R., Hirata, K., Otsuka, R., Fuji- kura, K., Sugioka, K., Marboe, C., Lizzi, F.L. and Homma, S. (2006) Myocardial lesion formation using high-intensity focused ultrasound. Journal of the Ameri- can Society of Echocardiography, 19, pp. 932-937. [45] Schmidt, B., Antz, M., Ernst, S., et al. (2007) Pulmonary vein isolation by high intensity focused ultrasound: first in man study with a steerable balloon catheter. Heart Rhythm, 4, 575-584. doi:10.1016/j.hrthm.2007.01.017 [46] Wong, T., Markides, V., Peters, N.S., et al. (2006) Anat- omic left atrial circumferential ablation to electrically isolate pulmonary veins using a novel focused ultrasound balloon catheter. Heart Rhythm, 3, 370-371. doi:10.1016/j.hrthm.2005.09.006 [47] Abe, Y., Otsuka, R., Muratore, R., Fujikura, K., Okajima, K., Suzuki, K., Wang, J., Marboe, C., Kalisz, A., Ketter- ling, J.A., Lizzi, F.L. and Homma, S. (2007) In vitro mi- tral chordal cutting by high intensity focused ultrasound. Ultrasound in Medicine & Biology, 34, 400-405. doi:10.1016/j.ultrasmedbio.2007.09.003 [48] Otsuka, R., Fujikura, K., Hirata, K., Pulerwitz, T., Oe, Y., Suzuki, T., Sciacca, R., Marboe, C., Wang, J., Burkhoff, D., Muratore, R., Lizzi, F., Homma, S. (2005) In Vitro Ablation Of Cardiac Valves Using High-Intensity Fo- cused Ultrasound. Ultrasound in Medicine & Biology, 31, pp. 109-114. doi:10.1016/j.ultrasmedbio.2004.09.009  V. Hadjisavvas et al. / J. Biomedical Science and Engineering 4 (2011) 51-61 Copyright © 2011 SciRes. 61 JBiSE [49] Damianou, C., Pavlou, M., Velev, O., Kyriakou, K., Trimikliniotis, M. (2004) High intensity focused ultra- sound ablation of kidney guided by ΜRI. Ultrasound in Medicine & Biology, 30, 397-404. [50] Hynynen, K., McDannold, N., Mulkern, R. and Jolesz, F. (2000) Temperature monitoring in fat with MRI. Mag- netic Resonance in Medicine, 43, 901-904. doi:10.1002/1522-2594(200006)43:6<901:AID-MRM18 >3.0.CO;2-A [51] Hynynen, K, Darkazanli, A, Unger, E. and Schenck, J.F. (1993) MRI-guided noninvasive ultrasound surgery. Medical Physics, 20, 107-115 doi:10.1118/1.597093 [52] McDannold, N., Fossheim, S.L., Rasmussen, H., Martin, H., Vykhodtseva, N. and Hynynen, K. (2004) Heat-acti- vated liposomal MR contrast agent: Initial in vivo results in rabbit liver and kidney. Radiology, 230, 743-752. doi:10.1148/radiol.2303021713
|