 International Journal of Geosciences, 2013, 4, 30-38 http://dx.doi.org/10.4236/ijg.2013.45B006 Published Online September 2013 (http://www.scirp.org/journal/ijg) Copyright © 2013 SciRes. IJG Extreme Events Assessment Methodology Coupling Debris Flow, Flooding and Tidal Levels in the Coastal Floodplain of the São Paulo North Coast (Brazil) Rafael de Oliveira Sakai1, Diego Lourenço Cart acho1, Emilia Arasaki1,2, Paolo Alfredini1, Alessandro Pezzoli3, Wilson Cabral de Sousa Júnior4, Maurizio Rosso3, Luca Magni5 1Polytechnic School of São Paulo University, Department of Hydraulic and Environmental Engineering, Harbour and Coastal Area of the Hydraulic Laboratory, Avenida Professor Luciano Gualberto, Travessa 3, n. 380, Cidade Universitaria, São Paulo, Brazil 2National Institute of for Space Research, Av. Dos Astronautas n. 1758, São José dos Campos, São Paulo, Brazil 3Polytechnic of Torino, Engineering Faculty, Department of Environment, Land and Infrastructure Engineering, Corso Duca degli Abruzzi n. 24, Torino, Italy 4Technological Institute of Aeronautics, Infrastructure Engineering Division, Department of Hydric Resources and Environmental Sanitation, Praça Marechal Eduardo Gomes n. 50, ITA-IEI, São José dos Campos, São Paulo, Brazil 5Studio Rosso Ingegneri Associati s.r.l., Corso Principe Oddone, Torino, Italy Email: rafael.sakai@promon.com.br, diego.cartacho@promon.com.br, earasaki@usp.br, alfredin@usp.br, alessandro.pezzoli@polito.it, maurizio.rosso@polito.it, wilson@ita.br, magni@sr ia.it Received June 2013 ABSTRACT The North Coastal Region of the State of São Paulo, which comprises the Municipalities of Caraguatatuba, São Sebas- tião, Ilhabela and Ubatuba, is one of the most prone to flooding and debris flow deposition Brazilian areas, owing to hydrological extreme rainfall events usually coup led with extreme tidal levels. This risk is also high due to human lives and material assets, with incr easing population rates and the establishment of large companies such as the Oil industry, with reduced defense/prevention measures and works. The catastrophic scenario of the city of Caraguatatuba, in March 1967, resulting from one of the most serious natural disasters in Brazil, fosters discussions about probabilities of heavy rainfall-caused events and rise in the sea level in coastal areas. Hence, this research is a consequence of this reality. The research is founded on an innovative methodology based on the analysis of past data of rainfall and tidal stations, com- plemented with debris flow registers in the region of the nor th coastal zone of the State of São Paulo (Brazil). The anay- sis developed involved the meteorological, hydraulic, geotechnical and statistical knowledge areas. Practical results are intended to be used for urban planning, designs of macro-drainage, fluvial, maritime projects and debris flow retention structures. These practical applications will then associate the probability of occurrence of certain types of heavy rai n- fall-caused events such as flooding or debris flow coupled with a corresponding increase in tidal levels. Keywords: Meteorology; Hydrology; Maritime Hydraulics; Rainfall; Tidal Levels; Extreme Events; Natural Disasters; Geomorphology; Debris-Flow; Flooding 1. Introduction This research is inserted into an area of Civil Engineering, in the interface between Maritime Hydraulics (tidal le- vels and hyperconcentrated flows), Hydrology (rainfall) and Geotechnics (percolation and landslides). Our main objective was to evaluate heavy rainfall- caused events combined with tidal levels, and to obtain practical results applicable to urban planning fluvial and maritime projects and debris flow retention structures in the Santo Antonio River Basin (Figure 1), located in the city of Caraguatatuba, on the North Coast of São Paulo /Brazil. Coastal areas are subject to severe sea action and pre- cipitation. The north coastal region of São Paulo is known for its orographic rainfall, caused by moisture fronts from the Atlantic Ocean; when they collide with the mountain range of Serra do Mar, there is a precipita- tion on the coastal towns. There is a great demand for studies on the subject, mainly with historical o ccurrences of disasters in the last century. A ccording to Brigatti and Sant’Anna Neto [1], the Northern Coast of São Paulo, for its own natural characteristics and the recent economic dynamics, is characterized as an area where studies 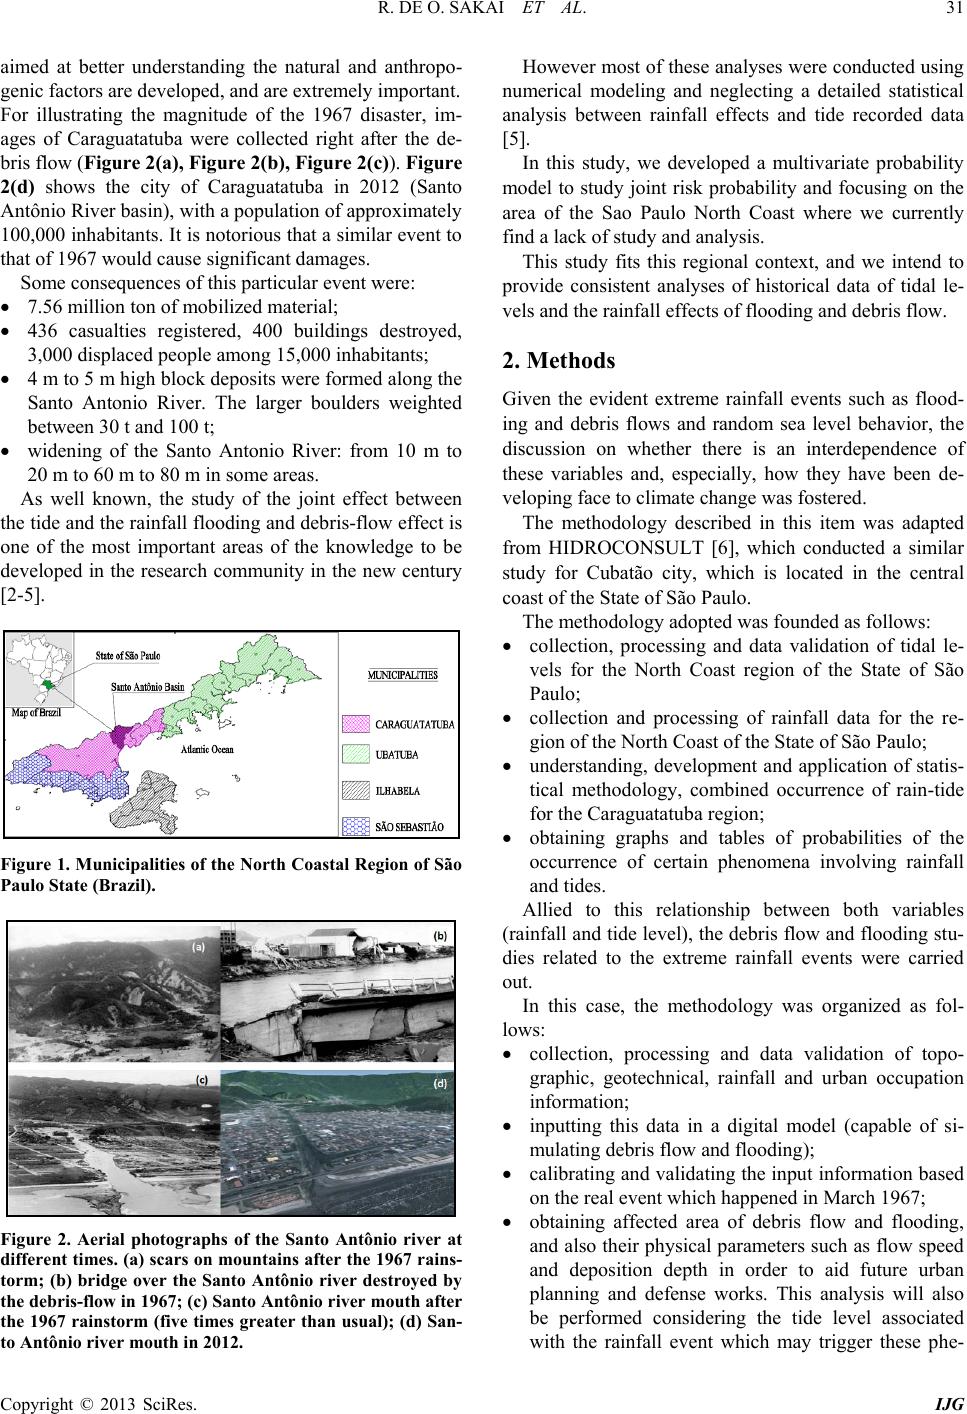 R. DE O. SAKAI ET AL. Copyright © 2013 SciRes. IJG aimed at better understanding the natural and anthropo- genic factors are developed, and are extremely important. For illustrating the magnitude of the 1967 disaster, im- ages of Caraguatatuba were collected right after the de- bris flow (Figure 2(a), Figure 2(b), Figure 2(c)). Figure 2(d) shows the city of Caraguatatuba in 2012 (Santo Antônio River basin), with a population of approximately 100,000 inhabitants. It is no torious that a similar even t to that of 19 6 7 would cause significant dam ages. Some consequences of this particular event were: • 7.56 million ton of mobilized material; • 436 casualties registered, 400 buildings destroyed, 3,000 displaced peo ple among 15,000 inhabitant s ; • 4 m t o 5 m high block deposits were formed along the Santo Antonio River. The larger boulders weighted between 30 t and 100 t; • widening of the Santo Antonio River: from 10 m to 20 m to 60 m to 80 m in some areas. As well known, the study of the joint effect between the tide and the rainfall flooding and debris-flow effect is one of the most important areas of the knowledge to be developed in the research community in the new century [2-5]. Figure 1. Municipalities of the North Coastal Region of São Paulo State (Brazil). Figure 2. Aerial photographs of the Santo Antônio river at different times. (a) scars on mountains after the 1967 rains- torm; (b) bridge over the Santo Antônio river destroyed by the debris-fl ow in 1967; (c) Santo Antônio river mouth after the 1967 rainstorm (five times greater than usual); (d) San- to Antônio river mouth in 2012. However most of these analyses were conducted using numerical modeling and neglecting a detailed statistical analysis between rainfall effects and tide recorded data [5]. In this study, we developed a multivariate probability model to study joint risk probability and focusing on the area of the Sao Paulo North Coast where we currently find a lack of study and analysis. This study fits this regional context, and we intend to provide consistent analyses of historical data of tidal le- vels and t he ra infall ef fe c ts of flooding and de bri s f l ow. 2. Methods Given the evident extreme rainfall events such as flood- ing and debris flows and random sea level behavior, the discussion on whether there is an interdependence of these variables and, especially, how they have been de- veloping face to climate change was fostered. The methodology described in this item was adapted from HIDROCONSULT [6], which conducted a similar study for Cubatão city, which is located in the central coast of the State of São Paulo. The methodology adopted was founded as follows: • collection, processing and data validation of tidal le- vels for the North Coast region of the State of São Paulo; • collection and processing of rainfall data for the re- gion of the North Coast of the State of São Paulo; • understanding, development and application of statis- tical methodology, combined occurrence of rain-tide for the Caraguatatuba region; • obtaining graphs and tables of probabilities of the occurrence of certain phenomena involving rainfall and tides. Allied to this relationship between both variables (rainfall and tide level), the debris flow and flooding stu- dies related to the extreme rainfall events were carried out. In this case, the methodology was organized as fol- lows: • collection, processing and data validation of topo- graphic, geotechnical, rainfall and urban occupation information; • inputting this data in a digital model (capable of si- mulating debris flow and flooding); • calibrating and validating the input informatio n based on the real event which happened in March 1967; • obtaining affected area of debris flow and flooding, and also their physical parameters such as flow speed and deposition depth in order to aid future urban planning and defense works. This analysis will also be performed considering the tide level associated with the rainfall event which may trigger these phe-  R. DE O. SAKAI ET AL. Copyright © 2013 SciRes. IJG nomena. 2.1. Getting the Database The database was composed of two groups: tidal levels, rainfall values and geographic data. The characteristics of these values are explained below. 2.1.1. Tidal Data The tidal level data come from different sources from different institutions, as describe d: • IGC tidal station (Cartographic and Geographic In- stitute) in Ubatuba; • IOUSP tidal station (Institute of Oceanography, USP- University of São Paulo) in Ubatuba; • CTH tidal station (Hydraulic Technological Center) on Martin de Sá Beach/Caraguatatuba; • São Sebastião Harbour tidal station; • Buoy of CEBIMar (Marine Biology Center, Univer- sity of São Paulo) in São Se bastião. The compilation of information from tidal stations generated a large database from 1954 to 2005, with some intermediate gaps. This database comprises over 225,000 hourly values of tidal levels. 2.1.2. Rainfall Data The composition of the rainfall database in the city of Caraguatatuba started with searches of data availability in ANA (Agê ncia Nacional de Aguas) [7]. The E2-046 rainfall station (Caraguatatuba) contains data from 1943 to 2010, totaling 24,603 daily values of rainfall heights, and was thus considered in this research. For the debris flow and flooding simulation, which are events that require greater data resolution (minimum hourly rate), the daily values provided by ANA are not optimal. Hence, a statistical work was necessary in order to achieve a reliable conversion between both resolu- tions. 2.1.3. Geographic Data Geographic data comprises topographic, urban occupa- tion and geotechnical data. Topographical plans from the Cartographic and Geo- graphic Institute of the State of São Paulo (IGC-SP) at a 1:2000 scale were used to define the topography of the lower region of the Santo Antônio basin, associated with smaller scale maps obtained from Cruz [8] for its higher areas. The inhabited areas of the municipality were also mapped in order to better associate the flow and flood- ing-affected areas to the risks to the population. Some geotechnical surveys were conducted along a possible alignment for the escape tunnel from the Parai- buna Dam, which is located in the highlands right above Caraguatatuba Serra do Mar. Such surveys were con- ducted from the higher points of the San Antônio River basin and its lower ones, located in the Coastal Plain. The Tables 1 and 2 show some of the soil layers depth and main soil characteristics. 2.2. Analysis Between Rainfall and Tidal Data 2.2.1. Data Compilation From the database of tides and rainfall heights, the first procedure for applying the methodology was performed: data compilation. The tides and rainfall values were organized so as to allow direct relationships between the daily rainfall in the Santo Antonio River Basin, and its levels in the tidal st a- tions of the Northern Coast of the State of São Paulo. Table 3 illustrates how the data, for the month of Jan- uary 1954, were compiled. At the end of this step, 9.361 days had been recorded with the relationship between rainfall and tides (High tide; Low tide and Mean Sea Level). 2.2.2. Division of Database Into Rainfall Groups This next step of the methodology divides the database into groups, based on the accumulated daily rainfall: P ≥ 0 mm/day, P ≥ 25 mm/day, P ≥ 50 mm/day, P ≥ 75 mm/day, P ≥ 100 mm/da y. Table 1. Soil layers thickne s s on oi l pipeline of Serra do Mar, Santo Antônio river basin Residual/Culluvial Soil Depth Region Bore Hole Elevation (m) Bore Hole Elevation (m) Soil Layers (From Shallwer to Deeper) Residual/Culluvial Soil Depth Slightly Decomposed Bedrock Thickness (m) Oil Popeline SP-1 25 8.2 0 SE-1 175.6 8 37.5 SE-16 233.8 9 6 SE-15 315.5 21.8 8.2 SE-13 454.8 10 47.5 SP-2 699.8 15.54 0  R. DE O. SAKAI ET AL. Copyright © 2013 SciRes. IJG Table 2. Soil layer s thickness on high lands and hills of Serra do Mar, Santo Antônio river basin. Residual/Culluvial Soil Depth Region Bore Hole Bore Hole Elevation (m) Soil Layers (From Shallwer to Deeper) Residual/Culluvial Soil Depth Decomposed Bedrock Thickness (m) Slightly Decomposed Bedrock Thickness (m) Highlands SP-540 718.07 4.5 0 10.3 SP-541 694.25 1.45 5 0 SP-537 767.76 23.9 17.1 10.8 SP-546 742.44 27.2 6.2 6 SP-567 717.52 78.75 4.85 0 SP-550 715.05 2.8 0 0 SP-571 764.36 38.85 0 35.5 Hills SP-722 679.4 3 4.15 3.55 SP-707 708.44 4 51 0 SP-723 609.36 43.33 6.24 0 SP-724 496.36 10.55 0.82 2.42 CFO-1 387.25 14.1 1.9 0.5 SP-783 288.86 10 0 0 SP-782 125.01 30.7 24.3 0 SP-781 299.56 44 2.4 0 SP-780 171.84 4.6 3.9 0.6 Table 3. Example of compilation of daily tidal levels and daily rainfall heights, for the Santo Antônio Basin, in January 1954. Date Data of tidal station (IBGE Reference) Rainfall (mm/day) Low Tide (cm) Mean Sea Level (cm) High Tide (cm) 01/01/1954 −74.83 −26.96 15.17 0 02/01/1954 −78.83 −34.92 4.17 0 03/01/1954 −62.83 −13.13 20.17 16.7 04/01/1954 −54.83 12.50 60.17 14.5 05/01/1954 −85.83 −8.54 45.17 7.9 06/01/1954 −97.83 −19.50 25.17 3.2 07/01/1954 −75.83 −16.92 25.17 4.2 08/01/1954 −56.83 4.87 45.17 0 09/01/1954 −57.83 −3.83 29.17 0 10/01/1954 −67.83 −20.21 8.17 0 11/01/1954 −64.83 −19.54 4.17 0 12/01/1954 −44.83 −19.79 3.17 0 13/01/1954 −34.83 −11.83 27.17 0 14/01/1954 −31.83 −1.21 30.17 0 15/01/1954 −59.83 −11.08 35.17 0 16/01/1954 −64.83 −14.17 28.17 0 17/01/1954 −71.83 −15.29 28.17 0 18/01/1954 −64.83 0.00 44.17 0 19/01/1954 −77.83 −6.67 38.17 1.2 20/01/1954 −79.83 −12.67 36.17 0 21/01/1954 −62.83 −8.13 41.17 3.3 22/01/1954 −61.83 −7.00 37.17 2.5 23/01/1954 −61.83 −9.92 36.17 0 24/01/1954 −42.83 −6.00 30.17 0 25/01/1954 −39.83 −14.67 13.17 0 26/01/1954 −38.83 −11.25 13.17 0 27/01/1954 −26.83 −7.08 11.17 0 28/01/1954 −40.83 −18.46 −1.83 0 29/01/1954 −51.83 −21.83 2.17 0 30/01/1954 −48.83 −15.46 16.17 0 31/01/1954 −57.83 −6.38 36.17 0 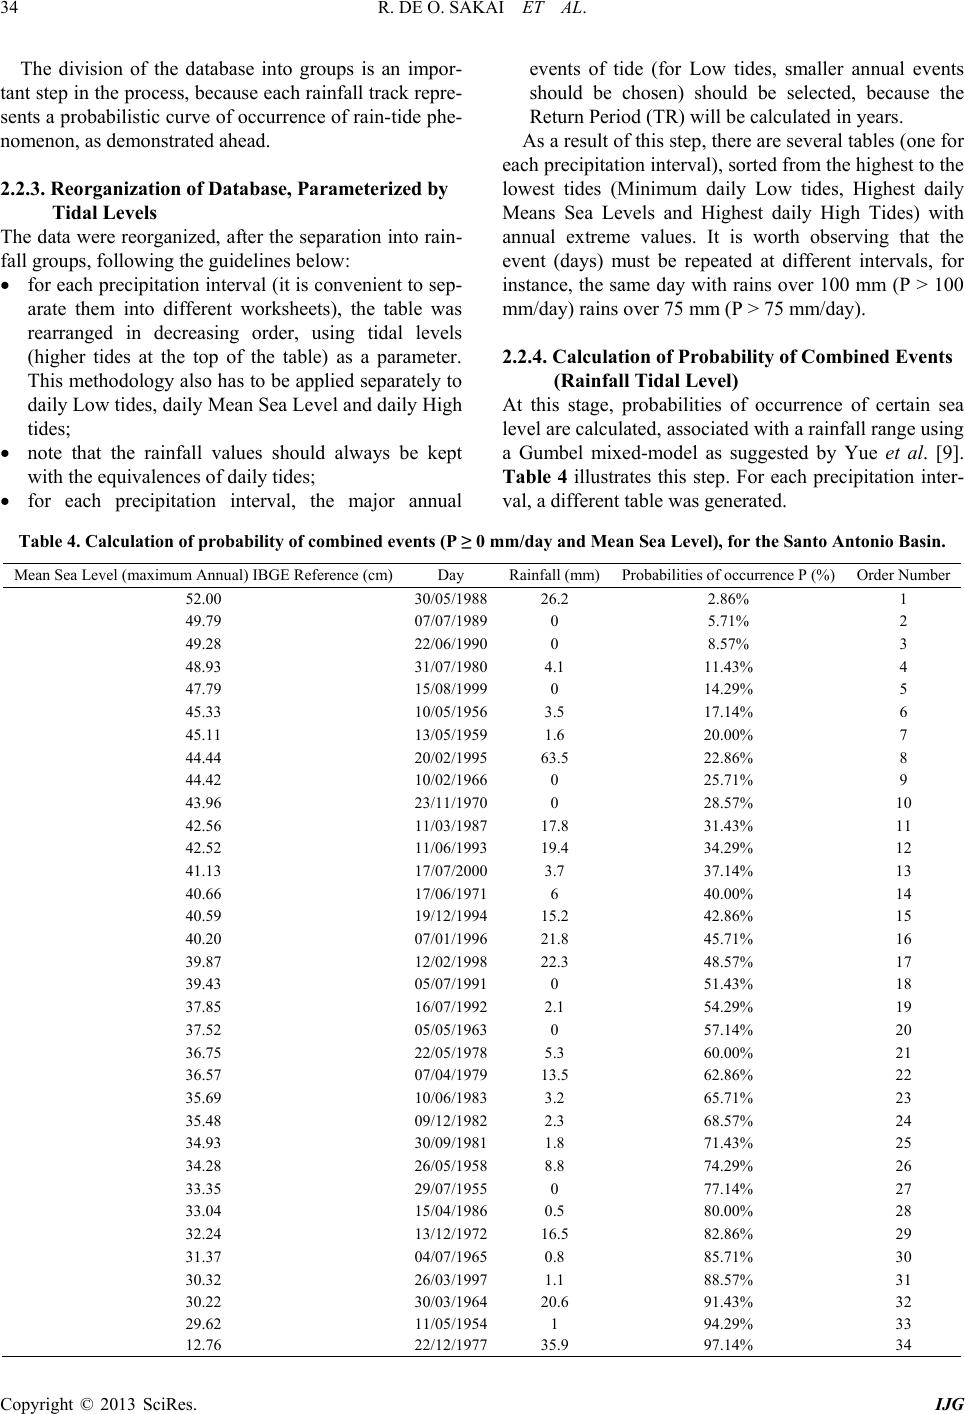 R. DE O. SAKAI ET AL. Copyright © 2013 SciRes. IJG The division of the database into groups is an impor- tant step in the process, because each rainfall track repre- sents a probabilistic curve of occurrence of rain-tide phe- nomenon, as demonstrated ahead. 2.2.3. Reorganization of Database, Parameterized by Tidal Levels The data were reorganized, after the separation into rain- fall gro up s , following t he guideline s be l ow: • for each precipitation interval (it is convenient to sep- arate them into different worksheets), the table was rearranged in decreasing order, using tidal levels (higher tides at the top of the table) as a parameter. This methodology also has to be applied separately to daily Low tides, daily Mean S ea Level and daily H igh tides; • note that the rainfall values should always be kept with the equivalences of daily tides; • for each precipitation interval, the major annual events of tide (for Low tides, smaller annual events should be chosen) should be selected, because the Return Period (TR) will be calculated in years. As a result of this step, there are several tables (one for each precipitation interval), sorted from the highest to the lowest tides (Minimum daily Low tides, Highest daily Means Sea Levels and Highest daily High Tides) with annual extreme values. It is worth observing that the event (days) must be repeated at different intervals, for instance, the same day with rains over 100 mm (P > 100 mm/day) rains over 75 mm (P > 75 mm/day). 2.2.4. C alc ul a t i on of Pro ba bi l i ty of Combined Events (Rainfa l l Tidal Level) At this stage, probabilities of occurrence of certain sea level are calculated, associated with a rainfall range using a Gumbel mixed-model as suggested by Yue et al. [9]. Table 4 illustrates this step. For each precipitation inter- val, a different table was generated. Table 4. Calculation of probability of combined events (P ≥ 0 mm/day and Mean Sea Level), for the Santo Antonio Basin. Mean Sea Level (maximum Annual) IBGE Reference (cm) Day Rainfall (mm) Probabilities of occurrence P (%) Order Nu mber 52.00 30/05/1988 26.2 2.86% 1 49.79 07/07/1989 0 5.71% 2 49.28 22/06/1990 0 8.57% 3 48.93 31/07/1980 4.1 11.43% 4 47.79 15/08/1999 0 14.29% 5 45.33 10/05/1956 3.5 17.14% 6 45.11 13/05/1959 1.6 20.00% 7 44.44 20/02/1995 63.5 22.86% 8 44.42 10/02/1966 0 25.71% 9 43.96 23/11/1970 0 28.57% 10 42.56 11/03/1987 17.8 31.43% 11 42.52 11/06/1993 19.4 34.29% 12 41.13 17/07/2000 3.7 37.14% 13 40.66 17/06/1971 6 40.00% 14 40.59 19/12/1994 15.2 42.86% 15 40.20 07/01/1996 21.8 45.71% 16 39.87 12/02/1998 22.3 48.57% 17 39.43 05/07/1991 0 51.43% 18 37.85 16/07/1992 2.1 54.29% 19 37.52 05/05/1963 0 57.14% 20 36.75 22/05/1978 5.3 60.00% 21 36.57 07/04/1979 13.5 62.86% 22 35.69 10/06/1983 3.2 65.71% 23 35.48 09/12/1982 2.3 68.57% 24 34.93 30/09/1981 1.8 71.43% 25 34.28 26/05/1958 8.8 74.29% 26 33.35 29/07/1955 0 77.14% 27 33.04 15/04/1986 0.5 80.00% 28 32.24 13/12/1972 16.5 82.86% 29 31.37 04/07/1965 0.8 85.71% 30 30.32 26/03/1997 1.1 88.57% 31 30.22 30/03/1964 20.6 91.43% 32 29.62 11/05/1954 1 94.29% 33 12.76 22/12/1977 35.9 97.14% 34 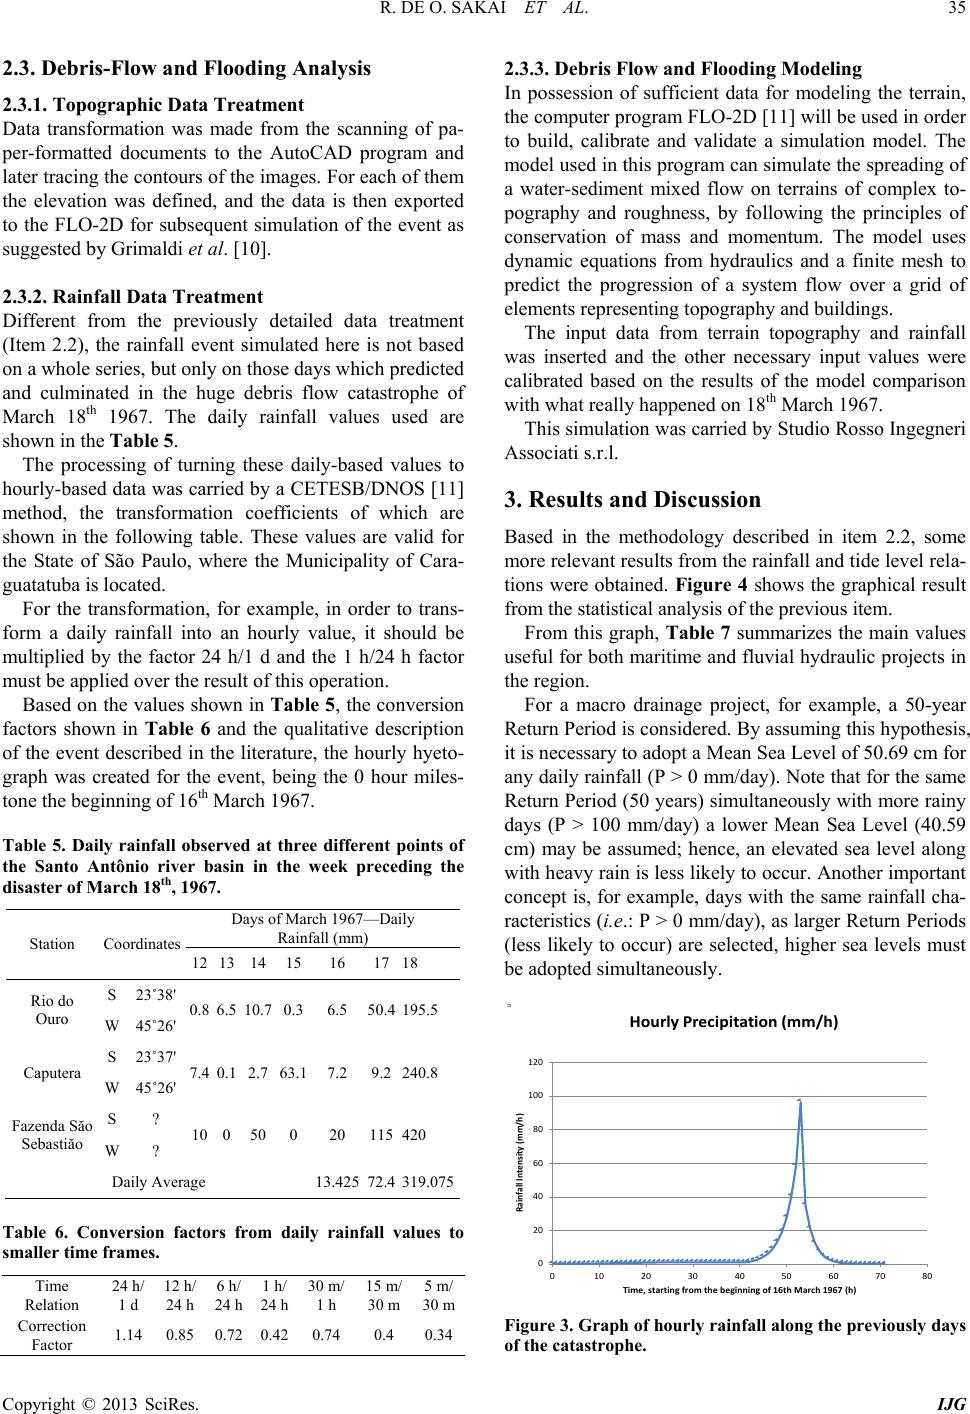 R. DE O. SAKAI ET AL. Copyright © 2013 SciRes. IJG 2.3. Debris-Flow and Flooding Analysis 2.3.1. T opographic D ata Treatment Data transformation was made from the scanning of pa- per-formatted documents to the AutoCAD program and later tracing the contours of the images. For each of them the elevation was defined, and the data is then exported to the FLO-2D for subsequent simulation of the event as suggested by Grimaldi et al. [10]. 2.3.2. Rainfall Data Treatment Different from the previously detailed data treatment (Item 2.2), the rainfall event simulated here is not based on a whole series, but only on thos e days which predicted and culminated in the huge debris flow catastrophe of March 18th 1967. The daily rainfall values used are shown in the Table 5. The processing of turning these daily-based values to hourly-based data was carried by a CETESB/DNOS [11] method, the transformation coefficients of which are shown in the following table. These values are valid for the State of São Paulo, where the Municipality of Cara- guatatuba is located. For the transformation, for example, in order to trans- form a daily rainfall into an hourly value, it should be multiplied by the factor 24 h/1 d and the 1 h/24 h factor must be applied over the result of this operation. Based on the values shown in Table 5, the conv ersion factors shown in Table 6 and the qualitative description of the event described in the literature, the hourly hyeto- graph was created for the event, being the 0 hour miles- tone the be ginning of 1 6th March 1967. Table 5. Daily rainfall observed at three different points of the Santo Antônio river basin in the week preceding the disaster of March 18th, 1967. Station Coordinates Rainfall (mm) 12 13 14 15 16 17 18 Rio do Ouro S 23˚38' 0.8 6.5 10.7 0.3 6.5 50.4 195.5 W 45˚26' Caputera S 23˚37' 7.4 0.1 2.7 63.1 7.2 9.2 240.8 W 45˚26' Fazenda Săo Sebastiăo S ? 10 0 50 0 20 115 420 W ? Daily Average 13.425 72.4 319.075 Table 6. Conversion factors from daily rainfall values to smaller time frames. Time Relation 24 h/ 1 d 12 h/ 24 h 6 h/ 24 h 1 h/ 24 h 30 m/ 1 h 15 m/ 30 m 5 m/ 30 m Correction Factor 1.14 0.85 0.72 0.42 0.74 0.4 0.34 2.3.3. Debri s Flow and Flooding Model i n g In possession of sufficient data for modeling the terrain, the computer program FLO-2D [11] will be used in order to build, calibrate and validate a simulation model. The model used in this program can simulate the spreading of a water-sediment mixed flow on terrains of complex to- pography and roughness, by following the principles of conservation of mass and momentum. The model uses dynamic equations from hydraulics and a finite mesh to predict the progression of a system flow over a grid of elements representing topography and buildings. The input data from terrain topography and rainfall was inserted and the other necessary input values were calibrated based on the results of the model comparison with what re a l ly happened on 18th March 1967. This simulation was carried by Studio Rosso Ingegneri Associati s.r.l. 3. Results and Discussion Based in the methodology described in item 2.2, some more relevant results from the rainfall and tide level rela- tions were obtained. Figure 4 shows the graphical result from the statistical analysis of the previou s item. From this graph, Table 7 summarizes the main values useful for both maritime and fluvial hydraulic projects in the region. For a macro drainage project, for example, a 50-year Return Period is considered. By assuming this hypothesis, it is necessary to adopt a Mean Se a L ev e l of 50.69 cm for any daily rainfall (P > 0 mm/day). Note that for the same Return Period (50 years) simultaneou sly with more rainy days (P > 100 mm/day) a lower Mean Sea Level (40.59 cm) may be assumed; hence, an elevated sea level along with heavy rain is less likely to occur. Another important concept is, for example, days with the same rainfall cha- racteristics (i.e.: P > 0 mm/day), as larger Return Periods (less likely to occur) are selected, higher sea levels must be adopted simultaneously. Figure 3. Graph of hourly rainfall along the previously days of the catastrophe. 0 20 40 60 80 100 120 010 20 30 40 50 60 70 80 Rainfall Intensity (mm/h) Time, starting from the beginning of 16th March 1967 (h) Hourly Precipitation (mm/h) 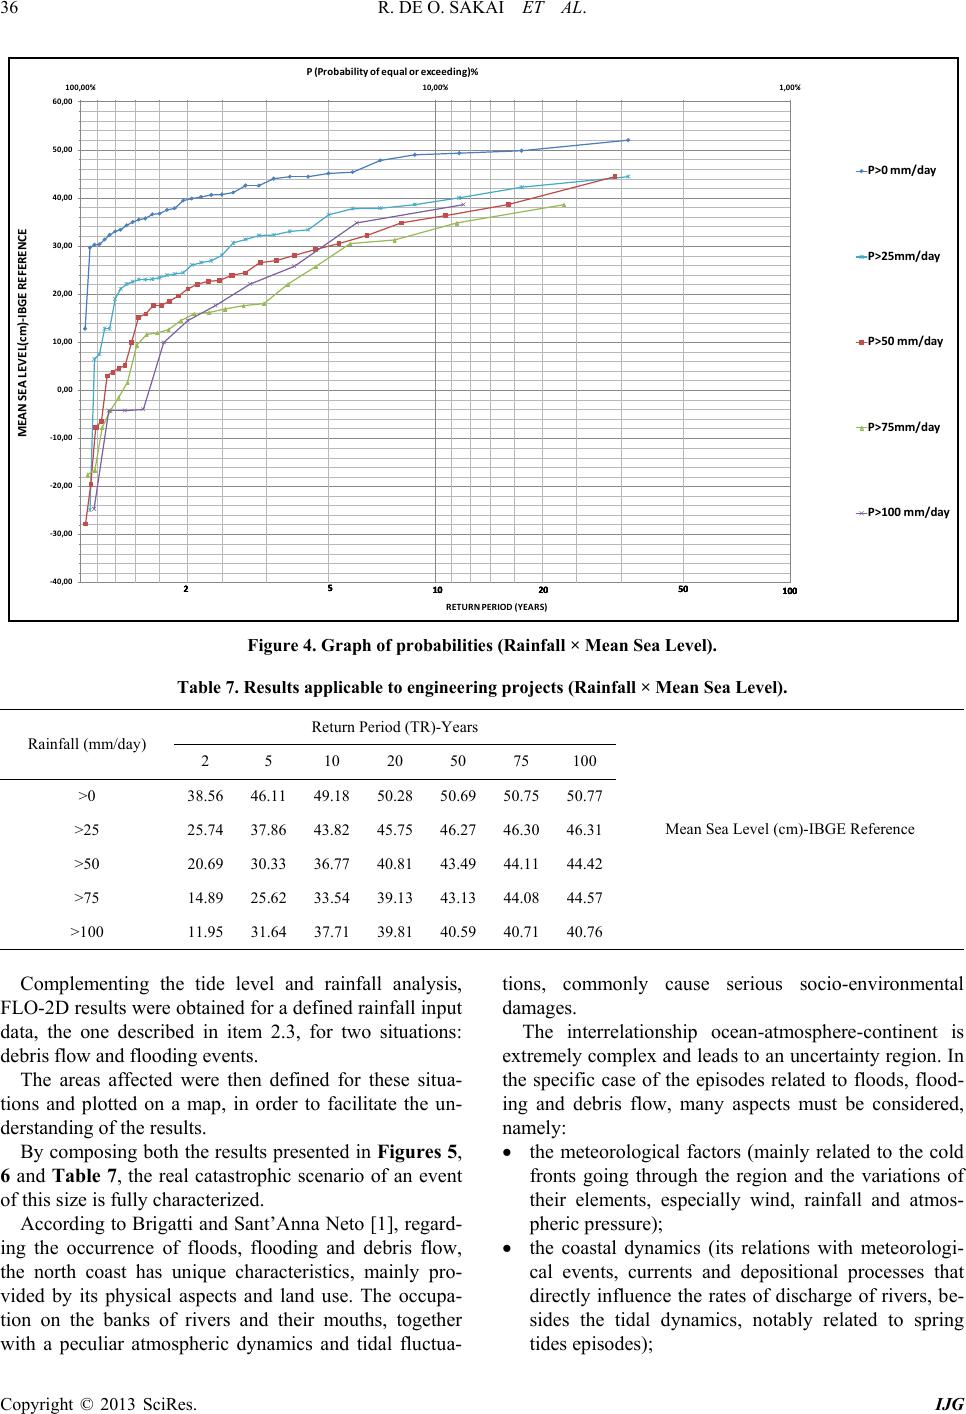 R. DE O. SAKAI ET AL. Copyright © 2013 SciRes. IJG Figure 4. Graph of probabilities (Rainfall × Mean Sea Level). Table 7. Results applicable to engineering projects (Rainfall × Mean Sea Level). Rainfall (mm/day) Return Period (TR)-Years Mean Sea Level (cm)-IBGE Reference 2 5 10 20 50 75 100 >0 38.56 46.11 49.18 50.28 50.69 50.75 50.77 >25 25.74 37.86 43.82 45.75 46.27 46.30 46.31 >50 20.69 30.33 36.77 40.81 43.49 44.11 44.42 >75 14.89 25.62 33.54 39.13 43.13 44.08 44.57 >100 11.95 31.64 37.71 39.81 40.59 40.71 40.76 Complementing the tide level and rainfall analysis, FLO-2D results were obtained for a defined rainfall input data, the one described in item 2.3, for two situations: debris flow and flooding events. The areas affected were then defined for these situa- tions and plotted on a map, in order to facilitate the un- derstanding of the results. By composing both the results presented in Figures 5, 6 and Table 7, the real catastrophic scenario of an event of this size is fully characterized. According to Briga tti and Sant’Anna Neto [1], regard- ing the occurrence of floods, flooding and debris flow, the north coast has unique characteristics, mainly pro- vided by its physical aspects and land use. The occupa- tion on the banks of rivers and their mouths, together with a peculiar atmospheric dynamics and tidal fluctua- tions, commonly cause serious socio-environmental damages. The interrelationship ocean-atmosphere-continent is extremely complex and leads to an unc ertainty region . In the specific case of the episodes related to floods, flood- ing and debris flow, many aspects must be considered, namely: • the meteorological factors (mainly related to the cold fronts going through the region and the variations of their elements, especially wind, rainfall and atmos- pheric press ure); • the coastal dynamics (its relations with meteorologi- cal events, currents and depositional processes that directly influence the rates of discharge of rivers, be- sides the tidal dynamics, notably related to spring tides episodes); -40,00 -30,00 -20,00 -10,00 0,00 10,00 20,00 30,00 40,00 50,00 60,00 1,00%10,00%100,00% MEAN SEA LEVEL(cm)-IBGE REFERENCE P (Probability of equal or exceeding)% 10 20 50 2100 510 20 50 2100 510 20 50 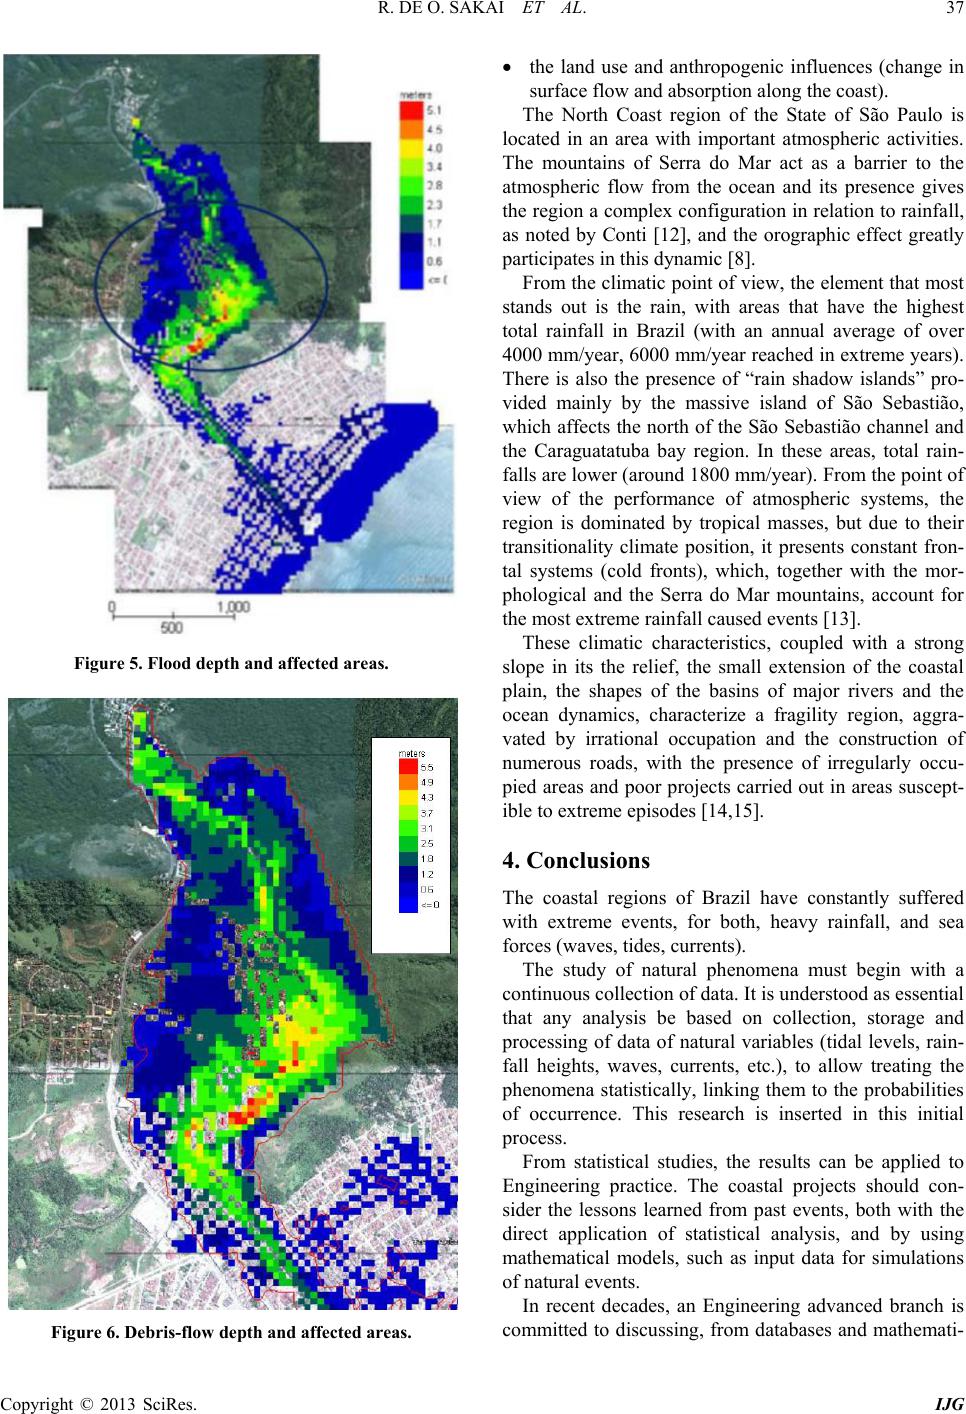 R. DE O. SAKAI ET AL. Copyright © 2013 SciRes. IJG Figure 5. Flood depth and affected areas. Figure 6. Debris-flow depth and affected areas. • the land use and anthropogenic influences (change in surface flow and absorption along the coast). The North Coast region of the State of São Paulo is located in an area with important atmospheric activities. The mountains of Serra do Mar act as a barrier to the atmospheric flow from the ocean and its presence gives the region a complex configuration in relation to rainfall, as noted by Conti [12], and the orographic effect greatly participates in this dynamic [8]. From the climatic point of view, the element that most stands out is the rain, with areas that have the highest total rainfall in Brazil (with an annual average of over 4000 mm/year, 6000 mm/year reached in extreme years). There is also the presence of “rain shadow islands” pro- vided mainly by the massive island of São Sebastião, which affects the north of the São Sebastião channel and the Caraguatatuba bay region. In these areas, total rain- falls are low er ( around 18 00 mm/year). From the point of view of the performance of atmospheric systems, the region is dominated by tropical masses, but due to their transitionality climate position, it presents constant fron- tal systems (cold fronts), which, together with the mor- phological and the Serra do Mar mountains, account for the most extreme rainfall caused events [13]. These climatic characteristics, coupled with a strong slope in its the relief, the small extension of the coastal plain, the shapes of the basins of major rivers and the ocean dynamics, characterize a fragility region, aggra- vated by irrational occupation and the construction of numerous roads, with the presence of irregularly occu- pied areas and poor projects carried out in areas suscept- ible to extreme episodes [14,15]. 4. Conclusions The coastal regions of Brazil have constantly suffered with extreme events, for both, heavy rainfall, and sea forces (wave s, tides, curre nt s). The study of natural phenomena must begin with a continuous collection of data. It is understood as essential that any analysis be based on collection, storage and processing of data of natural variables (tidal levels, rain- fall heights, waves, currents, etc.), to allow treating the phenomena statistically, linking them to the probabilities of occurrence. This research is inserted in this initial process. From statistical studies, the results can be applied to Engineering practice. The coastal projects should con- sider the lessons learned from past events, both with the direct application of statistical analysis, and by using mathematical models, such as input data for simulations of natural events. In recent decades, an Engineering advanced branch is committed to discussing, from databases and mathemati-  R. DE O. SAKAI ET AL. Copyright © 2013 SciRes. IJG cal models, whether the projects already built will be affected by climate change, such as the increase of the Mean Sea Level, more frequent heavy rainfall and debris flow events that destroy cities in the coastal floodplain. Therefore, repair works will become increasingly more frequent in these regions. 5. Acknowledgements This paper was suppor ted by Redelitor al, with the proj ect described in [16], funded by CAPES (Coordination for the Improvement of Higher Education Personnel). The authors would also like to thank Promon Engenharia that encourages its employees to participate in academic re- search and Studio Rosso Ingegneri Associati s.r.l., which provided support in the FLO-2D simulation. REFERENCES [1] N. Brigatti and J. Sant´Anna Neto , “Dinâmica Climática e Variações do Nível do mar na Geração de Enchentes, Inundações e Ressacas no Litoral Norte Paulista,” Revista Formação-Especial, Vol. 2, No. 15, 2008, pp. 25-36. [2] D. A. Jones, “Joint probability Fluvial-Tidal Analyses: Structure Functions and Historical Emulation,” Institute of Hydrology—Wallingford & Ministry of Agriculture, Fisheries and Food and the Natural Environment, Project FD04017, 1998. [3] K. L. McInnes, I. Macadam, G. D. Hubbert, D. J. Abbs and J. Bathols, “The Effect of the Climate Change on Storm Surges,” In: Climate Change in Eastern Victoria, Stage, 2nd Edition, CSIRO, 2005. [4] L. W. White, “Tidal and Rainfall Flooding Evaluation for Cape Henry, Cape Story,” Parsons & Brinckerhoff, Vri- gina, 2010. [5] J. J. Lian, K. Xu and C. Ma, “Joitn Impact of Rainfall and Tidal Level on Flood Risk in a Coastal City with a Com- plex River Network: A Case Study of Fuzhou City, Chi- na,” Hydrology and Earth System Sciences, Vol. 17, 2013, pp. 679-689. http://dx.doi.org/10.5194/hess-17-679-2013 [6] Hidroconsult, “Análise Probabilística de Ocorrência Con- jugada de Eventos Máximos Chuva-Maré,” Estudo Reali- zado para SOMA Secretaria de Obras e do Meio Am- biente, DAEE, Departamento Estadual de Águas e Ener- gia, São Pa ulo , 1979. [7] ANA-Agência Nacional de Aguas, 2005. http://hidroweb.ana.gov.br/ [8] O. Cruz, “A Serra do Mar e o Litoral na Área de Cara- guatatuba-SP—Contribuição à Geomorfologia Litorânea Tropical. São Paulo,” Faculdade de Filosofia, Letras e Ciências Humanas da Universidade de São Paulo (FFL- CH-USP). Department de Geografia (FLG), 1974. [9] S. Yue, T. Ouarda, B. Bobée, P. Legendre and P. Bruneau, “The Gumble Mixed Model for Flood Frequency Analy- sis,” Journal of Hydrology, Vol. 226, 1999, pp. 88-100. http://dx.doi.org/10.1016/S0022-1694(99)00168-7 [10] S. Grimaldi, A. Petroselli, E. Arcangeletti and F. Nardi, “Flood Mapping in Ungauged Basins Using Fully Conti- nuous Hydrologic-Hydraulic Modeling,” Journal of Hy- drology, Vol. 487, 2013, pp. 39-47. http://dx.doi.org/10.1016/j.jhydrol.2013.02.023 [11] J. S. O’Brien, “FLO-2D: 2 Dimensional Flood Routing Model Software; Flood Hazard Mitigation and Planning,” Federal Emergency Manage men t Agency, Nutrioso, 1989. [12] J. B. Conti, “Circulação Secundária e Efeito Orográfico na Gênese das Chuvas na Região Lesnordeste Paulista,” IGEOG/USP, Sã o Paulo, 1975. [13] R. Tavares, J. L. Sant´Anna Neto and J. Santoro, “Chuvas e Escorregamentos no Litoral Norte Paulista Entre 1988 e 2001,” Anai s do Encontro de Geógrafos Brasileiros, Joao Pessoa, 2002. [14] C. Souza, “Flooding in the São Sebastião Region, North- ern Coast of São Paulo State, Brazil,” Anai s da Academia Brasileira de Ciências, São Paulo, 1998, pp. 353-366. [15] V. J. Fúlfaro, et al., “Escorregamentos de Caraguatatuba: Expressão Atual e Registro na Coluna Sedimentar da Pl a- nície Costeira Adjacente,” Congresso Brasileiro de Geo- logia de Engenharia, Vol. 2, 1976, pp. 341-350. [16] ITA, “Mudanças Climáticas Globais e Impactos na Zona Costeira: Modelos, Indicadore s, Obras civis e Fatores de Mitigação/Adaptação,” São José dos Campos, 2009.
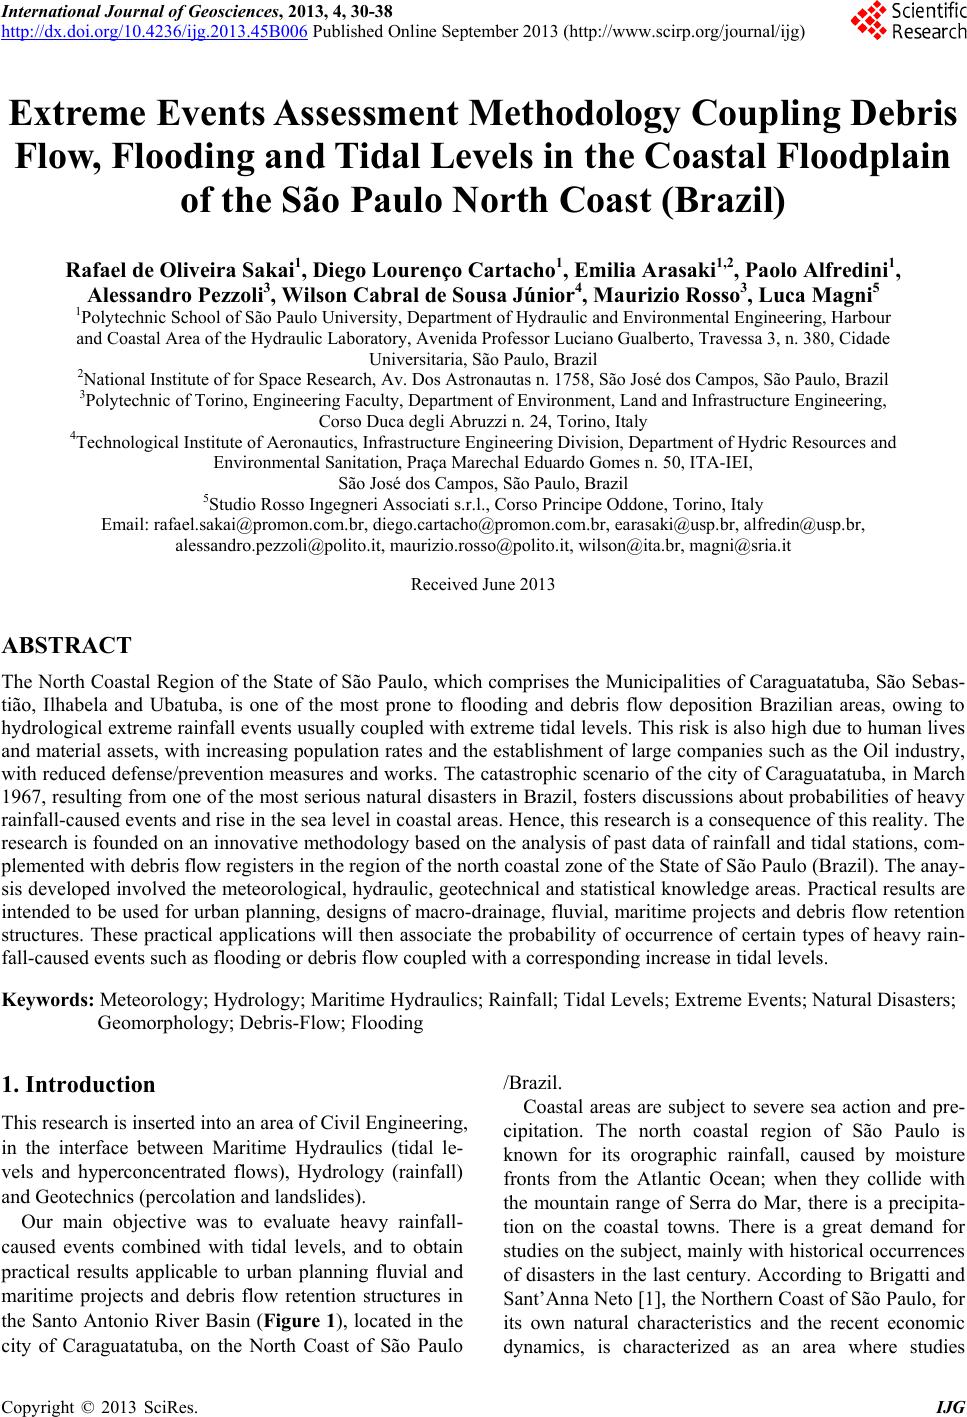
|