P. SRIYASAK ET AL.
Copyright © 2013 SciRes. IJG
winter. For the rainy season, the water turnover occurred
during daylight at 14.00 and 18.00 p.m. Due to heavy
rain during that time the water on the floor mixed with
water then sinking with lower water in the rain (Figure
2). Apparently, isothermal condition and full turnover for
both seasons at higher elevation also occurred at around
6:00 which is similar in lower elevation sites.
3.3. Water Quality in Ponds in Different Seasons
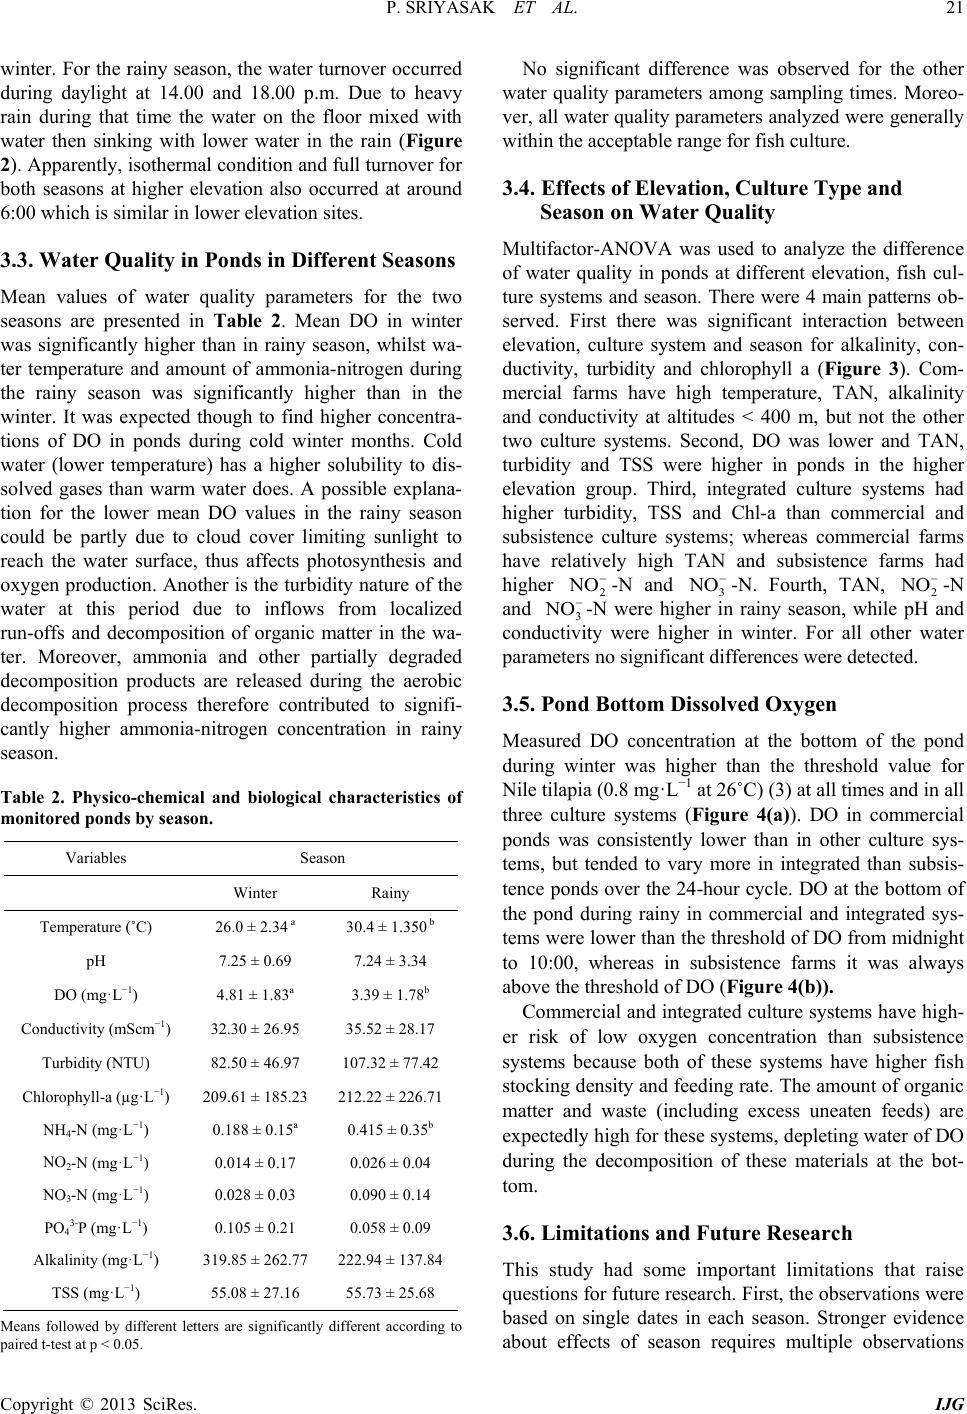
Mean values of water quality parameters for the two
seasons are presented in Table 2. Mean DO in winter
was significantly higher than in rainy season, whilst wa-
ter temperature and amount of ammonia-nitrogen during
the rainy season was significantly higher than in the
winter. It was expected though to find higher concentra-
tions of DO in ponds during cold winter months. Cold
water (lower temperature) has a higher solubility to dis-
solved gases than warm water does. A possible explana-
tion for the lower mean DO values in the rainy season
could be partly due to cloud cover limiting sunlight to
reach the water surface, thus affects photosynthesis and
oxygen production. Another is the turbidity nature of the
water at this period due to inflows from localized
run-offs and decomposition of organic matter in the wa-
ter. Moreover, ammonia and other partially degraded
decomposition products are released during the aerobic
decomposition process therefore contributed to signifi-
cantly higher ammonia-nitrogen concentration in rainy
season.
Table 2. Physico-chemical and biological characteristics of
monitored ponds by season.
Variables Season
Winter Rainy
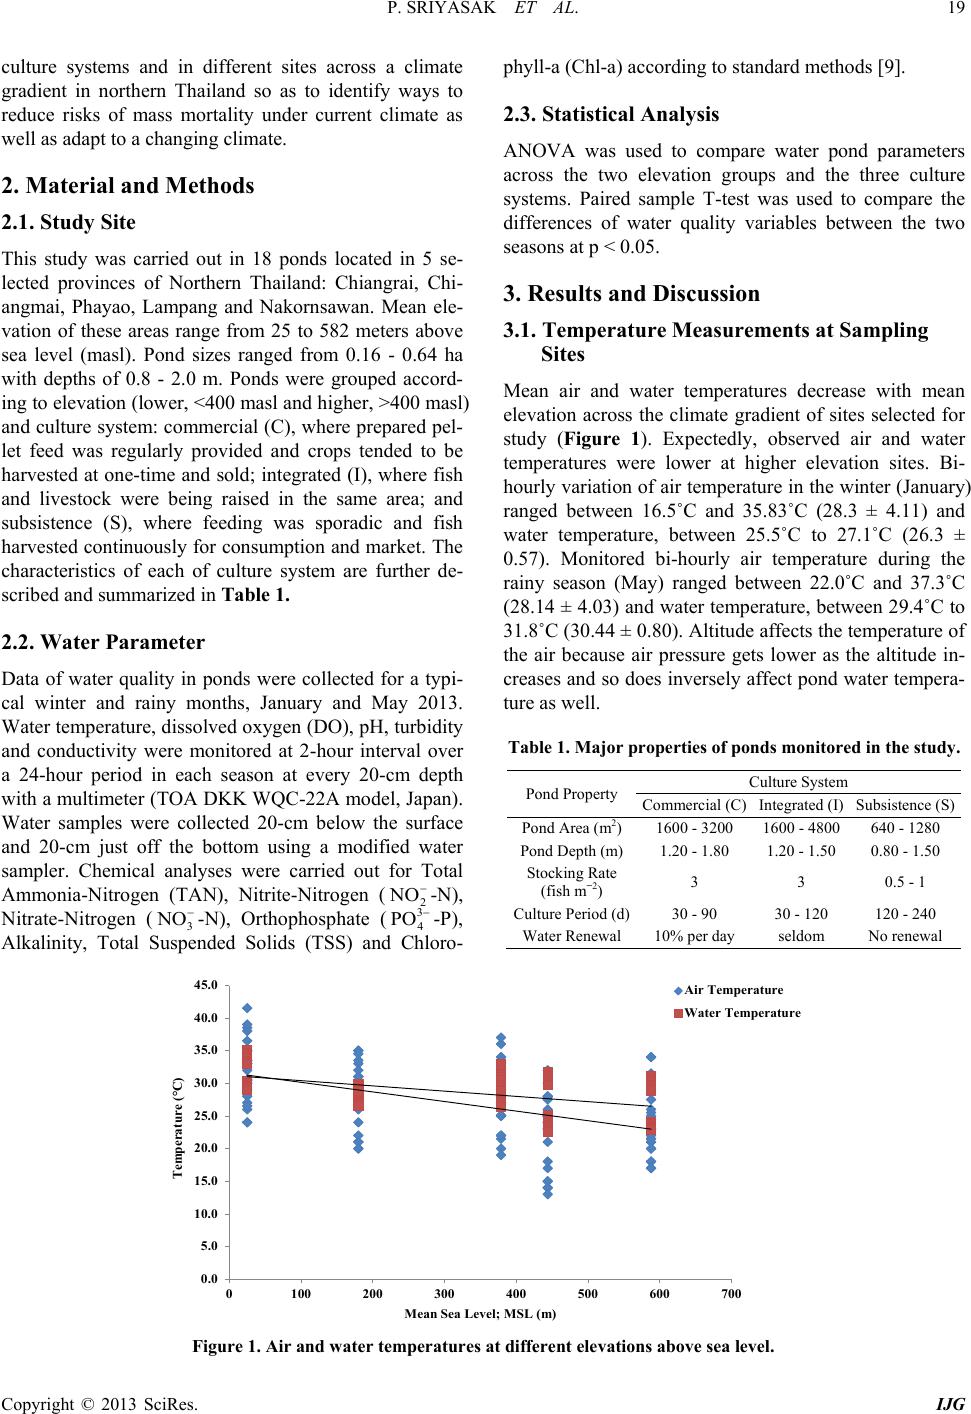
Temperature (˚C) 26.0 ± 2.34 a 30.4 ± 1.350 b
pH 7.25 ± 0.69 7.24 ± 3.34
DO (mg·L−1) 4.81 ± 1.83a 3.39 ± 1.78b
Conductivity (mScm−1) 32.30 ± 26.95 35.52 ± 28.17
Turbidity (NTU) 82.50 ± 46.97 107.32 ± 77.42
Chlorophyll-a (µg·L−1) 209.61 ± 185.23 212.22 ± 226.71
NH4-N (mg· L−1) 0.188 ± 0.15a 0.415 ± 0.35b
NO2-N (mg· L −1) 0.014 ± 0.17 0.026 ± 0.04
NO3-N (mg·L−1) 0.028 ± 0.03 0.090 ± 0.14
PO43-P (mg· L −1) 0.105 ± 0.21 0.058 ± 0.09
Alkalinity (mg·L−1) 319.85 ± 262.77 222.94 ± 137.84
TSS (mg·L−1) 55.08 ± 27.16 55.73 ± 25.68
Means followed by different letters are significantly different according to
paired t-test at p < 0.05.
No significant difference was observed for the other
water quality parameters among sampling times. Moreo-
ver, all water quality parameters analyzed were generally
within the acceptable range for fish culture.
3.4. Effects of Elevation, Culture Type and
Season on Water Quality
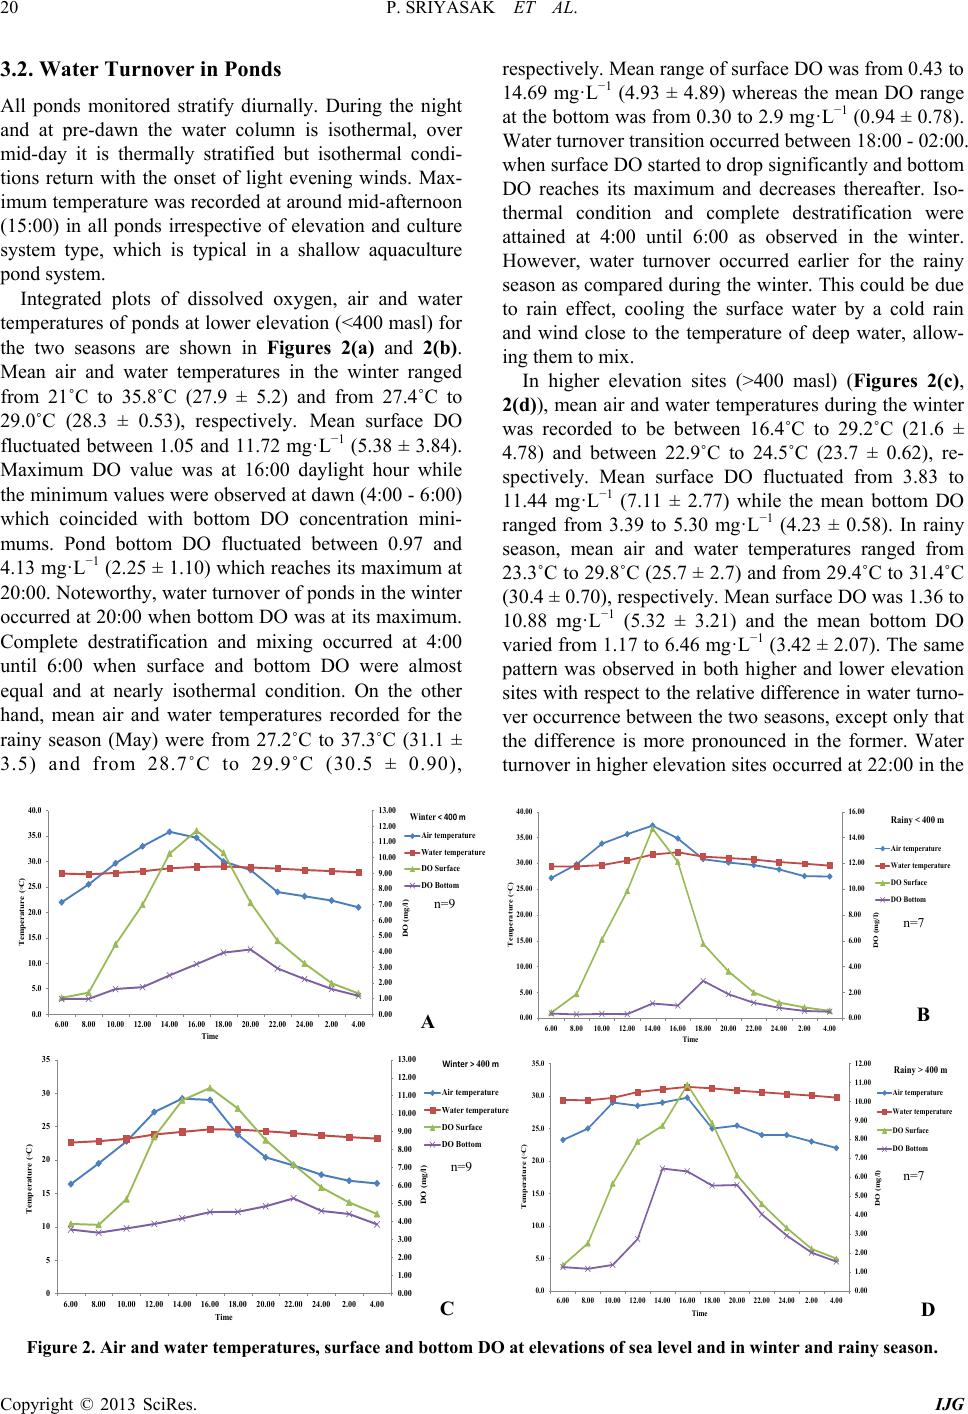
Multifactor-ANOVA was used to analyze the difference
of water quality in ponds at different elevation, fish cul-
ture systems and season. There were 4 main patterns ob-
served. First there was significant interaction between
elevation, culture system and season for alkalinity, con-
ductivity, turbidity and chlorophyll a (Figure 3). Com-
mercial farms have high temperature, TAN, alkalinity
and conductivity at altitudes < 400 m, but not the other
two culture systems. Second, DO was lower and TAN,
turbidity and TSS were higher in ponds in the higher
elevation group. Third, integrated culture systems had
higher turbidity, TSS and Chl-a than commercial and
subsistence culture systems; whereas commercial farms
have relatively high TAN and subsistence farms had
higher
-N and
-N. Fourth, TAN,
-N
and
-N were higher in rainy season, while pH and
conductivity were higher in winter. For all other water
parameters no significant differences were detected.
3.5. Pond Bottom Dissolved Oxygen
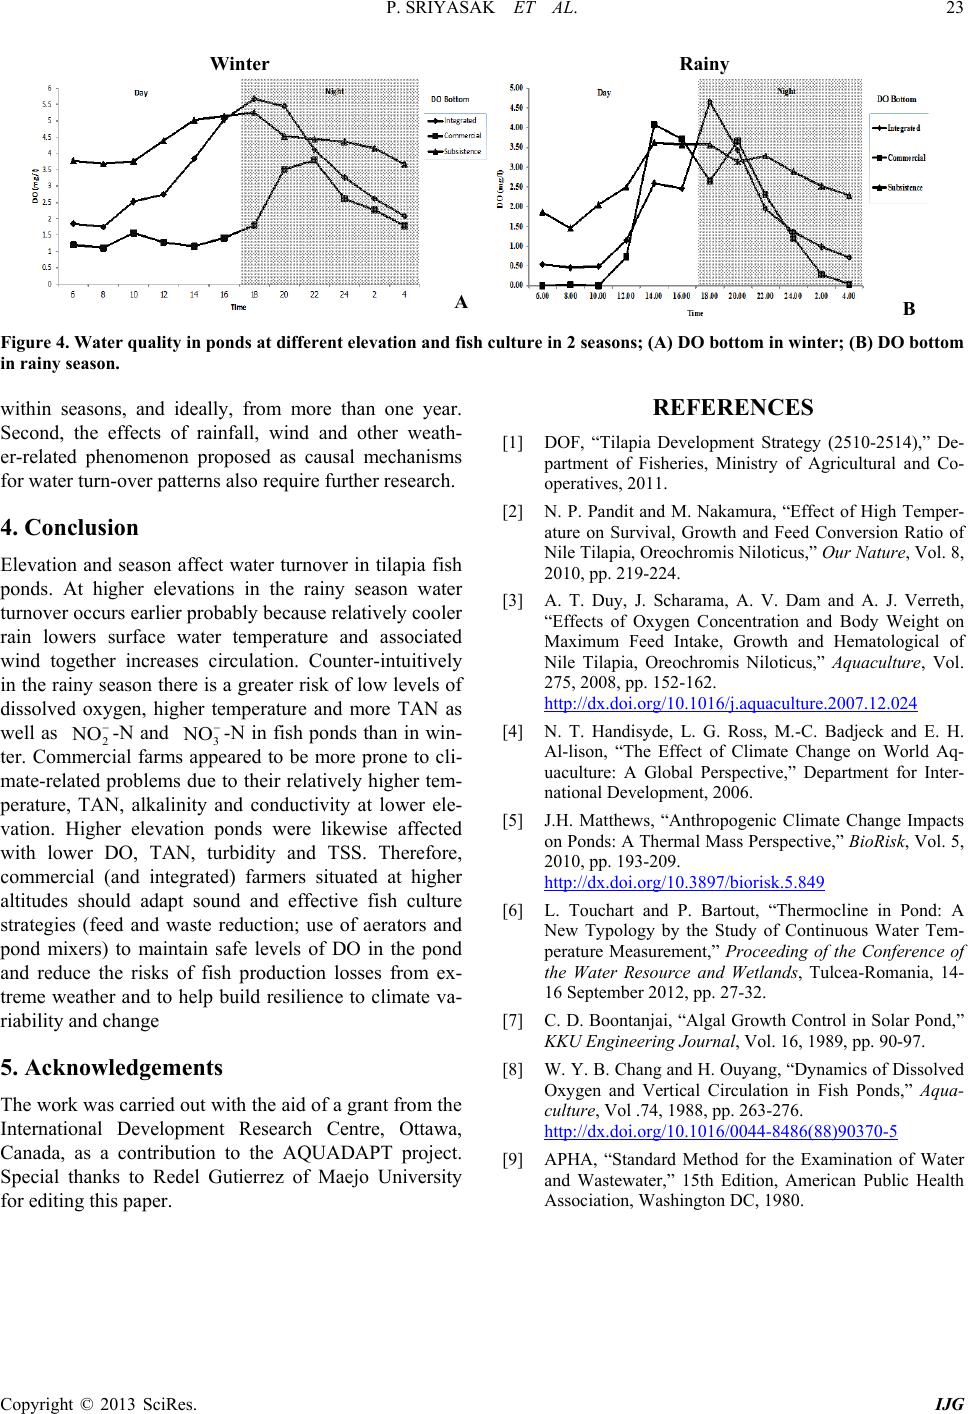
Measured DO concentration at the bottom of the pond
during winter was higher than the threshold value for
Nile tilapia (0.8 mg·L−1 at 26˚C) (3) at all times and in all
three culture systems (Figure 4(a)). DO in commercial
ponds was consistently lower than in other culture sys-
tems, but tended to vary more in integrated than subsis-
tence ponds over the 24-hour cycle. DO at the bottom of
the pond during rainy in commercial and integrated sys-
tems were lower than the threshold of DO from midnight
to 10:00, whereas in subsistence farms it was always
above the threshold of DO (Figure 4(b)).
Commercial and integrated culture systems have high-
er risk of low oxygen concentration than subsistence
systems because both of these systems have higher fish
stocking density and feeding rate. The amount of organic
matter and waste (including excess uneaten feeds) are
expectedly high for these systems, depleting water of DO
during the decomposition of these materials at the bot-
tom.
3.6. Limitations and Future Research
This study had some important limitations that raise
questions for future research. First, the observations were
based on single dates in each season. Stronger evidence
about effects of season requires multiple observations