 International Journal of Geosciences, 2013, 4, 1-7 http://dx.doi.org/10.4236/ijg.2013.45B001 Published Online September 2013 (http://www.scirp.org/journal/ijg) Copyright © 2013 SciRes. IJG Experimental Study of Invasion and Biofouling of Freshwater Mussel Limnoperna fortunei Mengzhen Xu1, Zhaoyin Wang1, Cheng Chieh Lin2, Baozhu Pan3, Na Zhao1 1State Key Laboratory of Hydroscience and Engineering, Tsinghua University, Beijing, China 2Program in Civil and Hydraulic Engineering, Feng Chia University, Taiwan, China 3Changjiang River Scientific Research Institute, Wuhan, China Email: xumz07@gmail.com Received May 2013 ABSTRACT Golden mussel Limnoperna fortunei (Dunker 1857) is a filter-collector species of fresh water mussel originating from southern China. In the water transfer tunnels from the East River to Shenzhen and Hong Kong, golden mussels attach to the walls of pipelines and gates, causing serious biofouling, increased flow resistance, and resulted in corrosion of the tunnel wall. Golden mussel has very high environmental adaptability and may colonize habitats with low dissolved oxygen and a wide range of trophic levels. The colonization process of the species on solid surface was studied in the Xizhijiang River, a tributary of the East River and the main water resource of Shenzh en from March 2010 to April 2011. The results showed that the golden mussel completed three generations and reproduced six cohor ts per year in the tropic zone. Water temperature was the controlling factor for the growth rate and maturity of each cohort. Based on the results, an ecological method for controlling the invasion of golden mussels in water transfer tunnels was proposed. Keywords: Bi ofouling of Water Transfer Tunnel s ; Golden Mus s e l (Limnoperna fortunei); Reproduction; Invasion Control 1. Introduction Inter-basin water transfer projects have been widely used to ease uneven distribution and shortage of water re- source in China. However, biological invasion and bio- fouling caused by golden mussel (Limnoperna fortunei) has become a challenge to these projects. The golden mussel is a native freshwater species of southeast China. It shares invasive biological and ecological features such as size, growth speed, and colonization on hard substrata by strong byssuses with the North American invasive pest zebra mussel [1]. Recently, the golden mussel has been observed in waters in Beijing [2 ]. Nevertheless, it has also invaded in aquatic ecosystems and hydraulic structures in South America and other Asian countries ([3,4]). Golden mussel invasion in a new habitat causes ecological imbalance owing to changes in fishes’ feeding habits and macroinvertebrate composition [5]. Golden mussel invasion and biofouling in water trans- fer tunnels, pipelines, and pumps have caused damages in water transfer projects. The biofouling density of golden mussel reaches as high as 50,000 ind./m2. The thickness of golden mussel clusters may exceed 10 cm on pipe walls, valves, gates, and other structures, thus results in concrete wall corrosion and high flow resistance [2]. Golden mus- sels consume a significant amount of dissolved oxygen due to their respiration and metabolism, causing water quality degradation in water transfer tunnels [3]. Clog- ging of pipes by high density of golden mussels caused shutdown of a hydra ulic power plant in J a pa n [6]. Invas ion and biofouling of golden mussels also damaged several most i mpor ta nt nuc lea r po wer pla nts in So uth Amer ica [3]. Controlling of golden mussel biofouling has been stu- died for decades. Various chemical and physical meas- ures of getting rid of golden mussels such as coating pipe walls, poisoning with pesticide, spraying with hot water, trapping with filters, ultr aviolet irradiation, washing with high velocity flow artificial removal with scrapers have been employed [7]. However, such measures can them- selves contribute to water pollution or high cost or dam- age of structures for practical application. It is found that prevention of golden mussel invasion is the only effec- tive and environmental-friendly way to control the bio- fouling [8]. Therefore, it is essential to study golden mussels’ invasion pattern and intensive invasion season, which are related to their reproduction characters for controlling their invasion and biofouling in this paper. 2. Study Methods 2.1. Experimental Arrangement The experiment was conducted at the Xizhijiang River, a  M. Z. XU ET AL. Copyright © 2013 SciRes. IJG secondary tributary of Pearl River in South China from March 2010 to April 2011. The Xizhijiang River is a water resource of the water transfer projects in Shenzhen and Hongkong, China, which suffered serious golden mussel invasion. The annual precipitation in the river basin varies from 1,500 to 2,400 mm, and the air temper- ature varies in 5˚C - 35˚C with an annual average of 21.5˚C. Figure 1 shows the experimental materials. Three cages were fixed on one bamboo, which is popular habi- tat material for golden mussels [9] , and the bamboo was planted into the river bed. The water depth of the three cages was 1 m, 2.5 m, and 4 m, respectively. Three regu- lar bricks (6 cm × 24 cm × 0.8 cm) were fixed in each cage. The cages were used for protecting the colonized golden mussels from being preyed by fish [10]. Th e cag- es, the bamboo, and the bricks in the cages provided new habitats for golden mussels to colonize. In the experiment, a total of 42 cages on 14 bamboos were fixed in the river water, of which 9 bamboos with 27 cages were planted into the river bed on March 13, 2010, and the other 5 bamboos with 15 cages were suc- cessively planted into the river bed in July, August, Sep- tember, October, and November in 2010. The new habi- tats were colonized by golden mussels, as expected. One month after the start of the experiment, the first bamboo with cages was taken out and colonies of golden mussels on the bricks were analyzed. From then on, the bamboos with cages were taken out successively at one month Figure 1. Experimental materials-bamboos with cages and bricks were planted into the river bed. interval over 9 months. Therefore, the results with colo- nization time from 1 month to 9 months were obtained. Additionally, data from the other 5 bamboos that were given 5 months of colonization time but with different start seasons were obtained for comparison. The density, shell length, and distribution of golden mussels were measured. During the experiment, density of golden mussel larvae in the river water was measured once a week. Water temperature (WT) and dissolved oxygen (DO) levels were measured at the experiment site. 2.2. Data Analysis For different colonization times, the colonized golden mussels at the water depth of 2.5 m were used for cohort decomposition using modal progression analysis in Fi- SAT II (FAO-ICLARM Fish Stock Assessment Tools, Version 1.2.2), a software program that decomposes the length-frequency distributions into their unimodal com- ponents by using Bhattacharya’s method [11]. The gol- den mussels were grouped according to their shell length into 0 - 1 mm, 1 - 2 mm, 2 - 3 mm, and so on up to 24 - 25 mm groups. The length-frequency data of all groups were analyzed by means of modal progression analysis (MPA) in FiSAT II, in which frequency is the number of golden mussels found in each shell length group. Age was assigned to each component according to the modal progression analysis method [12], assuming that each progression of the component represents a cohort. In this manner, all of the cohorts were distinguished. 3. Results and Discussion 3.1. Colonization Density of Golden Mussels Table 1 lists the experimental results. The maximum shell length Lmax increased s lowly in the first two months, and very fast in the third, fourth, and fifth months, and slowly again from then on. The minimum shell length Lmin was 0.28 mm, which was regarded as the smallest mussel that can attach to solid surfaces with byssuses. Figure 2 shows the densities of the golden mussel co- lonized at water depths of 1 m, 2.5 m, and 4 m as a func- tion of colonization time. The golden mussel density was different for different water depths and colonization time. The density was high at water depths of 1 m to 2.5 m, and slightly lower at water depth of 4 m. The dashed curve represents the average density of golden mussels at different water depths. The density was nearly zero in the first two months and increased sharply from the third month, resulting in three peaks of density in May (third month), July (fifth month), and October (eighth month). In general, the golden mussel prefers a surface with algae (Frances 2006). In our experiment, a layer of algae was detected on the brick surfaces after two months. 150 bed surface 150 water surface 9010 50 100 80  M. Z. XU ET AL. Copyright © 2013 SciRes. IJG Table 1. Results of the new habitat colonization experiment. No. Start time End time t (month) Colonization on bricks at water depth of 2.5 m D (ind./m2) Lmax (mm) Lmin (mm) Lave (mm) 1# 2010/3/13 2010/4/14 1 12 2.27 2.27 2.27 2# 2010/3/13 2010/5/14 2 12 3.23 3.23 3.23 3# 2010/3/13 2010/6/17 3 6620 11.46 0.28 3.46 4# 2010/3/13 2010/7/15 4 17593 13.25 0.78 5.22 5# 2010/3/13 2010/8/15 5 35370 16.32 1.29 7.38 6# 2010/3/13 2010/9/15 6 35069 17.74 1.79 8.49 7# 2010/3/13 2010/10/12 7 17824 20.77 1.11 9.97 8# 2010/3/13 2010/11/16 8 32593 21.96 0.99 9.37 9# 2010/3/13 2010/12/14 9 23264 22.22 0.76 10.90 10# 2010/8/15 2011/1/14 5 15677 18.1 0.75 4.93 11# 2010/9/15 2011/2/15 5 1736 13.42 0.76 4.05 12# 2010/10/12 2011/3/14 5 2523 14.12 1.04 4.53 13# 2010/11/16 2011/4/14 5 4444 14.56 1.17 4.15 Note: △t—colonization time ; D—the colonized density of golden mussels; Lmax, Lmin and Lave—the maxim um, minimum and average shel l lengths, respectively. Figure 2. Density of golden mussels as a function of coloni- zation time. Therefore, very few golden mussels colonized the new habitats in the first two months. Once golden mussels colonized on the bricks, the colonization density varied along the water depth due to variation in water tempera- ture and dissolved oxygen concentration [13]. The gol- den mussel larvae prefer water temperature in the range of 16-28 resulting in high colonization density of golden mussels in such temperatures; the minimum DO con cen- tration for survival of golden mussels is 1.0 mg/L [14]. Figure 3 shows the representative DO concentration and water temperature along water depth in different seasons in the experiment. The DO concentration was higher than the minimum threshold 1.0 mg/L at all sam- pled water depths and seasons. Therefore, DO was not the critical parameter that affected the vertical distribu- tion of gold en mussels. As show in Figure 3(b), the most suitable water temperature appeared at water depth of 1 m in the spring (May 22). Most golden mussel larvae colonized to this water depth. Correspondingly, the colo- nization density was the highest at the water depth of 1 m in the spring. Afterwards, the water temperature in- creased and even exceeded 28˚C at the water depth of 1 m from June to October, and the most suitable water temperature occurred at the water depth of 2.5 m. Con- sequently, the colonization density became the highest at the water depth of 2.5 m from June to October. In Octo- ber and December, water temperature at water depth of 1 m fell to the range of 16˚C - 28˚C, and the colonization density became the highest at the wat e r depth again. As shown in Figure 4, colonization density was also found to be closely related to the orientation of the habi- tat surface. The colonization density on the downward- facing surfaces was 2 - 8 times higher than that on the upward-facing surfaces owing to precipitation of silt and clay on the latter. When we measured the amount of clay and silt precipitates on the brick surfaces, we found that, the amount on the upward-facing surfaces was six times of that on the downward-facing surfaces. It is also re- ported that the colonization densities of the golden mus- sel on vertical surfaces and face-down surfaces were ob- viously higher than that on face-up surfaces [13]. Clay and silt precipitates interfere with filter -feeding, breath- ing, and attachment of golden mussels.  M. Z. XU ET AL. Copyright © 2013 SciRes. IJG (a) (b) Figure 3. Dissolved oxygen and water temperature in dif- ferent seasons. (a) Vertic al distribution of dissolved oxygen; (b) Vertical distribution of water temperature. Figure 4. Different colonization densities of golden mussels on upward- and downward-facing surfaces. 3.2. Community Composition Figure 5 shows an example of modal progression analy- sis of the golden mussels colonized at the water depth of 2.5 m. The histogram is the frequency (the number of golden mussels) as a function of shell length, and the curves represent the decomposition of the cohorts. Three cohorts (A, B, C) were decomposed. As shown in Figure 5(a), for the colonization time from March to July the average shell length and number (a) (b) Figure 5. Cohort decomposition of golden mussels colonized on new habitats. (a) March to July 2010; (b) March to Au- gust 2010. of golden mussels were 9.64 mm and 133 in cohort A. In other words, cohort A colonized the habitat in the first month and grew up to an average size of 9.64 mm in 4 months. The total number of the mussels was 133. For the same colonization time, the average shell length and number of mussels in cohorts B and C were 5.55 mm and 1137, and 1.87 mm and 460, respectively. For coloniza- tion time from March to August (Figure 5(b)), the three cohorts had developed further. The average shell length and number of mussels in cohorts A, B, and C became 12.36 mm and 568, 9.83 mm and 550, and 4.77 mm and 1912, respectively. The larger numbers for cohort C were due to more golden mussels recrui t e d in August . Table 2 lists the results of all of the cohort decomposi- tion for the 13 samples. Six cohorts—A, B, C, D, E, and F were decomposed. Golden mussels maturate for re- production when the shell length reaches 6 - 8 mm [9]. Therefore, the relations between the 6 cohorts can be inferred according to their average shell lengths. Cohorts A and B were the parental generation, and they colonized the habitats in March-April and May-June, respectively. The average shell length of cohort A was about 8 mm longer than the average shell length of cohort C. The average shell length of cohort B was about 10 mm longer than the average shell length of cohort D. The length differences between the generations were coincidentally equal to the sexual maturity size of the species 6-8 mm. Therefore, cohorts C and D were the offspring genera- tions of A and B. Cohorts C and D colonized the habitats in June to July and August to September, respectively. For the same reason, cohorts E and F were the offspring generations of C and D, respectively. From these results, it is concluded that the species completed three genera- tions in one year, and each generation experiences two 0 1 2 3 4 5 0.0 2.0 4.0 6.0 8.0 Water depth (m) DO (mg/L) 22-May 10-Sep 12-Oct 18-Dec 0 1 2 3 4 5 15 18 21 24 27 30 Water depth (m) Water tempreture (℃) 22-May 10-Sep 12-Oct 18-Dec 0 5000 10000 15000 20000 25000 30000 35000 40000 678955555 Density (ind/m 2 ) Colonization time (month) Upwards Downwards 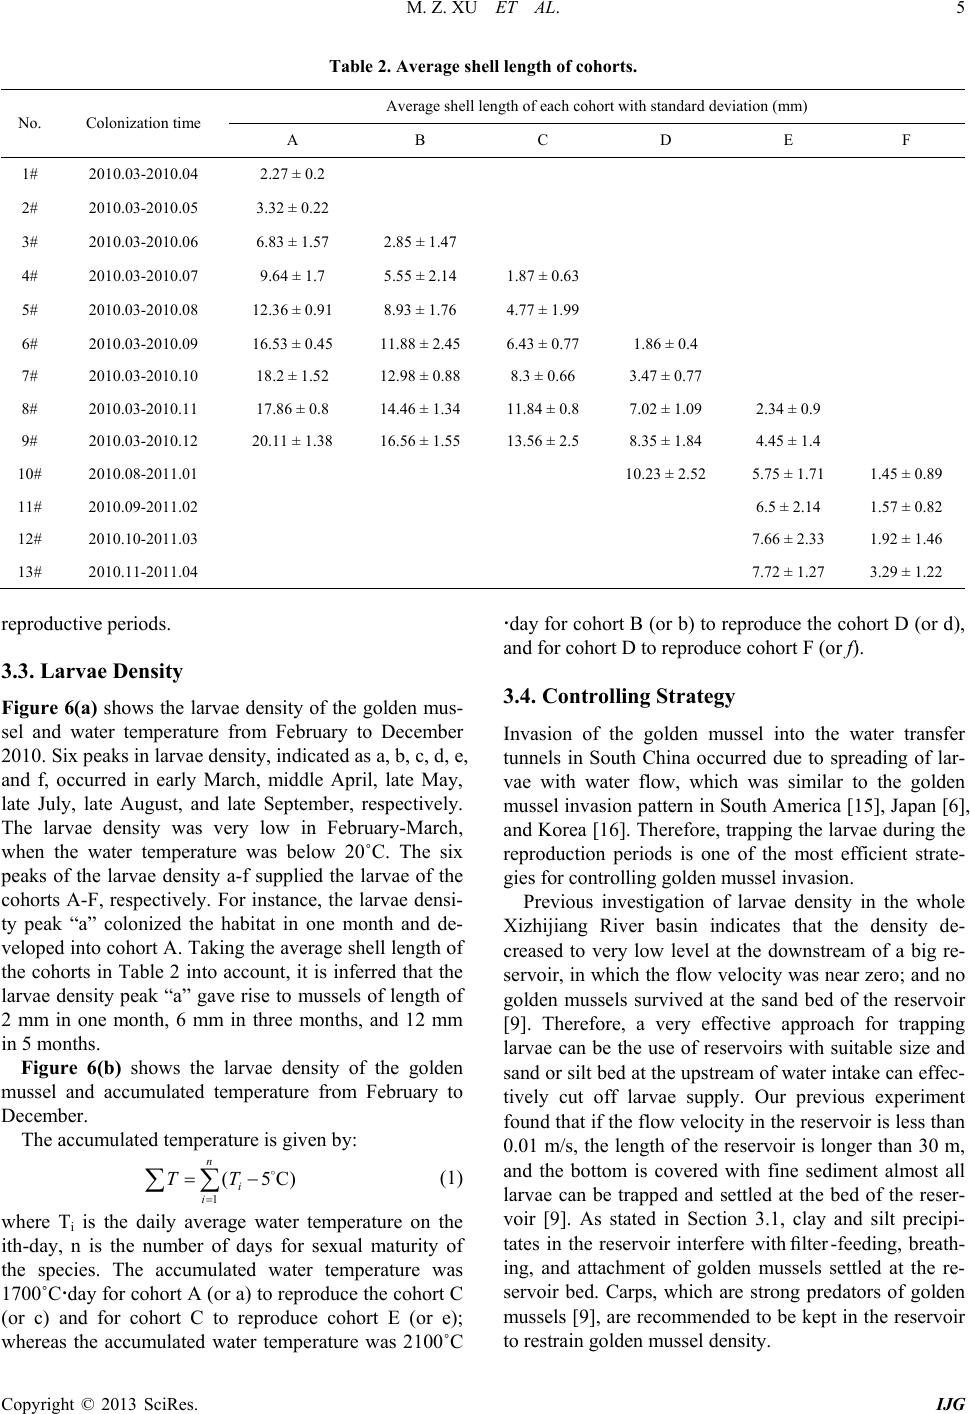 M. Z. XU ET AL. Copyright © 2013 SciRes. IJG Table 2. Average shell length of cohorts. No. Colonization time Average shell length of each cohort with standard deviation (mm) A B C D E F 1# 2010.03-2010.04 2.27 ± 0.2 2# 2010.03-2010.05 3.32 ± 0.22 3# 2010.03-2010.06 6.83 ± 1.57 2.85 ± 1.47 4# 2010.03-2010.07 9.64 ± 1.7 5.55 ± 2.14 1.87 ± 0.63 5# 2010.03-2010.08 12.36 ± 0.91 8.93 ± 1.76 4.77 ± 1.99 6# 2010.03-2010.09 16.53 ± 0.45 11.88 ± 2.45 6.43 ± 0.77 1.86 ± 0.4 7# 2010.03-2010.10 18.2 ± 1.52 12.98 ± 0.88 8.3 ± 0.66 3.47 ± 0.77 8# 2010.03-2010.11 17.86 ± 0.8 14.46 ± 1.34 11.84 ± 0.8 7.02 ± 1.09 2.34 ± 0.9 9# 2010.03-2010.12 20.11 ± 1.38 16.56 ± 1.55 13.56 ± 2.5 8.35 ± 1.84 4.45 ± 1.4 10# 2010.08-2011.01 10.23 ± 2.52 5.75 ± 1.71 1.45 ± 0.89 11# 2010.09-2011.02 6.5 ± 2.14 1.57 ± 0.82 12# 2010.10-2011.03 7.66 ± 2.33 1.92 ± 1.46 13# 2010.11-2011.04 7.72 ± 1.27 3.29 ± 1.22 reproductive periods. 3.3. Larvae Density Figure 6(a) shows the larvae density of the golden mus- sel and water temperature from February to December 2010. Six peaks in larvae density, indicated as a, b, c, d, e, and f, occurred in early March, middle April, late May, late July, late August, and late September, respectively. The larvae density was very low in February-March, when the water temperature was below 20˚C. The six peaks of the larvae density a-f supplied the larvae of the cohorts A-F, respectively. For instance, the larvae densi- ty peak “a” colonized the habitat in one month and de- veloped into cohort A. Taking th e average shell length of the cohorts in Table 2 into account, it is inferred that the larvae density peak “a” gave rise to mussels of length of 2 mm in one month, 6 mm in three months, and 12 mm in 5 months. Figure 6(b) shows the larvae density of the golden mussel and accumulated temperature from February to December. The accumulated temperature is given by: (1 ) where Ti is the daily average water temperature on the ith-day, n is the number of days for sexual maturity of the species. The accumulated water temperature was 1700˚Cday for cohort A (or a) to reproduce the cohort C (or c) and for cohort C to reproduce cohort E (or e); whereas the accumulated water temperature was 2100˚C day for cohort B (or b) to reproduce the cohor t D (or d), and for cohort D to rep roduce cohort F (or f). 3.4. Controlling Strategy Invasion of the golden mussel into the water transfer tunnels in South China occurred due to spreading of lar- vae with water flow, which was similar to the golden mussel invasion pattern in Sou th America [15], J apan [6], and Korea [16]. Therefore, trapping the larvae during the reproduction periods is one of the most efficient strate- gies for controlling golden mussel invasion. Previous investigation of larvae density in the whole Xizhijiang River basin indicates that the density de- creased to very low level at the downstream of a big re- servoir, in which the flow velocity was near zero; and no golden mussels survived at the sand bed of the reservoir [9]. Therefore, a very effective approach for trapping larvae can be the use of reservoirs with suitable size and sand or silt bed at the upstream of water intake can effec- tively cut off larvae supply. Our previous experiment found that if the flow velocity in the reservoir is less than 0.01 m/s, the length of the reservoir is longer than 30 m, and the bottom is covered with fine sediment almost all larvae can be trapped and settled at the bed of the reser- voir [9]. As stated in Section 3.1, clay and silt precipi- tates in the reservoir interfere with filter -feeding, breath- ing, and attachment of golden mussels settled at the re- servoir bed. Carps, which are strong predators of golden mussels [9], are recommended to be kept in the reservoir to restrain golden mussel density. 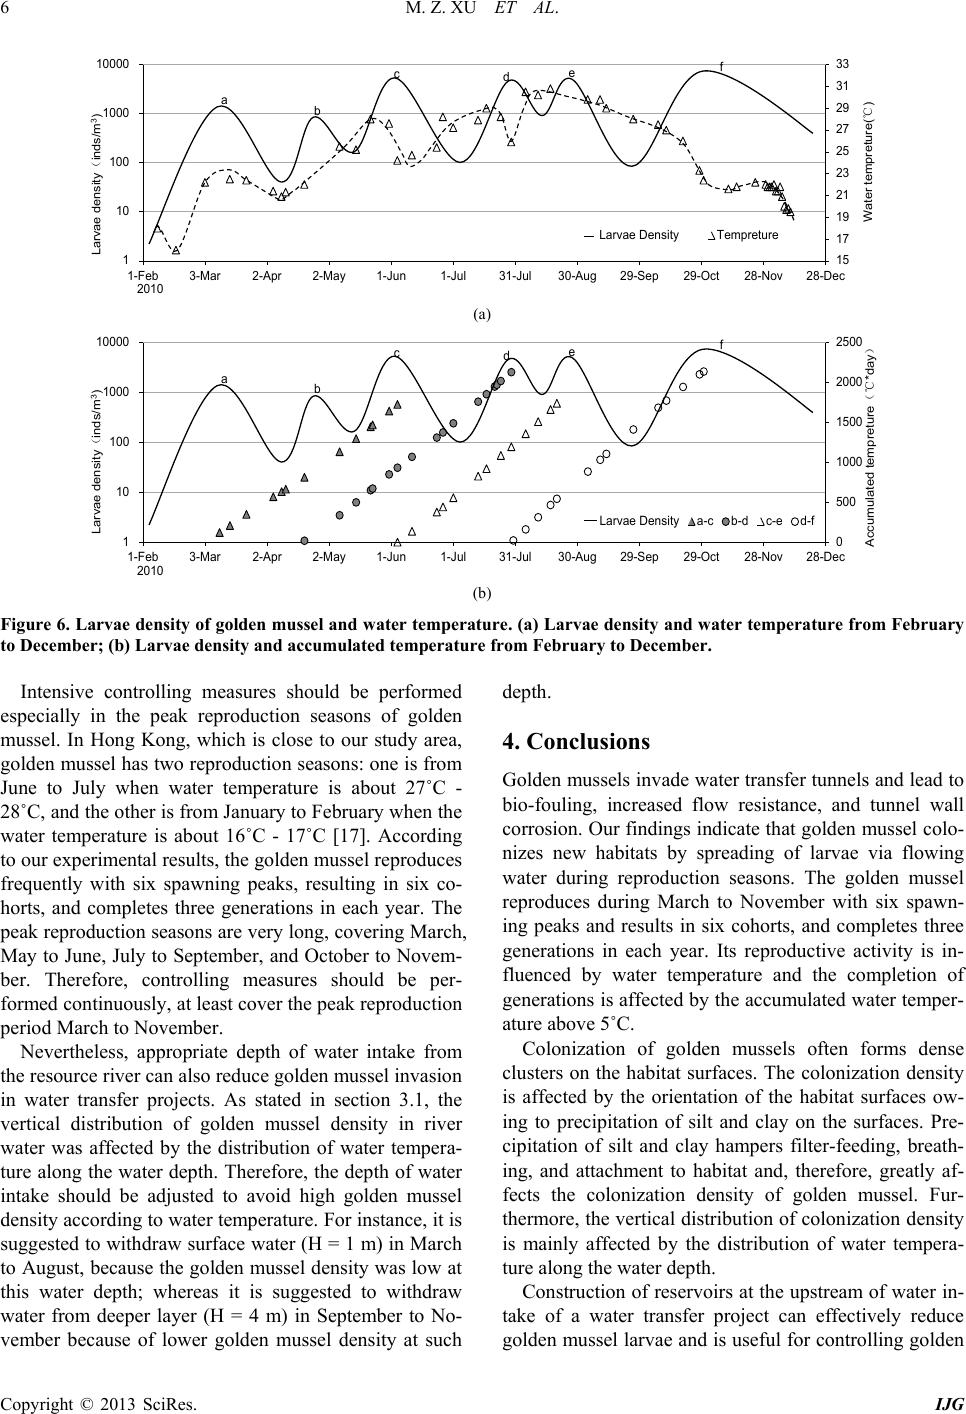 M. Z. XU ET AL. Copyright © 2013 SciRes. IJG (a) (b) Figure 6. Larvae density of golden mussel and water temperature. (a) Larvae density and water temperature from February to December; (b) Larvae density and accumulated temperature from February to December. Intensive controlling measures should be performed especially in the peak reproduction seasons of golden mussel. In Hong Kong, which is close to our study area, golden mussel has two reproduction seasons: one is from June to July when water temperature is about 27˚C - 28˚C, and the other is from January to February when the water temperature is about 16˚C - 17 ˚C [17]. According to our experimental results, the golden mussel reproduces frequently with six spawning peaks, resulting in six co- horts, and completes three generations in each year. The peak reproductio n seasons are very long , covering March, May to June, July to September, and October to Novem- ber. Therefore, controlling measures should be per- formed continuously, at least cover the peak reproduction period March to November. Nevertheless, appropr iate depth of water intake from the resource river can also reduce golden mussel invasion in water transfer projects. As stated in section 3.1, the vertical distribution of golden mussel density in river water was affected by the distribution of water tempera- ture along the water depth. Therefore, the depth of water intake should be adjusted to avoid high golden mussel density according to water temperature. For instance, it is suggested to withdraw surface water (H = 1 m) in March to August, because the golden mussel density was low at this water depth; whereas it is suggested to withdraw water from deeper layer (H = 4 m) in September to No- vember because of lower golden mussel density at such depth. 4. Conclusions Golden mussels invade water transfer tunnels and lead to bio-fouling, increased flow resistance, and tunnel wall corrosion. Our findings ind icate that golden mussel colo- nizes new habitats by spreading of larvae via flowing water during reproduction seasons. The golden mussel reproduces during March to November with six spawn- ing peaks and results in six cohorts, and completes three generations in each year. Its reproductive activity is in- fluenced by water temperature and the completion of generations is affected by the accumulated water temper- ature above 5˚C. Colonization of golden mussels often forms dense clusters on the habitat surfaces. The colonization density is affected by the orientation of the habitat surfaces ow- ing to precipitation of silt and clay on the surfaces. Pre- cipitation of silt and clay hampers filter-feeding, breath- ing, and attachment to habitat and, therefore, greatly af- fects the colonization density of golden mussel. Fur- thermore, the vertical d istribution of colonization density is mainly affected by the distribution of water tempera- ture alon g the water depth. Construction of reservoirs at the upstream of water in- take of a water transfer project can effectively reduce golden mussel larvae and is useful for controlling golden 15 17 19 21 23 25 27 29 31 33 1 10 100 1000 10000 1-Feb3-Mar2-Apr2-May1-Jun1-Jul31-Jul30-Aug 29-Sep29-Oct 28-Nov 28-Dec Water tempreture(℃) Larvae density(inds/m 3 ) 2010 Larvae DensityTempreture 0 500 1000 1500 2000 2500 1 10 100 1000 10000 1-Feb 3-Mar2-Apr 2-May 1-Jun1-Jul31-Jul 30-Aug 29-Sep29-Oct 28-Nov 28-Dec Accumulated tempreture(℃*day) Larvae density(inds/m3) 2010 Larvae Densitya-c b-d c-e d-f  M. Z. XU ET AL. Copyright © 2013 SciRes. IJG mussel invasion in water transfer tunnels. Additionally, appropriate depth of water intake from the resource river can also reduce golden mussel invasion in water transfer projects. 5. Acknowledgements This study was supported by the Ministry of Water Re- sources of China (200901078), Natural Science Founda- tion of China (41071001), and Tsinghua University (2009THZ0223 4) . REFERENCES [1] B. S. Morton, “Freshwater Fouling Bivalves,” Proceed- ings of the First International Corbicula Symposium, Texas Christian University, Fort Worth, Texas, 1979. [2] B. M. Ye, X. W. Cao, M. Z. Xu, Z. Y. Wang and C. C. Lin, “Study of Limnoperna fortunei Invasion in Water Transport Project,” Water and Wastewater Engineering, Vol. 37, 2011, pp. 99-102. [3] G. Darrigran, “Potential Impact of Filter-Feeding Invad- ers on Temperate Inland Fresh Water Environments,” Bi- ological Invasions, Vol. 4, 2002, pp. 145-156. http://dx.doi.org/10.1023/A:1020521811416 [4] D. Boltovskoy, N. Correa, D. Cataldo and F. Sylvester, “Dispersion and Ecological Impact of the Invasive Fresh- water Bivalves Limnoperna fortunei in the Rı´o de la Pla- ta Watershed and Bey ond,” Biological Invasions, Vol. 8, 2006, pp. 947-963. http://dx.doi.org/10.1007/s10530-005-5107-z [5] P. E. Penchaszadeh, G. Darrigran, C. Angulo, A. Averbuj, M. Broegger, A. Dogliotti and N. Pirez, “Predation of the Invasive Freshwater Mussel Limnoperna fortunei (Dunk- er, 1857) (Mytilidae) by the Fish Leporinusobtusidns Va- lenciennes, 1846 (Anostomidae) in the R´ıo de la Plata, Argentina,” Journal of Shellfish Research, Vol. 19, N o. 1, 2000, pp. 229-231. [6] Y. Magara, Y. Matsui, Y. Goto and A. Yuasa, “Invasion of the Non-Indigenous Nuisance Mussel, Limnoperna fortunei, into water supply facilities in Japan,” Journal of Water Supply: Research and Technology—AQUA, Vol. 50, No. 3, 2001, pp. 113-124. [7] M. Z. Xu, Z. Y. Wang, X. H. Duan, M. Q. Zhuang and F. T. de Souza, “Ecological Measures of Controlling Inva- sion of Golden Mussel (Limnoperna fortunei) in Water Transfer Systems,” Proceeding: 33rd IAHR Congress: Water Engineering for a Sustainable Environment, Van- couver, 2009, pp. 1609-1616. [8] D. Simberloff, “Eradication of Island Invasives: Practical Actions and Results Achieved,” Trends in Ecology and Evolution, Vol. 16, No. 6, 2001, pp. 273-274. http://dx.doi.org/10.1016/S0169-5347(01)02154-1 [9] M. Z. Xu, “Experimental Study of Macroinvertebrate Limnoperna fortunei Invasion and Prevention in Water Transfer Tunnels,” Ph.D. Thesis, Tsinghua University, Beijing, 2012. [10] P. E. A. Bergonci, M. C. D. Mansur, D. Pereira and C. P. Santos, “Population Sampling of the Golden Mussel, Limnoperna fortunei (Dunker, 1857), Based on Artificial Ceramic Substrate,” Biotemas, Vol. 22, No. 3, 2009, pp. 85-94. [11] C. G. Bhattacharya, “A Simple Method of Resolution of a Distribution into Gaussia n Components,” Biometrics, Vol. 23, No. 1, 1967, pp. 115-135. http://dx.doi.org/10.2307/2528285 [12] D. Pauly, “Fish Population in Tropical Waters: A Manual for Use with Programmable Calculator,” ICLARM Stu- dies and Reviews 8, Manila, Philippines, 1984, p. 325. [13] B. Morton, “The Population Dynamics of Limnoperna fortunei (Dunker 1857) (Bivalva: Mytilacea) in Plover Cove Reservoir, Hong Kong,” Malacologia, Vol. 16, No. 1, 1977, pp. 165-182. [14] A. Ricciardi, “Global Range Expansion of the Asian Mussel Limnoperna fortunei (Mytilidae): Another Foul- ing Threat to Freshwater Systems,” Biofouling, Vol. 13, No. 2, 1998, pp. 97-106. http://dx.doi.org/10.1080/08927019809378374 [15] C. P. D. Santos, N. L. Würdig and M. C. D. Mansur, “Fa- ses Larvais do Mexilhao Dourado limnoperna fortunei (Dunker) (Mollusca, Bivalvia, Mytilidae) na Bacia do Guaiba, Rio Grand do Sul, Brasil,” Revista Brasileira de Zoologia, Vol. 22, No. 3, 2005, pp. 702-708. http://dx.doi.org/10.1590/S0101-81752005000300029 [16] S. S. Choi and J. S. Kim, “Studies on the Metamorphosis and the Growth of Larva in Limnoperna fortunei,” Jour- nal of Malacology, Vol. 1, 1985, pp. 13-18. [17] B. Morton, “The Reproductive Cycle in Limnoperna For- tunei (Dunker 1857) (Bivalvia: Mytilidae) Fouling Hong Kong’s Raw Water Supply System,” Oceanologia et limnologiasinica, Vol. 13, No. 4, 1982, pp. 319-332.
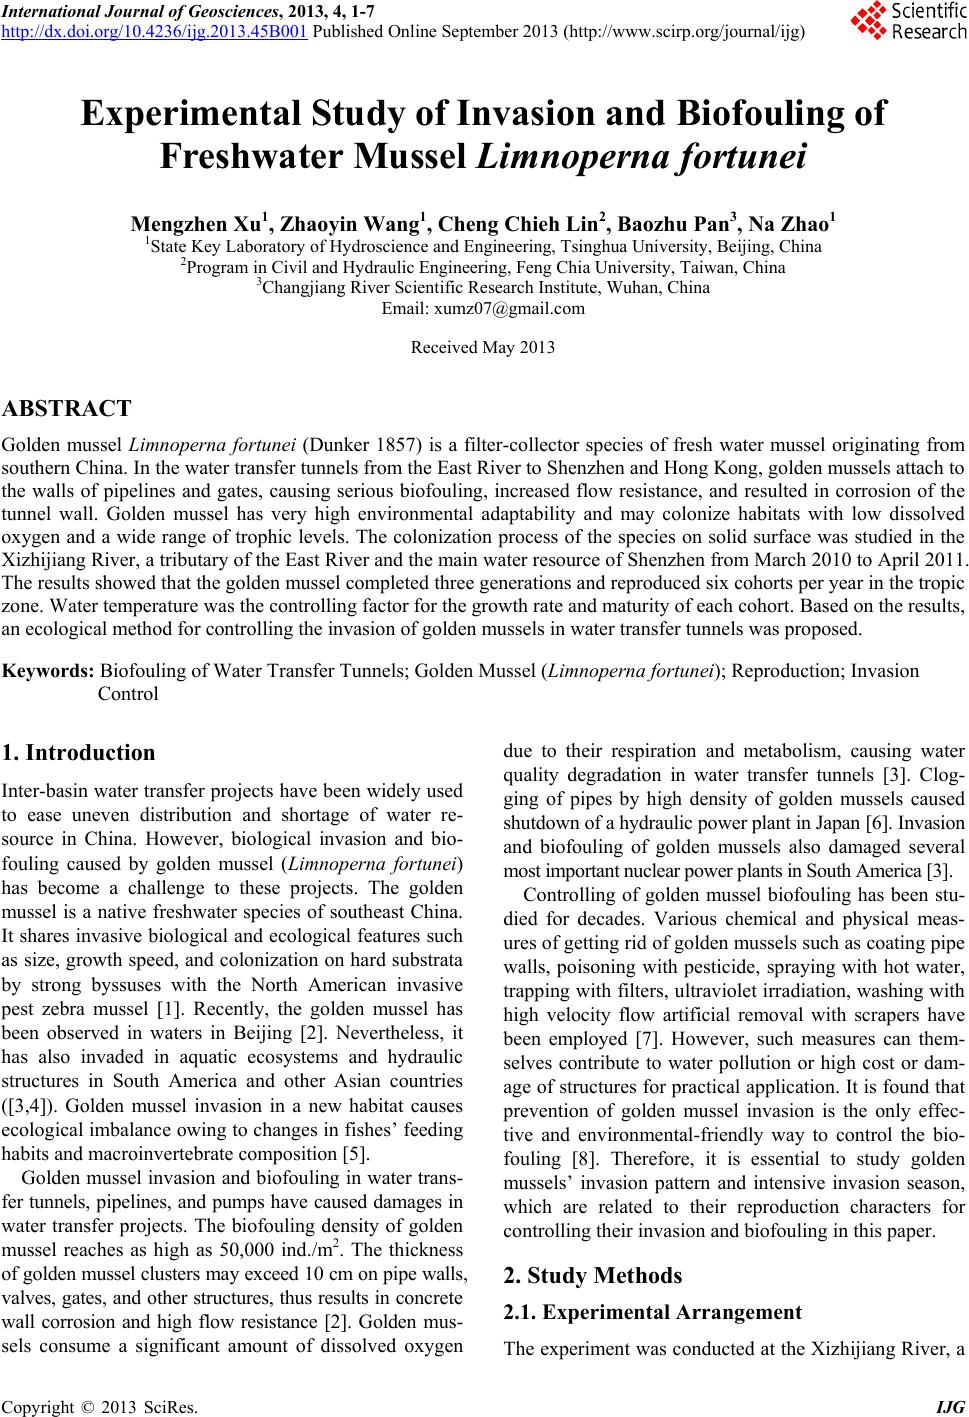
|