 Vol.4, No.10, 549-557 (2013) Agricultural Sciences http://dx.doi.org/10.4236/as.2013.410074 Validating the demand for goat meat in the US meat market Xuanli Liu1*, Mack Nelson2, Erika Styles2 1Agricultural Research Station, Fort Valley State University, Fort Valley, USA; *Corresponding Author: liux@fvsu.edu 2Department of Economics, Fort Valley State University, Fort Valley, USA Received 8 May 2013; revised 9 June 2013; accepted 10 July 2013 Copyright © 2013 Xuanli Liu et al. This is an open access article distributed under the Creative Commons Attribution License, which permits unrestricted use, distribution, and reproduction in any medium, provided the original work is properly cited. ABSTRACT There is a large body of literature in economics examining the US meat market, but few studies have focused on the US goat meat market. This study, as a catch-up effort, provides an estimate of the demand for goat meat and assesses the impact of driving factors in the US goat meat market. The data for this study were collected in 11 southern states and specifically elicit the de- mand and consumer preferences in this non- conventional market. Four econometric models are fitted to examine the multiple layers of the demand, including the current, the potential, the latent, and the seasonal demand. Findings indi- cate a substantial demand for goat meat with great growth potential, driven by demographic factors and food safety concerns. Ethnic groups and the aged comprise the current niches for goat meat, and the preferences for healthy and safe meat will define the market in the future. Keywords: Market; Demand; Consumer Preferences; Ethnics; Goat Meat 1. INTRODUCTION The past decades have witnessed substantial changes in the US meat market. The declining demand for beef, the growing demand for poultry, and the leveling off of demand for pork characterize the well-known consump- tion shift from red to white meat [1]. Driving the shift is consumers’ increasing demand for healthy meat and meat products [2]. In fact, the attributes related to meat safety have become a critical component in motivating con- sumers to make food selection [3,4]. A study from the USDA ranked health concerns as the number one factor influencing consumer demand for meat products [1], and choice experiment studies confirmed consumers’ willing- ness to pay (WTP) for products with a USDA certified organic label [5]. Discussion in a broader spectrum re- garding meat markets and consumer preferences could be referenced to many other studies [2,6-9]. A result of interest from the preference shift of con- sumers is that the US goat meat market has been stimu- lated, which, for a long time, has been a stagnant niche. It is now recognized by researchers and consumers that there is a good match between goat meat and their pre- ferences for lower risk and more healthy products [10- 12]. This acknowledgement led to a continual growth in the demand for goat meat in the United States. Thus, re- searchers are becoming attentive to issues of demand, supply, marketing channels, and influential factors in the goat meat market [12-15]. Yet, in contrast to many stu- dies on beef, pork and poultry products, the investiga- tion in the goat meat market is notably inadequate, and some crucial issues such as the market demand and con- sumer preferences have not been studied in the depth needed for reshaping the marketing strategies of the in- dustry or changing the status quo of the industry. As a matter of fact, a literature review revealed only a few journal publications and the extreme paucity of analyses supported by solid data. While the call for more studies is widespread, the appreciation of effective data gather- ing and quantitative investigations is especially warrant- ed. This study is an attempt to fill in some of the gaps in quantitative analyses and estimates of the goat meat de- mand and the corresponding driving factors. To accom- plish the task, the study uses data from a survey in eleven southern states (Alabama, Arkansas, Florida, Georgia, Mis- sissippi, North Carolina, Oklahoma, Louisiana, South Ca- rolina, Tennessee, and Texas) commonly known as the goat meat consumption and production region. Four eco- nometric models were fitted to examine the multiple lay- ers of demand, including the current demand, the poten- tial demand, the latent demand, and the seasonal demand. As a result of the support of the robust data, this study is Copyright © 2013 SciRes. OPEN A CCESS  X. Liu et al. / Agricultural Sciences 4 (20 13) 549-557 550 capable of providing an in-depth investigation into the promising US goat meat market. 2. DATA The data used in this study were from a telephone sur- vey conducted by the Survey Research Center of the University of Georgia. By using a random sampling pro- cedure [16], the survey collected 11 subsamples, each with a size of 237 to 257 respondents from a state, and amoun- ted to 2751 households. The survey questionnaire consists of 23 simple and 25 multiple-layer questions. These questions can be grouped into six categories: 1) the status quo of goat meat con- sumption, including current consumption, willingness to consume more, and willingness to try if not consumed at the time of the survey; 2) consumer preferences for va- rious goat meat cuts, different search, experience, and credence attributes; 3) cooking methods, such as soup, barbeque, roasting, meat sauce, chili, and meat loaf; 4) consumption of other meats, including beef, pork, chic- ken, turkey, lamb, and fish; 5) demographics, such as gen- der, age, ethnic affiliation, household size, and family structure; 6) socioeconomic characteristics of respon- dents, including education and household income. Authors were solicitous in the selection of levels for categorical variables. Ethnic affiliation, matched the US census, is comprised of Whites, African Americans, Black non African Americans, Hispanics, Asians, and multi-racial races. Data were also collected on the origin of the ethnic groups and the length of time away from their original culture. To measure impacts of age, respon- dents were placed into ten age groups, with a narrower interval for the elder group given their larger likelihood of consuming goat meat products. For household income, nine levels were used with a narrower interval for the lower range of income, reflecting the early findings that the low- and middle-income households constitute the greater part of demand in the goat meat market. In view of spatial discrepancy in consumption, data from the eleven states were merged into four levels, based on the preliminary analysis. Education was initially measured at eight levels in an effort to gauge its impacts with suffi- cient accuracy, but the three levels as reported in Table 1 were used as suggested by the analyses. Other variables and their levels were also elucidated in Table 1. As a rule of thumb, for variables with six levels or more, trade-off between the accurate measurement of the variable and the loss of the degree of the freedom was made in favor of the degree of the freedom. 3. METHODS The logistic model is used as the major analytical tool in this study. As a matured method for categorical analysis, the logistic model has been extensively used in many areas of social investigations when the dependent variable of interest is categorical [17-19]. Similar approa- ches in the model-building paradigm of categorical data analysis also include the Linear Probability model (LPM) and the Probit model. While the LPM is seldom used in recent years for its inherent disadvantages in estimator, variance dependence, and outbound range of response prediction, the other two approaches, especially the lo- gistic model, have found extensive use for its handling of odds ratios via logit parameters. A detailed elaboration of the logistic model is availa- ble in many seminal studies [20,21], thereby will not be addressed here. Here a discussion of the model is limited to the level necessary for facilitating the understanding of our analyses. In general, the logistic model assumes that yij is the number of occurrence of the response j for ith observation in Ni repetitions (if Ni = 1 then yij = 0 or 1) and Pij is defined as the probability that alternative j occurs for the ith observation, then the multinomial pro- bability density function is: 12 121 2 12 ! !! ! ii iJ y i iiiJi iiJ ii iJ Ny yyyP PP yy y (1) In most cases, Ni = 1 for all observation units i = 1, 2, ... , n, and yij becomes 1 because only one of the J alternatives can occur for any observation unit i. In such case, the log likelihood function is: 11 ln nJ ij ij ij Ly p (2) Enforcing the restriction of 1 1 J j ij P, the probability of response j will be: 1 112 2 2 112 2 112 2 2 1for 1 1exp exp for 2 1exp iJ jijikjik i j jijikjik i ij J jijikjik i j pj Bx BxBx e Bx BxBx e pj Bx BxBx e (3) For nominal response variables, all non-reference cate- gories are compared with a reference category and the logit of the level j, with the reference category k, is: log1, , jj k pBx forjJ p (4) For ordinal response variables, the logistic model uses the cumulative logit function and the reference category Copyright © 2013 SciRes. OPEN A CCESS  X. Liu et al. / Agricultural Sciences 4 (20 13) 549-557 Copyright © 2013 SciRes. 551 Table 1. Variable definitions and summary statistics (cont.). Variable Definition & code Statistics (means%) 0 1 2 3 4 5 Q28x1 Rankings of food page advertisement: 0 (important); 1 (neutral); 2 (not important) 30.4 39.4 29.8 Q29 Rankings of store display: 0 (important); 1 (neutral); 2 (not important) 46.9 31.7 21.4 Q30 Rankings of chevon price specials: 0 (important); 1 (neutral); 2 (not important) 54.5 18.9 26.5 Q30x1 Rankings of other meat price specials: 0 (important); 1 (neutral); 2 (not important) 77.9 13.4 8.8 Q32 Rankings of USDA inspection: 0 (important); 1 (neutral); 2 (not important) 78.7 7.8 13.5 Q34 Rankings of chevon fat content: 0 (important); 1 (neutral); 2 (not important) 62.8 8.0 29.2 Q35x1 Ranking of the cholesterol content: 0 (important); 1 (neutral); 2 (not important) 73.7 7.2 19.1 Q47 Family Size: number of person in the household Q49 Race: 0 for White; 1 for African American; 2 for non-African American; 3 for Hispanic, 4 for Asian, 5 for multi-racial 77.2 13.9 1.4 2.8 0.5 2.0 Q54 Age: 0 for < 34; 1 for 35 - 54; 2 for 55 - 64; 3 for > 65 22.1 38.7 16.8 26.2 Q55 Education: 0 for high school diploma or less; 1 for associate degree or some college; 2 for college or higher 34.5 29.2 34.0 Q56 Gender: 0 for female; 1 for male 68.8 31.0 Q57 Household income: 0 (less than 19,999); 1 (20,000 - 34,999); 2 (35,000 - 49,999); 3 (50,000 - 74,999); 4 (75,000 or more)11.0 13.7 12.0 15.3 16.1 Q58 Geographic location: 0 (TN); 1 (AL, AR, GA, MS, MC, OK, LA , SC) 2 (FL); 3(TX) 8.9 73.5 8.6 9.0 4. MODEL SELECTION varies with the level of the response variable under con- sideration. The logit is defined as: Four logit models were fitted to estimate the current demand, the potential demand, the latent demand, and the seasonal demand. Starting with a similar variable set, alternative models were screened for the best-fitting ones via multiple diagnostic statistics [22,23]. Given the large data set, we were able to make the selection of variables from a much broader spectrum, which partially insured the efficacy of the models retained. 1 1 log 1, 1 J j jj J j j p Bx forjJ p (5) Parameters in a logistic model measure the logit change of the response variable for a unit change in an explanatory variable. If the explanatory variable is cate- gorical, the parameter measures the impact of a specific level of the variable on the probability of event, given the selection of the reference level and no changes in all other variables. The initial explanatory variable set used in modeling includes most variables in the survey; such as meat prices, rankings of the cholesterol content, rankings of fat content, other meat consumption, real income, age, education, ethnic groups, household structure, gender, and geographic locations. To identify and retain the best models, multiple statistics, including R2, AIC, LR, P- value, and Hosmer and Lemeshow test, weighted in the model selection [20,24]. A candidate model under prior consideration requires a significant LR, a lower AIC, a significant Wald statistic, and a non-significant Hosmer and Lemeshow test. Variables, lack of appropriateness The SAS software package provides a good platform for implementing the model. All data management, cod- ing, and modeling processes have been done in the SAS environment. One thing worthy to being highlighted is that we selected reference coding for nominal variables, and used ordinal coding for ordinal variables in the mo- del. OPEN A CCESS  X. Liu et al. / Agricultural Sciences 4 (20 13) 549-557 552 and power, were not retained for the sake of the degree of freedom. For the variables retained, the levels of in- significance were normally merged if there are more than five originally. 4.1. The Current Demand Model The model examines the existing demand and focuses on consumers who eat goat meat at the time of the survey. The dependent variable comes from the question “have you or any member of your immediate family member eaten goat meat recently?” The model starts with the consumption of goat meat substitutes (beef, pork, and chicken), demographics (household size, ethnic groups, age, and race), food safety, and socioeconomic factors (education and household real income). Fitted with a general logit function, we first tested whether the model as a whole explains the variability of the current demand, and then examined each variable and removed those of insignificance for the sake of the degree of the freedom. There were 2675 observations effective for fitting the model. The best model selected suggests an intriguing re- lationship between the current demand and a set of ex- planatory variables. 4.2. The Potential Demand Model The potential demand model is to catch the potential increase in goat meat consumption due to extra con- sumption of the existing consumers. Differing from other meat markets, the goat meat market is featured with consumers of low per capita consumption, an average of about 4 pounds annually. A question to be raised is: whe- ther the consumers have the willingness to purchase more? And if yes, under what conditions? The question asked in our survey is “would your family eat more goat meat if it was available in your local grocery stores?” Responses to the question suggest the existence of a large potential of demand. The model identified meets the needs of a robust model and provides some insightful marketing tips for the industry. 4.3. The Latent Demand Model The latent demand model examines the potential in- crease in goat meat consumption due to the influx of new consumers. About 20% of consumers, not eating goat meat at the time of the survey, were willing to make purchase if available locally. The latent demand fitted would help to get a full view of the future expansion of the US goat meat market. The response variable is de- rived from the survey question “Do you think you will try goat meat if it is available in your area food stores?” Following the procedures in model (1) and (2), the latent demand model was identified. 4.4. The Seasonal Demand Model The seasonal demand largely characterizes the status quo of the existing US goat meat market. Based on the survey data, the seasonal and occasional consumers ac- counted for 73% of the goat meat market consumption. To have a broad understanding of the seasonality, we in- tended to have a multinomial logit model which sepa- rates spring, winter, summer, winter demand as well as the social and demographic factors. However, the issue of missing values in observations impeded our efforts. As an alternative, we fitted a simple logit model with a de- pendent variable of two levels: seasonal or non-seasonal consumption. We identified a seasonal demand model, but found it less robust in statistics and lack of explana- tory power in both theory and practice. 5. RESULTS AND DISCUSSION The SAS results confirm the existence of explanatory variable sets of appropriateness and significance for each demand model. The four models fitted provide a high- dimension view of consumer demand and preferences in the US goat meat market. 5.1. Current Demand The results of the current demand model are reported in Table 2. Those variables retained in the model shed light on the understanding of the existing US goat meat market. First, the consumption of other meats influenced the consumption of goat meat. While chicken turns out to be a complementary diet component to goat meat consu- mers, pork consumption appears to reduce the likelihood of goat meat consumption or is a substitute. No signi- ficant relationships between the consumption of goat meat and other types of meat were identified. As expected, demographics take a role in goat meat demand. There are remarkable differences in consump- tion between ethnic groups. Taking Whites as the refe- rence group, the odds ratios for both non-African Ame- rican Blacks and Hispanics is as high as 3.42, indicating a much higher propensity to consume. However, an unexpected result is that African Americans and Asians show a similar consumption pattern as Whites in goat meat consumption. Age is another influential demogra- phic factor; the odds ratios of the groups (55 - 64; 65 and over) are twice as high as the odds ratio of young age group (0 - 34). This result highlights the propensity of the elder to consume, specifically for the group aged 55 - 64. Reflecting the effect of gender, male consumers have a smaller odds ratio than females, suggesting men are less likely to consumer goat meat. Socioeconomic factors are relevant, but the impacts defy the conventional wisdom with a negative relation- ship between household income and goat meat consump- Copyright © 2013 SciRes. OPEN A CCESS 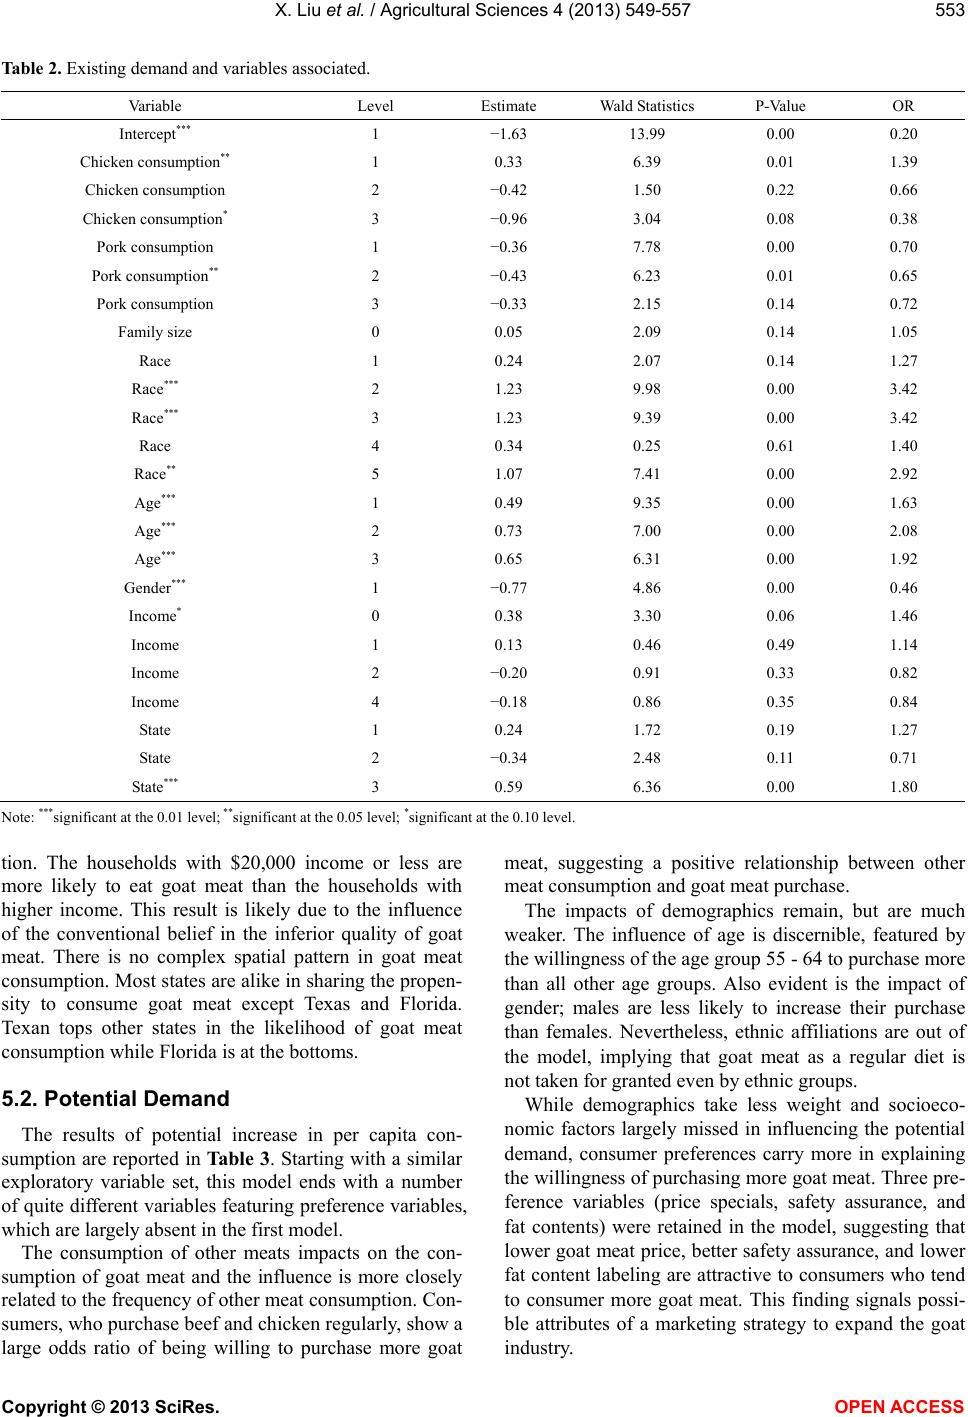 X. Liu et al. / Agricultural Sciences 4 (20 13) 549-557 Copyright © 2013 SciRes. OPEN A CCESS 553 Table 2. Existing demand and variables associated. Va riab l e Level Estimate Wald Statistics P-Value OR Intercept*** 1 −1.63 13.99 0.00 0.20 Chicken consumption** 1 0.33 6.39 0.01 1.39 Chicken consumption 2 −0.42 1.50 0.22 0.66 Chicken consumption* 3 −0.96 3.04 0.08 0.38 Pork consumption 1 −0.36 7.78 0.00 0.70 Pork consumption** 2 −0.43 6.23 0.01 0.65 Pork consumption 3 −0.33 2.15 0.14 0.72 Family size 0 0.05 2.09 0.14 1.05 Race 1 0.24 2.07 0.14 1.27 Race*** 2 1.23 9.98 0.00 3.42 Race*** 3 1.23 9.39 0.00 3.42 Race 4 0.34 0.25 0.61 1.40 Race** 5 1.07 7.41 0.00 2.92 Age*** 1 0.49 9.35 0.00 1.63 Age*** 2 0.73 7.00 0.00 2.08 Age*** 3 0.65 6.31 0.00 1.92 Gender*** 1 −0.77 4.86 0.00 0.46 Income* 0 0.38 3.30 0.06 1.46 Income 1 0.13 0.46 0.49 1.14 Income 2 −0.20 0.91 0.33 0.82 Income 4 −0.18 0.86 0.35 0.84 State 1 0.24 1.72 0.19 1.27 State 2 −0.34 2.48 0.11 0.71 State*** 3 0.59 6.36 0.00 1.80 Note: ***significant at the 0.01 level; **significant at the 0.05 level; *significant at the 0.10 level. tion. The households with $20,000 income or less are more likely to eat goat meat than the households with higher income. This result is likely due to the influence of the conventional belief in the inferior quality of goat meat. There is no complex spatial pattern in goat meat consumption. Most states are alike in sharing the propen- sity to consume goat meat except Texas and Florida. Texan tops other states in the likelihood of goat meat consumption while Florida is at the bottoms. 5.2. Potential Demand The results of potential increase in per capita con- sumption are reported in Table 3. Starting with a similar exploratory variable set, this model ends with a number of quite different variables featuring preference variables, which are largely absent in the first model. The consumption of other meats impacts on the con- sumption of goat meat and the influence is more closely related to the frequency of other meat consumption. Con- sumers, who purchase beef and chicken regularly, show a large odds ratio of being willing to purchase more goat meat, suggesting a positive relationship between other meat consumption and goat meat purchase. The impacts of demographics remain, but are much weaker. The influence of age is discernible, featured by the willingness of the age group 55 - 64 to purchase more than all other age groups. Also evident is the impact of gender; males are less likely to increase their purchase than females. Nevertheless, ethnic affiliations are out of the model, implying that goat meat as a regular diet is not taken for granted even by ethnic groups. While demographics take less weight and socioeco- nomic factors largely missed in influencing the potential demand, consumer preferences carry more in explaining the willingness of purchasing more goat meat. Three pre- ference variables (price specials, safety assurance, and fat contents) were retained in the model, suggesting that lower goat meat price, better safety assurance, and lower fat content labeling are attractive to consumers who tend to consumer more goat meat. This finding signals possi- ble attributes of a marketing strategy to expand the goat industry.  X. Liu et al. / Agricultural Sciences 4 (20 13) 549-557 554 Table 3. Potential demand and variables associated. Va riab l e Level Estimate Wald Statistics P-Value OR Intercept 1 0.31 2.16 0.14 1.36 Price special*** 0 −1.04 7.95 0.00 0.35 Price special*** 1 −1.58 9.95 0.00 0.21 USDA inspection 0 0.42 1.46 0.22 1.52 USDA Inspection** 1 −0.48 3.83 0.05 0.62 Fat content* 0 −0.49 3.22 0.07 0.61 Fat content 1 −0.26 2.30 0.12 0.77 Beef consumption** 1 −0.28 4.95 0.02 0.76 Beef consumption* 2 −0.42 2.79 0.09 0.66 Beef consumption 3 0.08 0.04 0.82 1.08 Chicken consumption 1 −0.23 2.41 0.12 0.79 Chicken consumption 2 −0.44 1.46 0.22 0.64 Chicken consumption ** 3 −1.48 4.80 0.02 0.23 Age 1 0.14 0.93 0.33 1.15 Age* 2 0.33 3.28 0.07 1.39 Age 3 0.26 2.13 0.14 1.30 Gender*** 1 −0.91 5.53 0.00 0.40 State 1 0.19 1.01 0.31 1.21 State** 2 0.46 6.11 0.01 1.58 State 3 −0.05 0.07 0.78 0.95 Note: ***significant at the 0.01 level; **significant at the 0.05 level; *significant at the 0.10 level. 5.3. Latent Demand The results of potential increase in goat meat demand from the influx of new consumers who have not pre- viously eaten goat meat are reported in Ta b le 4. The re- sults show sizeable potential entrants with distinguish- able demographic and socioeconomic characteristics. Again, demographics are linked with willingness of trying goat meat. With a four-fold larger odds ratio than Whites, African Americans and multiple racial house- holds are more likely to be the new entrant. Age factor again shows its influence, evidenced by the fact that the elder is more likely to try goat meat than the young (0 - 34), this is especially true for the group aged 55 or over. The impact of gender is insignificant, though it points toward more flexibility of females than males in trying goat meat. Both socioeconomic factors, education and household income, demonstrate a U-shaped impact on consumers’ willingness to enter the goat meat market. Taking the educational level of high school or less as the reference, consumers with an associate degree or some college education are less willing to try goat meat, but those with full college or higher education are more likely to trying. Likewise, the middle income households are more hesi- tated to try goat meat than their counterparts at the lower and higher spectrum of incomes. Once again, consumer preferences hold the edge in in- fluential factors related to latent demand. Preferences for cooking instruction, cooking methods (broiling and bar- beque), store display, price specials, and safety assurance were retained in the model. The odds ratios of those con- sumer preferences demonstrate that consumer’ preferenc- es for cooking guidance, price specials, and food safety may stimulate an influx of new consumers into the goat meat market. 5.4. Seasonal Demand The results of the seasonal demand model are reported in Table 5. Few variables have been retained and less in- sightful suggestions are offered in this model. Limited information conveyed in this model suggests that chicken consumers tend to have seasonal consump- tion of goat meat and eating other meat seems to have no significant impact on goat meat consumption. Male con- sumers and those sensitive to price specials are more likely to change their consumption in different seasons. In addition, consumers favoring less cholesterol comprise the large portion of seasonal purchasers of goat meat. Beyond the results observed above, it is an insurmoun- table challenge to further clarify the profile of regular Copyright © 2013 SciRes. OPEN A CCESS 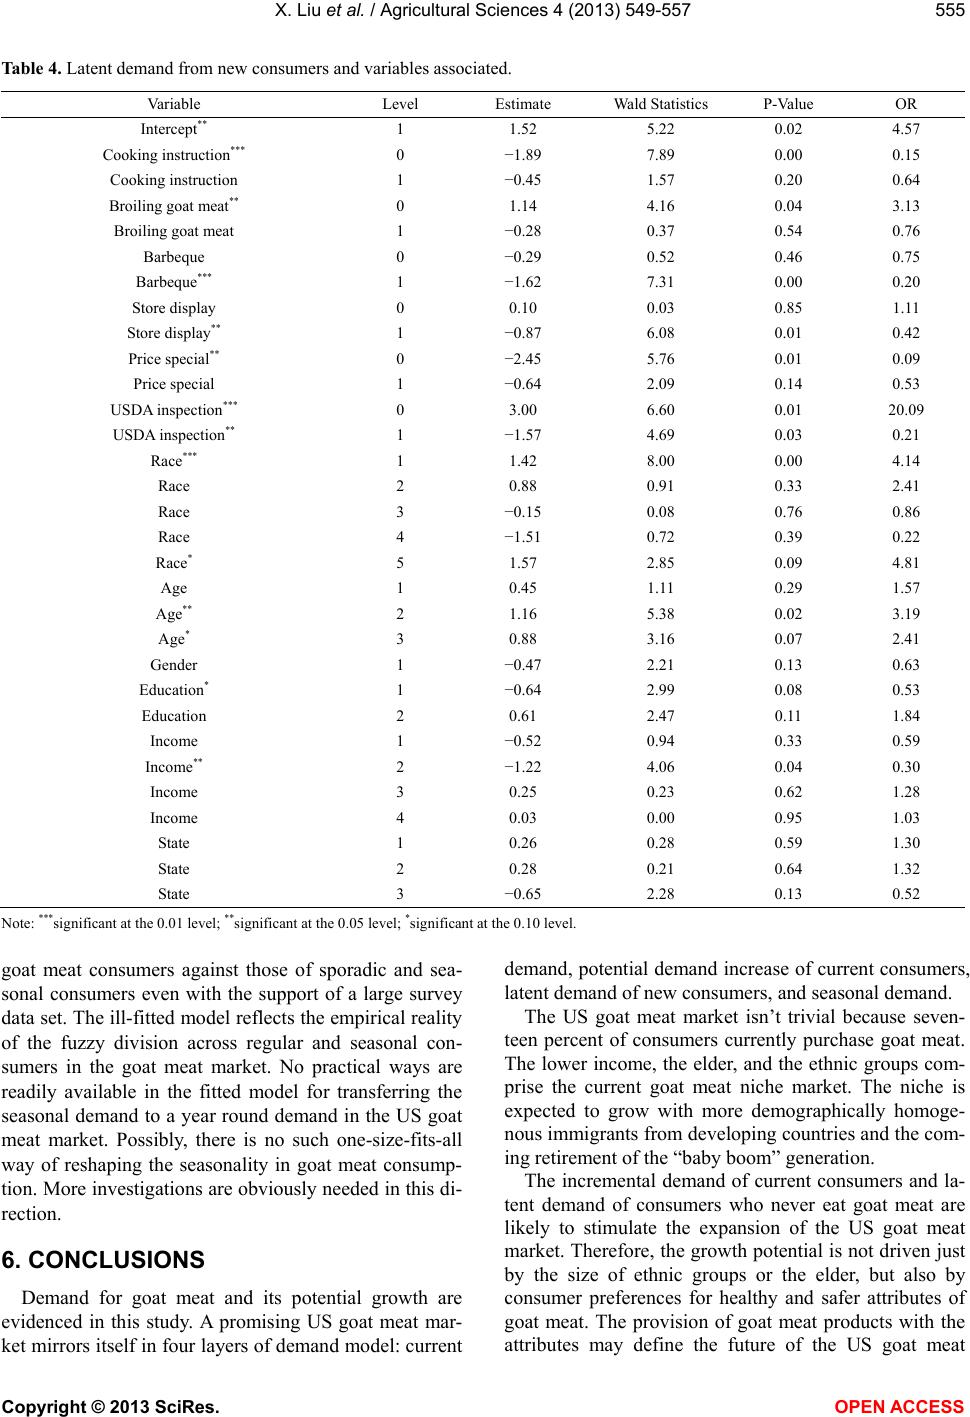 X. Liu et al. / Agricultural Sciences 4 (20 13) 549-557 555 Table 4. Latent demand from new consumers and variables associated. Va riab l e Level Estimate Wald Statistics P-Value OR Intercept** 1 1.52 5.22 0.02 4.57 Cooking instruction*** 0 −1.89 7.89 0.00 0.15 Cooking instruction 1 −0.45 1.57 0.20 0.64 Broiling goat meat** 0 1.14 4.16 0.04 3.13 Broiling goat meat 1 −0.28 0.37 0.54 0.76 Barbeque 0 −0.29 0.52 0.46 0.75 Barbeque*** 1 −1.62 7.31 0.00 0.20 Store display 0 0.10 0.03 0.85 1.11 Store display** 1 −0.87 6.08 0.01 0.42 Price special** 0 −2.45 5.76 0.01 0.09 Price special 1 −0.64 2.09 0.14 0.53 USDA inspection*** 0 3.00 6.60 0.01 20.09 USDA inspection** 1 −1.57 4.69 0.03 0.21 Race*** 1 1.42 8.00 0.00 4.14 Race 2 0.88 0.91 0.33 2.41 Race 3 −0.15 0.08 0.76 0.86 Race 4 −1.51 0.72 0.39 0.22 Race* 5 1.57 2.85 0.09 4.81 Age 1 0.45 1.11 0.29 1.57 Age** 2 1.16 5.38 0.02 3.19 Age* 3 0.88 3.16 0.07 2.41 Gender 1 −0.47 2.21 0.13 0.63 Education* 1 −0.64 2.99 0.08 0.53 Education 2 0.61 2.47 0.11 1.84 Income 1 −0.52 0.94 0.33 0.59 Income** 2 −1.22 4.06 0.04 0.30 Income 3 0.25 0.23 0.62 1.28 Income 4 0.03 0.00 0.95 1.03 State 1 0.26 0.28 0.59 1.30 State 2 0.28 0.21 0.64 1.32 State 3 −0.65 2.28 0.13 0.52 Note: ***significant at the 0.01 level; **significant at the 0.05 level; *significant at the 0.10 level. goat meat consumers against those of sporadic and sea- sonal consumers even with the support of a large survey data set. The ill-fitted model reflects the empirical reality of the fuzzy division across regular and seasonal con- sumers in the goat meat market. No practical ways are readily available in the fitted model for transferring the seasonal demand to a year round demand in the US goat meat market. Possibly, there is no such one-size-fits-all way of reshaping the seasonality in goat meat consump- tion. More investigations are obviously needed in this di- rection. 6. CONCLUSIONS Demand for goat meat and its potential growth are evidenced in this study. A promising US goat meat mar- ket mirrors itself in four layers of demand model: current demand, potential demand increase of current consumers, latent demand of new consumers, and seasonal demand. The US goat meat market isn’t trivial because seven- teen percent of consumers currently purchase goat meat. The lower income, the elder, and the ethnic groups com- prise the current goat meat niche market. The niche is expected to grow with more demographically homoge- nous immigrants from developing countries and the com- ing retirement of the “baby boom” generation. The incremental demand of current consumers and la- tent demand of consumers who never eat goat meat are likely to stimulate the expansion of the US goat meat market. Therefore, the growth potential is not driven just by the size of ethnic groups or the elder, but also by consumer preferences for healthy and safer attributes of goat meat. The provision of goat meat products with the attributes may define the fuure of the US goat meat t Copyright © 2013 SciRes. OPEN A CCESS  X. Liu et al. / Agricultural Sciences 4 (20 13) 549-557 556 Table 5. Seasonal demand and variables associated. Va riab l e Level Estimate Wald Statistics P-value OR Intercept 1 1.33 2.50 0.11 3.78 Price special* 1 0.59 3.22 0.07 1.80 Price special** 2 −1.25 4.09 0.04 0.29 Cholesterol level** 1 −-0.61 5.18 0.02 0.54 Cholesterol level 2 −0.22 0.23 0.62 0.80 Chicken consumption** 1 −1.56 4.67 0.03 0.21 Chicken consumption* 2 −1.35 3.38 0.06 0.26 Chicken consumption** 4 −3.39 5.69 0.01 0.03 Lamb consumption 1 −0.93 0.56 0.45 0.39 Lamb consumption 2 −0.41 0.56 0.45 0.66 Lamb consumption 4 0.34 2.31 0.12 1.40 Seafood consumption** 1 −0.13 0.17 0.67 0.88 Seafood consumption** 2 −0.67 4.97 0.02 0.51 Seafood consumption 4 −0.54 0.62 0.42 0.58 Gender*** 2 −0.88 6.16 0.00 0.41 Note: ***significant at the 0.01 level; **significant at the 0.05 level; *significant at the 0.10 level. industry. The seasonal demand is likely to keep its dominance in the US goat meat market for some time into the future. So far as the results of our study and findings of others, it is not readily available to have one-size-fits-all identi- fying the shift of the US goat meat market from a market of seasonal demand dominance into a market with a sta- ble year round demand. REFERENCES [1] USDA/Economic Research Service (2002) Changing con- sumer demands create opportunities for US food system. Food Review, 25, 19-22. [2] Menkhaus, D.J., Colin, D.P.M., Whipple, G.D. and Field, R.A. (1993) The effects of perceived product attributes on the perception of beef. Agribusiness, 9, 57-63. http://dx.doi.org/10.1002/1520-6297(199301)9:1<57::AI D-AGR2720090106>3.0.CO;2-8 [3] Grunert, K.G. (2005) Food quality and safety: Consumer perception and demand. European Review of Agricultural Economics, 32, 369-391. http://dx.doi.org/10.1093/eurrag/jbi011 [4] Piggott, N.E. and Marsh, T.L. (2004) Does food safety in- formation impact US meat demand? American Journal of Agricultural Economics, 86, 154-174. http://dx.doi.org/10.1111/j.0092-5853.2004.00569.x [5] Ellen, J.V.L., Caputo, V., Rodolfo, M., Jean-Francois, M. and Ricke, S.C. (2011) Consumers’ willingness to pay for organic chicken breast: Evidence from choice experiment. Food Quality and Preference, 22, 603-613. http://dx.doi.org/10.1016/j.foodqual.2011.02.003 [6] Gao, X.M. and Spreen, T. (1994) A micro-econometric analysis of the United States meat demand. Canadian Journal of Agricultural Economics, 42, 397-412. http://dx.doi.org/10.1111/j.1744-7976.1994.tb00033.x [7] Loureiro, M.L. and Umberger, W.J. (2007) Estimating con- sumer willingness to pay for country-of-origin labeling. Journal of Agricultural and Resource Economics, 28, 287-301. [8] Moschini, G. and Meilke, K.D. (1989) Modeling the pat- tern of structural change in US meat demand. American Journal of Agricultural Economics, 71, 253-261. http://dx.doi.org/10.2307/1241582 [9] Resurreccion, A.V.A. (2003) Sensory aspects of consumer choices for meat and meat products. Meat Science, 66, 11-20. http://dx.doi.org/10.1016/S0309-1740(03)00021-4 [10] Anaeto, M., Adeyeye, J.A., Chioma, G.O., Olarinmoye, A.O. and Tayo, G.O. (2010) Goat products: Meeting the challenges of human health and nutrition. Agriculture & Biology Journal of North America, 1, 1231-1236. http://dx.doi.org/10.5251/abjna.2010.1.6.1231.1236 [11] Babiker, S.A., Khider, E.L. and Shafie, S.A. (1990) Che- mical composition and quality attributes of goat meat and lamb. Meat Science, 28, 273-277. http://dx.doi.org/10.1016/0309-1740(90)90041-4 [12] Rhee, K.S., Myers, C.E. and Waldron, D.F. (2003) Consu- mer sensory evaluation of plain and seasoned goat meat and beef products. Meat Science, 65, 785-789. http://dx.doi.org/10.1016/S0309-1740(02)00283-8 [13] Dubeuf, J.P., Morand-Fehr, P. and Rubino, R. (2004) Si- tuation, changes and future of goat industry around the world. Small Ruminant Research, 51, 165-173. http://dx.doi.org/10.1016/j.smallrumres.2003.08.007 [14] Prinkerton, F.E., Escobar, N., Harwell, L. and Drinkwater, W. (1994) Marketing channels for meat goats in southern United States. Journal of Animal Science, 72, 49. Copyright © 2013 SciRes. OPEN A CCESS  X. Liu et al. / Agricultural Sciences 4 (20 13) 549-557 557 [15] Zachery, N. and Nelson, M. (1992) Consumers’ knowl- edge and use of goat products: An Atlanta case study. PAWC proceedings: Challenges in Agricultural and Rural Development, Tuskegee University, Tuskegee, 157-164. [16] Cochran, W.G. (1963) Sampling techniques, vol. 2. Wiley, New York. [17] Agresti, A. (2002) Categorical data analysis. Wiley, New York. http://dx.doi.org/10.1002/0471249688 [18] Greene, W.H. (2000) Models with discrete dependent va- riables. In: Greene, W.H., Ed., Econometric Analysis, Pren- tice-Hall, Upper Saddle River, 499-521. [19] Estrella, A. (1998) A new measure of fit for equations with dichotomous dependent variables. Journal of Busi- ness Economics and Statistics, 16, 198-205. [20] Hosmer Jr., D.W and Lemeshow, S. (2000) Applied logis- tic regression. 2nd Edition, John Wiley & Sons, Inc., New York. http://dx.doi.org/10.1002/0471722146 [21] Stokes, M.E., Davis, C.S. and Koch, G.G. (2000) Catego- rical data analysis using the SAS system. SAS Institute Inc., Cary. [22] Hocking, R.R. (1976) The analysis and selection of vari- ables in linear regression. Biometrics, 32, 1-49. http://dx.doi.org/10.2307/2529336 [23] Judge, G.G., Griffiths, W.E., Hill, R.C. and Lee, T.C. (1980) The theory and practice of econometrics. John Wiley & Sons, New York. [24] Wallace, T.D. (1977) Pretest estimation in regression: A survey. American Journal of Agricultural Economics, 59, 431-443. http://dx.doi.org/10.2307/1239645 Copyright © 2013 SciRes. OPEN A CCESS
|