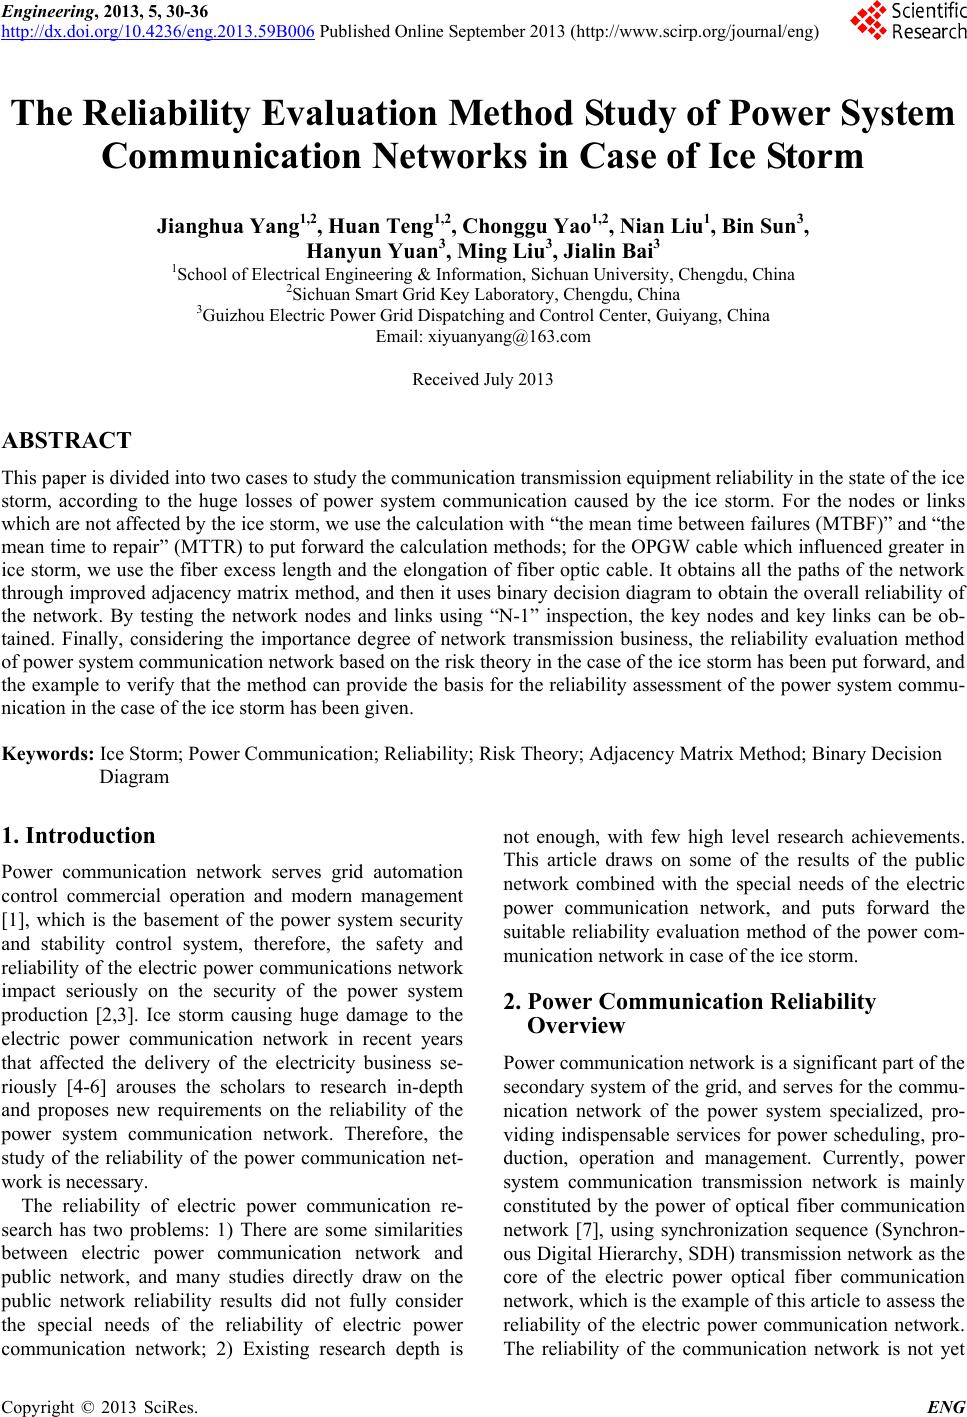
 Engineering, 2013, 5, 30-36 http://dx.doi.org/10.4236/eng.2013.59B006 Published Online September 2013 (http://www.scirp.org/journal/eng) Copyright © 2013 SciRes. ENG The Reliability Evaluation Method Study of Power System Communication Networks in Case of Ice Storm Jianghua Yang1,2, Huan Teng1,2, Chonggu Yao1,2, Nian Liu1, Bin Sun3, Hanyun Yuan3, Ming Liu3, Jialin Bai3 1School of Electrical Engineering & Information, Sichuan University, Chengdu, China 2Sichuan Smart Grid Key Laboratory, Chengdu, China 3Guizhou Electric Power Grid Dispatching and Control Center, Guiyang, China Email: xiyuanyang@163.com Received July 2013 ABSTRACT This paper is divided into two cases to study the communication trans mission equipment reliability in the state of the ice storm, according to the huge losses of power system communication caused by the ice storm. For the nodes or links which are not affected by the ice storm, we use the calculation w ith “the mean time between failures (MTBF)” and “the mean time to repair” (MTTR) to put forward the calculation methods; for the OPGW cable which influenced greater in ice storm, we use the fiber excess length and the elongation of fiber optic cable. It obtains all the paths of the network through improved adjacency matrix method, and then it uses binary decision diagram to obtain the overall reliability of the network. By testing the network nodes and links using “N-1” inspection, the key nodes and key links can be ob- tained. Finally, considering the importance degree of network transmission business, the reliability evaluation method of power system communication network based on the risk theory in the case of the ice storm has been put forward, and the example to verify that the method can provide the basis for the reliability assessment of the power system commu- nication in the case of the ice storm has been given. Keywords: Ice Storm; Pow er Communication; Reliability; Risk Theory; A djacency Matrix Method; Binary Decision Diagram 1. Introduction Power communication network serves grid automation control commercial operation and modern management [1], which is the basement of the power system security and stability control system, therefore, the safety and reliability of the electric power communic ations network impact seriously on the security of the power system production [2,3]. Ice storm causing huge damage to the electric power communication network in recent years that affected the delivery of the electricity business se- riously [4-6] arouses the scholars to research in-depth and proposes new requirements on the reliability of the power system communication network. Therefore, the study of the reliability of the power communication net- work is necessary. The reliability of electric power communication re- search has two problems: 1) There are some similarities between electric power communication network and public network, and many studies directly draw on the public network reliability results did not fully consider the special needs of the reliability of electric power communication network; 2) Existing research depth is not enough, with few high level research achievements. This article draws on some of the results of the public network combined with the special needs of the electric power communication network, and puts forward the suitable reliability evaluation method of the power com- munication network in case of the ice storm. 2. Power Communication Reliability Overview Power communication network is a significant part of the secondary system of the gr id, and serves for the commu- nication network of the power system specialized, pro- viding indispensable services for power scheduling, pro- duction, operation and management. Currently, power system communication transmission network is mainly constituted by the power of optical fiber communication network [7], using synchronization sequence (Synchron- ous Digital Hierarchy, SDH) transmission network as the core of the electric power optical fiber communication network, which is the example of this article to assess the reliability of the electric power communication network. The reliability of the communication network is not yet 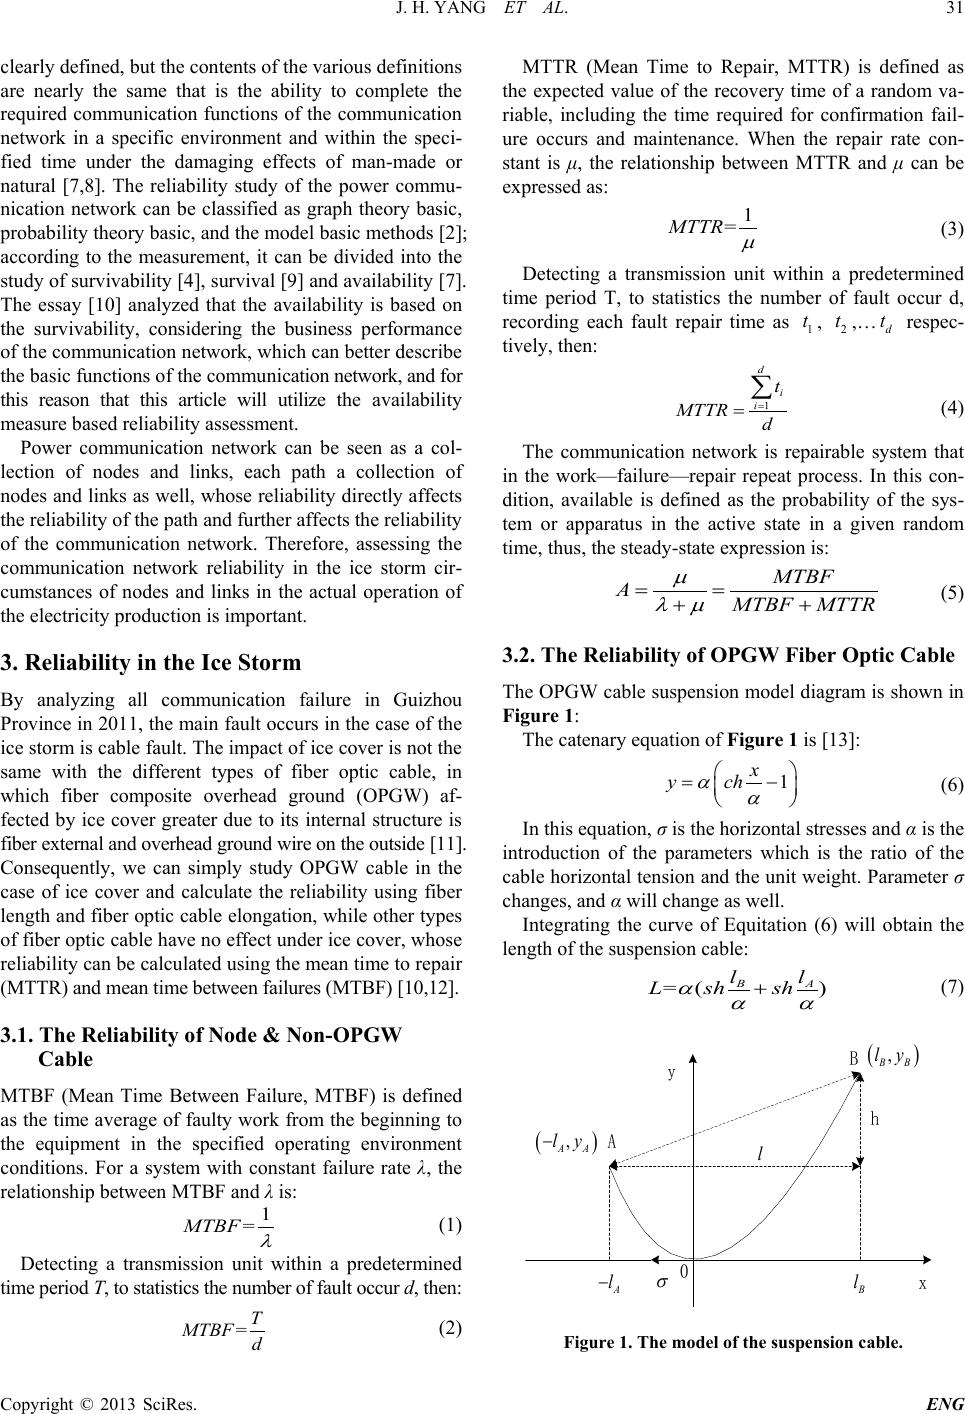 J. H. YANG ET AL. Copyright © 2013 SciRes. ENG clearly defined, but the contents of the various definitions are nearly the same that is the ability to complete the required communication functions of the communication network in a specific environment and within the speci- fied time under the damaging effects of man-made or natural [7,8]. The reliability study of the power commu- nication network can be classified as graph theory basic, probability theory basic, and the model basic methods [2]; according to the measurement, it can be divided into the study of survivability [4], survival [9] and availability [7]. The essay [10] analyzed that the availability is based on the survivability, considerin g the business performance of the communication network, which can better describe the basic functions of the communicati on network, and for this reason that this article will utilize the availability measure based reliability assessment. Power communication network can be seen as a col- lection of nodes and links, each path a collection of nodes and links as well, whose reliability di rectly affects the reliability of the pa th and further aff e cts the re liability of the communication network. Therefore, assessing the communication network reliability in the ice storm cir- cumstances of nodes and links in the actual operation of the electricity production is important. 3. Reliability in the Ice Storm By analyzing all communication failure in Guizhou Province in 2011, the main fault occurs in the case of the ice storm is cable fault. The impact of ice cover is not the same with the different types of fiber optic cable, in which fiber composite overhead ground (OPGW) af- fected by ice cover greater due to its internal structure is fiber external and overhea d ground wi re on t he outside [11]. Consequently, we can simply study OPGW cable in the case of ice cover and calculate the reliability using fiber length and fiber optic cable elongation, while other types of fiber optic cable have no effect under ice cover, whose reliability can be calculate d using the mean time to repair (MTTR) and mean time between failures (MTBF) [10,12]. 3.1. The Reliability of Node & Non-OPGW Cable MTBF (Mean Time Between Failure, MTBF) is defined as the time average of faulty work from the beginning to the equipment in the specified operating environment conditions. For a system with constant failure rate λ, the relationship between MTBF and λ is: (1) Detecting a transmission unit within a predetermined time period T, to statistics the number of fault occur d, then: (2) MTTR (Mean Time to Repair, MTTR) is defined as the expected value of the recovery time of a random va- riable, including the time required for confirmation fail- ure occurs and maintenance. When the repair rate con- stant is μ, the relationship between MTTR and μ can be expressed as: (3) Detecting a transmission unit within a predetermined time period T, to statistics the number of fault occur d, recording each fault repair time as , ,… respec- tively, then: (4) The communication network is repairable system that in the work—failure—repair repeat process. In this con- dition, available is defined as the probability of the sys- tem or apparatus in the active state in a given random time, thus, the steady-state expression is: (5) 3.2. The Reliability of OPGW Fiber Optic Cable The OPGW cable suspension model diagram is shown in Figure 1: The catenary equation of Figure 1 is [13]: (6) In this equation , σ is the horizontal stresses and α is th e introduction of the parameters which is the ratio of the cable horizontal tension and the unit weight. Parameter σ changes, and α will change as well. Integrating the curve of Equitation (6) will obtain the length of the suspension cable: (7) Figure 1. The model of the suspension cable. 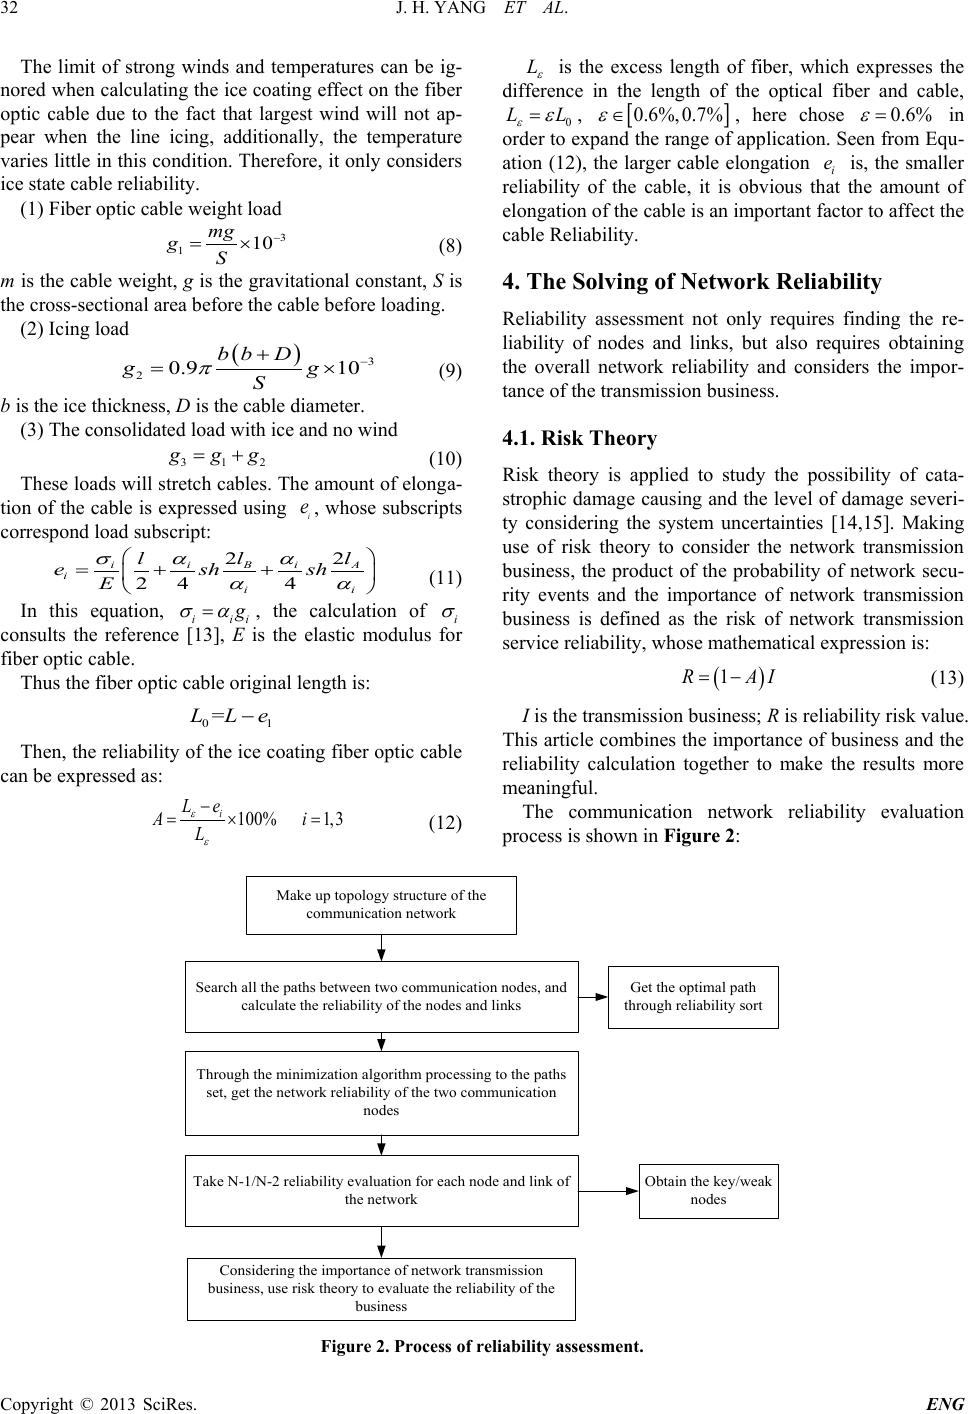 J. H. YANG ET AL. Copyright © 2013 SciRes. ENG The limit of strong winds and temperatures can be ig- nored when calculating the ice coating effect on the fiber optic cable due to the fact that largest wind will not ap- pear when the line icing, additionally, the temperature varies little in this condition. Therefore, it only considers ice state cable reliability. (1) Fiber optic cable weight load (8) m is the cable weight, g is the gravitational constant, S is the cross-sectional area before the cable before loading. (2) Icing loa d (9) b is the ice thickness, D is the cable diameter. (3) The consolidated load with ice and no wind (10) These loads will stretch cables. The amount of elonga- tion of the cable is expressed using , whose subscripts correspond load subscript: 22 24 4 ii i BA i ii ll l esh sh E σα α αα =++ (11) In this equation, , the calculation of consults the reference [13], E is the elastic modulus for fiber optic cable. Thus the fiber optic cable original length is: Then, the reliability of the ice coating fiber optic cable can be expressed as: (12) is the excess length of fiber, which expresses the difference in the length of the optical fiber and cable, , , here chose in order to expand the range of application. Seen from Equ- ation (12), the larger cable elongation is, the smaller reliability of the cable, it is obvious that the amount of elongation of the cable is an important factor to affect the cable Reliability. 4. The Solving of Network Reliability Reliability assessment not only requires finding the re- liability of nodes and links, but also requires obtaining the overall network reliability and considers the impor- tance of the transmission business. 4.1. Risk Theory Risk theory is applied to study the possibility of cata- strophic damage causing and the level of damage severi- ty considering the system uncertainties [14,15]. Making use of risk theory to consider the network transmission business, the product of the probability of network secu- rity events and the importance of network transmission business is defined as the risk of network transmission service reliability, whose mathematical expression is: (13) I is the transmission business; R is reliability r isk valu e. This article combines the importance of business and th e reliability calculation together to make the results more meaningful. The communication network reliability evaluation process is shown in Fi gure 2 : Search all the paths between two communication nodes, and calculate the reliability of the nodes and linksGet the optimal path through reliability sort Through the minimization algorithm processing to the paths set, get the network reliability of the two communication nodes Take N-1/N-2 reliability evaluation for each node and link of the network Obtain the key/weak nodes Considering the importance of network transmission business, use risk theory to evaluate the reliability of the business Make up topology structure of the communication network Figure 2. Process of reliability assessment. 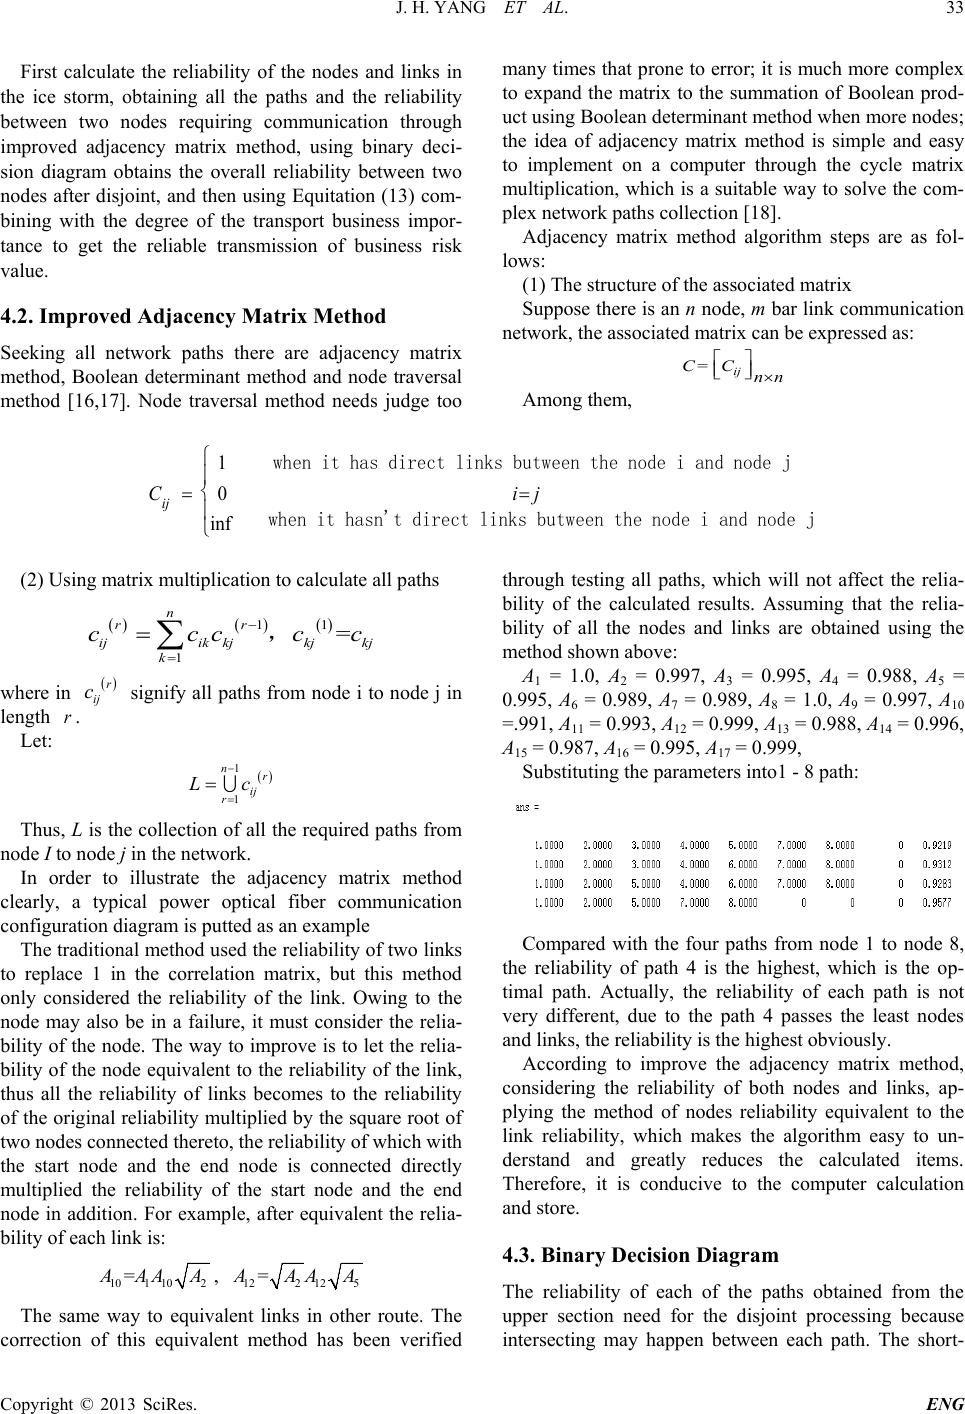 J. H. YANG ET AL. Copyright © 2013 SciRes. ENG First calculate the reliability of the nodes and links in the ice storm, obtaining all the paths and the reliability between two nodes requiring communication through improved adjacency matrix method, using binary deci- sion diagram obtains the overall reliability between two nodes after disjoint, and then using Equitation (13) com- bining with the degree of the transport business impor- tance to get the reliable transmission of business risk value. 4.2. Improved Adjacency Matrix Method Seeking all network paths there are adjacency matrix method, Boolean determinant method and node traversal method [16,17]. Node traversal method needs judge too many times that prone to error; it is much more complex to expand the matrix to the summation of Boolean prod- uct using Boolean determinant method when more nodes; the idea of adjacency matrix method is simple and easy to implement on a computer through the cycle matrix multiplication, which is a suitable way to solve the com- plex network paths collection [ 18 ]. Adjacency matrix method algorithm steps are as fol- lows: (1) The structure of the associated matrix Suppose there is an n node, m bar link communication network, the associated matrix can be expressed as: Among them, 1 0 inf ij C ij = = when it has direct links butween the node i and node j when it hasn't direct links butween the node i and node j (2) Using matrix multiplication to calculate all paths ()()( ) 11 1 = n rr ijik kjkjkj k cccc c − = =∑, where in ( ) r ij c signify all paths from node i to node j in length . Let: Thus, L is the collection of all the required paths from node I to node j in the network. In order to illustrate the adjacency matrix method clearly, a typical power optical fiber communication configuration diagram is putted as an example The traditional method used the reliability of two links to replace 1 in the correlation matrix, but this method only considered the reliability of the link. Owing to the node may also be in a failure, it must consider the relia- bility of the node. The way to improve is to let the r elia- bility of the node equivalent to the reliability of the link, thus all the reliability of links becomes to the reliability of the original reliability multiplied by the square root of two nodes connected thereto, the reliability of which with the start node and the end node is connected directly multiplied the reliability of the start node and the end node in addition. For example, after equivalent the relia- bility of each link is: , The same way to equivalent links in other route. The correction of this equivalent method has been verified through testing all paths, which will not affect the relia- bility of the calculated results. Assuming that the relia- bility of all the nodes and links are obtained using the method shown above : A1 = 1.0, A2 = 0.997, A3 = 0.995, A4 = 0.988, A5 = 0.995, A6 = 0.989, A7 = 0.989, A8 = 1.0, A9 = 0.997, A10 =.991, A11 = 0.993, A12 = 0.999, A13 = 0.988, A14 = 0.996, A15 = 0.987, A16 = 0.995, A17 = 0.999, Substituting the parameters into1 - 8 path: Compared with the four paths from node 1 to node 8, the reliability of path 4 is the highest, which is the op- timal path. Actually, the reliability of each path is not very different, due to the path 4 passes the least nodes and links, the reliability is the highes t obv iously. According to improve the adjacency matrix method, considering the reliability of both nodes and links, ap- plying the method of nodes reliability equivalent to the link reliability, which makes the algorithm easy to un- derstand and greatly reduces the calculated items. Therefore, it is conducive to the computer calculation and store. 4.3. Binary Decision Diagram The reliability of each of the paths obtained from the upper section need for the disjoint processing because intersecting may happen between each path. The short-  J. H. YANG ET AL. Copyright © 2013 SciRes. ENG coming of the formula method is large amount of com- putation when there are large the number of paths. The reference [7] utilizes the basic form of the reliability block diagram to construct power communication system equivalent model. Nevertheless, it is not easy to get the equivalent model for complex communication network, which can cause the reliability cannot be determined by several basic forms of formula. In this paper, the solution is to use the binary decision diagram, whose specific methods consult references [19,20]. Through this, path set disjoint can be calcu lated to calcu late the reliability of complex communication network. Figure 3 disjoint overall reliability is: 0. 982 3. 4.4. The Reliability Risk of Transmission Service Reference [8] uses analytic hierarchy process to quantita- tively assess the importance of power communication systems business. It utilizes real-time, efficacy and safety these three indicators to evaluate the degree of impor- tance among 5 types of business: relay protection busi- ness I1, security and stability business I2, auto business I3, scheduling business I4 and general business I5. The results are shown in the Table 1. Put the obtained reliability and operational degree of importance into the Equation (13), the reliability risk of a certain service is transmitted in the network can be ob- tained. 5. “N-1” Analysis of Network Power system “N-1” analysis method is applied to ana- lyze the reliability of electric power communication, in the case of the ice storm in this article, it gets the key nodes and key links by calculating the “N-1” reliability of every node and link, then directly expresses the as- sessment results through the bar chart. 32 1 4 5 67 8 9 10 11 12 13 14 15 16 17 Figure 3. Typical power communication structure. Table 1. The importance degree of transmission business. Business I1 I2 I3 I4 I5 The importance degree of business 0.356 0.282 0.155 0.163 0.046 5.1. “N-1” Analysis of the Same Business Communication network “N-1” principle can be unders- tood as follows: in normal operation mode (including planned maintenance), the event of a single failure of any one node or link in a network should not lead to the ab- normal operation of the main network and should not cause the network collapse. Doing “N-1” test for the network in Figure 3, the results are illustrated in Figu res 4 and 5. As can be seen from Fi gure 4: nodes 1,2,7 and 8 play the decisive role in the connection of the communication, that any node of this four is failure, node 1 and 8 will not be able to complete the communication. In addition, node 5 failure will lead to a decrease of 5.11% in reliability, which is the largest impact on the reliability of the com- munication; Seen from Figure 5, link 10 and 17 play the critical role in the communication, the failure on link 12 and 15 will make the reliability decreased by 2.24% and 2.08%, respectively. Figure 4. “N-1” reliability of node. Figure 5. “N-1” reliability of link.  J. H. YANG ET AL. Copyright © 2013 SciRes. ENG Therefore, the key to nodes for the structure of the network communication are 1, 2, 5, 7, 8; and the critical links are 10 , 12, 15, 17. 5.2. Comparison of Reliable Risk Value between Different Transmission Businesses Combining Equation (13) and Table 1, it can get reliable risk values on five business under the same conditions as shown. Figu re 6 shows the different business risk value under a certain condition, but the data in the figure are not very intuitive. In Figure 7, by comparing with the data of Figure 6 normalized, it is easy to see in the network re- liability 0.9823, the risk of business I1is the highest, which reach to 1.77%, while the minimum risk is busi- ness I5, only 0.22%. It reflects that the more important business is, the greater the risk of transmission under the same species conditions will be, in practice. In summary, through the risk analysis of the network reliability, the importance of each path transmission Figure 6. Risk value of different business. Figure 7. Normalized value at risk. business can be understood clearly, and the potential risk between two communication points can be seized at the mean time, as well as the impact generated by node or link failures of communication. In order to reduce the network risk, the network reliability must be improved. By calculating with the “N-1” reliability of the network to determine the critical nodes and links of the network, with additional protection and improvement, it is effec- tively to improve the reliability of the network using this method, which provides the evidence for the optimiza- tion and rectification of the power system communica- tion network. 6. Conclusion With the increasing development of the electric power industry, power system communication network becomes an important part of modern power systems, which are growing, developing and being improved, and p laying an increasingly important role. This article discusses the reliability of nodes and links in the communication net- work in the case of the ice storm. Considering the special requirements of the communication network, the risk- based reliability assessment method is proposed to pro- vide the evidence for the evaluation of the power com- munication network reliability in the case of the ice storm. Certainly, this study is not yet the end. Despite using the Matlab language preparation, it has not yet formed the man-machine interface and visualization module. Therefore the further research is needed. REFERENCES [1] L. J. Qin and Q. Y. Ma. “Intelligent Distribution Network and Its Key Technology,” China Electric Power Press, Beijing, 2010. [2] X. F. Xiong, J. J. Tian, J. Q. Zhou, et al., “Reliability Model Research of Electric Power Communication Sys- tem,” Relay, Vol. 35, No. 14, 2007, pp. 28-32. [3] Y. Zeng, “Power Communication Network Reliability Analysis and Evaluation Methods,” Telecommunication for Electric Power System, Vol. 32, No. 226, 2011, pp. 13-16. [4] Q. Gao, X. W. Liu and L. J. Qiu, “Emergency Communi- cation Network in Power System and Its Invulnerability Analysis,” Power System Technology, Vol. 33, No. 11, 2009, pp. 104-108. [5] Y. Hu, M. C. Dong and Y. D. Han, “Consideration of Information Security for Electric Power Industry,” Auto- mation of Electric Power Systems, Vol. 4, No. 10, 2002, pp. 1-4. [6] X. Yuan, “Discussion on Construction of Emergency Communication Network in Guizhou Power Grid,” Tele- communication for Electric Power System, Vol. 30, No. 196, 2009, pp. 37-41. [7] N. Z. Xing and H. F. Yan, “Research on the Reliability of  J. H. YANG ET AL. Copyright © 2013 SciRes. ENG Electric Power Telecommunication System,” Telecom- munication for Electric Power System, Vol. 28, No. 176, 2007, pp. 26-30. [8] A. H. Mohamed, K. Nicholas and H. Sayed, “Towards a Standardized Terminology for Network Performance,” IEEE Transactions on Reliability, Vol. 57, No. 2, 2008, pp. 267-271. http://dx.doi.org/10.1109/TR.2008.920800 [9] P. Deng, X. Peng, L. F. Tian, et al ., “Survivability Analy- sis of Power System Information Network Bases on Connectivity,” Engineering Journal of Wuhan University, Vol. 43, No. 6, 2010, pp. 792-795 . [10] X. X. Li, W. Zheng and Q. Liu, “Program Development on Index Evaluation for Inherent Reliability,” Electronic Communications and Control (ICECC), 2011, pp. 3844- 3847. [11] X. H. Chen, J. H. Huang, J. M. Zhang, et al. , Telecommu- nication for Electric Power System, Vol. 29, No. 191, 2008, pp. 8-13. [12] J. A. Dzekevich and J. Garretson, “A Design Margin Index for MTBF and Ao,” Reliability and Maintainability Symposium, Vol. 22, No. 25, 2007, pp. 288-291. [13] W. A. Chisholm, J. P. Levine and P. Chowdhuri, “Lightning Arc Damage to Optical Fiber Ground Wires (OPGW): Parameters and Test Methods,” Power Engi- neering Society Summer Meeting, Vol. 1, No. 1, 2001, pp. 88-93. [14] R. X. Liu, J. H. Zhang and D. Wu, “Research on Static Security Index of Distribution Network Based on Risk Theory,” Power System Protection and Control, Vol. 39, No. 15, 2011, pp. 89-95. [15] W. H. Chen, Q. Y. Jiang and Y. J. Cao, “Risk Assessment of Power System Cascading Failure Considering Hidden Failures of Protective Relayings,” Power System Tech- nology, Vol. 30, No. 13, 2006, pp. 14-19. [16] Y. Zhou, B. X. Zhou and Y. Xing, “Graphical Power Network Topology Analysis Based on Adjacengcy Ma- trix,” Power System Protection and Control, Vol. 37, No. 17, 2009, pp. 49-52. [17] F. S. Dai, “Objective Evaluation Method of Significance of Nodes Links in Communication Network,” Journal of Nanjing University of Science and Technology, Vol. 30, No. 6, 2006, pp. 748-753. [18] Y. F. Shi, N. Lu and H. M. Li, “An Algorithm of Network System Reliability Based on an Improved Disjointed Mi- nimal Path Set,” Computer Engineering and Science, Vol. 33, No. 1, 2011, pp. 30-35. [19] D. K. Li, “New Algorithm for Computing Network Sys- tem Reliability,” Communications Technology, Vol. 42, No. 11, 2009, pp. 149-151. [20] M. Q. Wang, H. B. Yu and H. Wang, “Overview on the Research of Binary Decision Diagrams Optimization,” Information and Control, Vol. 33, No. 5, 2004, pp. 567-572.
|