 Engineering, 2013, 5, 24-29 http://dx.doi.org/10.4236/eng.2013.59B005 Published Online September 2013 (http://www.scirp.org/journal/eng) Copyright © 2013 SciRes. ENG Load Cluster Characteristic Analysis and Modeling of Electric Vehicles Dan Zeng1, Ke Wang1, Yaping Li1, Xiaorui Guo1, Xiao Jiang2 1China Electric Power Research Institute, Nanjing 210003, China 2State Grid Electric Power Research Institute, Nanjing 210003, China Email: zengdan@epri.sgcc.com.cn Received June 2013 ABSTRACT Electric vehicle, as a clean en e rgy industry, is an important branch. Electric vehicles not only are the energy of the elec- tric user , but also can be used as mobile and distributed energy storage unit to the grid. As a precondition of safety op- eration for power grid, stu dies of EVs’ charging load characteristics is also the theoretical basis of intelligent sche duling EVs charging orderly. This paper assesses the future of the electric vehicles development prospects, and secondly esta b- lishes a charging model of a single EV. Then, considering stochastic distribution of the initial state-of-charge (SOC0) and the arriving time of the vehicles, a clus ter model of the charging station is proposed. Meanwhile, the paper from the types and charging mode of electric vehicles analyzes the behavior of EV. Finally, an exampl e simulation is validated. Keywords: Electric Vehicle; Potential of Development; Charging Mode; Cluster Characteristic; Poisson Distribution 1. Introduction Electric vehicle, as a clean energy industry, is an impor- tant branch. Electric vehicles not only are the energy of the electric user, but also can be used as mobile and dis- tributed energy storage unit to the grid. Compared with other loads, electric vehicles will not only be able to play a better role in load shifting, but also as a system of spin- ning reserve. However, a large number of electric ve- hicles charging will significantly increase the disorderly distribution system losses and damage power qua lity. Conversely, if the charging of electric vehicles coordi- nated control behavior, you can make disadvantages into advantages, reduce system peak load needs, and substan- tially reduce the negative impact. At presen t, the load characteristic of electric cars is still very lacking. Mos t researches are focused on the battery charge and discharge characteristics and power harmonics problems. The generic battery model under considering dynamic response, the phenomenon of self- discharge, and temperature and other factors [1-5] has been studied a lot. The r esearc h of power harmonic fo- cuses on the characteristics of a single charger and mod- eling [6-11]. However, in more sophisticated smart grid system, electric vehicles will be used as bidirectional energy trader, in the valley of charge when grid electricity pur- chased at low energy, to meet their own need to use; sold at high prices when the peak load electricity or act as a backup power supply to obtain profits. It not only can eliminate large grid electric vehicles negative impact, but also can be a large number of electric vehicles as a flexi- ble load utilized to improve the system operation. This requires a study of charging agglomeration characteris- tics with random characteristics of large-scale electric vehicles and the electric vehicles charging lo a d curve. This paper assesses the future of the electric vehicles development prospects, and secondly establishes a charg- ing model of a single EV. Then, considering stochastic distribution of the initial state-of-charge (SOC0) and the arriving time of the vehicles, a cluster model of the charging station is proposed. Meanwhile, the paper, from the types and charging mode of electric vehicles , analyzes the behavior of EV. Finally, an example simulation is validated. 2. Charging Modes of Electric Vehicles The report is expected that by 2015 the number electric vehicles will reach 500,000, by 2020, reaching 5,000,000. While in 2030, the electric car ownership is expected to reach 68 million or so. 2.1. Types of Electric Vehicles Through the analysis of China’s electric vehicle devel- opment, as well as some provinces and cities with the national release of the electric vehicle development plan, it sums up the future development trend of China’s elec-  Z. DAN ET AL. Copyright © 2013 SciRes. ENG tric car substantially: 2010-2015, electric vehicles mainly in buses, official cars, taxis in demonstration; 2016-2020 in the public transport system, public service vehicles to achieve scale operation electric vehicles, privat e cars less; 2021-2030, to accelerate the development of electric cars, the proportion has increased. Chinese main types of elec- tric are vehicles bus e s, taxis, public ser vi c e vehicles, private cars. 2.2. Charging Mode Charging mo des of electric vehicles can be divided into slow charging (Charging mode L1), normal charge (Charging mode L2), fast charge (Charging mode L3), as shown in Table 1. 3. The Behavior Features of the Electric Vehicles 3.1. Behavior Characteristics o f Pure Electric Bus 1) Driving d istan ce According to relevant data statistics in 2012, Tianjin buses, on average, each rou te mileag e of 19.5 km. So, this article assumes that each single pure electr ic bus car mileage in obedience expected value is 19.5 km mean square error is within 5 km of normal distr ibu tion, the speed of 25 k m/h . 2) Charg ing mode Charg ing time of slow charging mode is longer, and not suitable for trave l frequen tly pure elec tr ic bus; And quick charge although greatly shorten the charging time, it can bring gre ater impact to power grid, such as 10 minutes to finish 35 kWh batter y requ ires 210 kW power charging. The batter y life would also be affected. At present, Tianjin way of pure electric bus to replace the batter y is given priority to , the change in power inadequ ate batter y, fully charg ed b a tter y, only a f ew minutes to complete this process. Based on the above an alysi s, irre spe ct ive of the pure electr ic bus battery case, assume that their way of uni- fied use to rep lace the batter y. Ensure bus can rep lace the batter y in time to complete, as suming that bus sta- tion and the terminal are equipped with in power p lant, and have enough batter ies can be replaced. According to Shanghai, Chengdu and other cities of pure electric bus operating experience, assu ming th at when elec tr ic cars arrive in plant power status is lower than 30% or not enough to complete the next single, it is necessar y to replace th e b at ter y, rep lace th e ba tter y from charging in plant arrangemen t. In addition, bus operation time, place, relatively concentrated, charging can be concen- trated in the existing park ing lot construction of charg- ing facilities. 3) Charg ing t ime scale Assume that pure elec tr ic bus operating time is 8:00 am to 6 PM, buses may at any time during the battery discharg ed ba tter y is low. It is assumed that in power station operating 24 hours a day, 24 hours a day to re- place the batter y to charge. 3.2. Behavior Characteristics o f Private Electric Vehicles Unlike buses, private cars are mainly used for commut- ing, average run twice a day, so the private car time con- nected to the electricity grid can be divided into the day and night in the home two hours in the company, resp ec- tively, to consider its behavioral characteristics. 1) Driving d istan ce A day’s t ravel journey of Private cars is between 40 km and 60 km, and supposed to work during the day and evening work schedule are equal, then the single range evenly distributed between 20 km and 30 km. 2) Charg ing mode Whether parked or residence in the company parking lot, private car longer than the time grid, generally do not need fast charging, using slow charging or battery re- placement approach is more reasonable choice, so here taking private cars with a slow fast charge and replace the battery in two ways. Slow charging for the use of private cars, assuming their ownership in the company parking lot and are building a sufficient number of charging facilities, the user can always access to the grid for charging; way to take a private car to replace the bat- tery, and the front right Similar assumptions buses, if their berthing places remaining in the battery status is below 30%, or insufficient to complete the next stroke, the user must replace the battery, replace the battery down by the charging arrangements for power plants. Table 1. Comparison of different charging modes of plug-in electric vehicles in China. Charging modes Rated voltage/V Rated Current/A Application areas L1 Single-phase 220 16 Household 2-1 L2 2-2 2-3 Single-phase 220 Three-phase 380 Three-phase 380 32 32 63 Shopping malls, Parking lots L3 600 300 Motorway service area, Charging stations, etc. 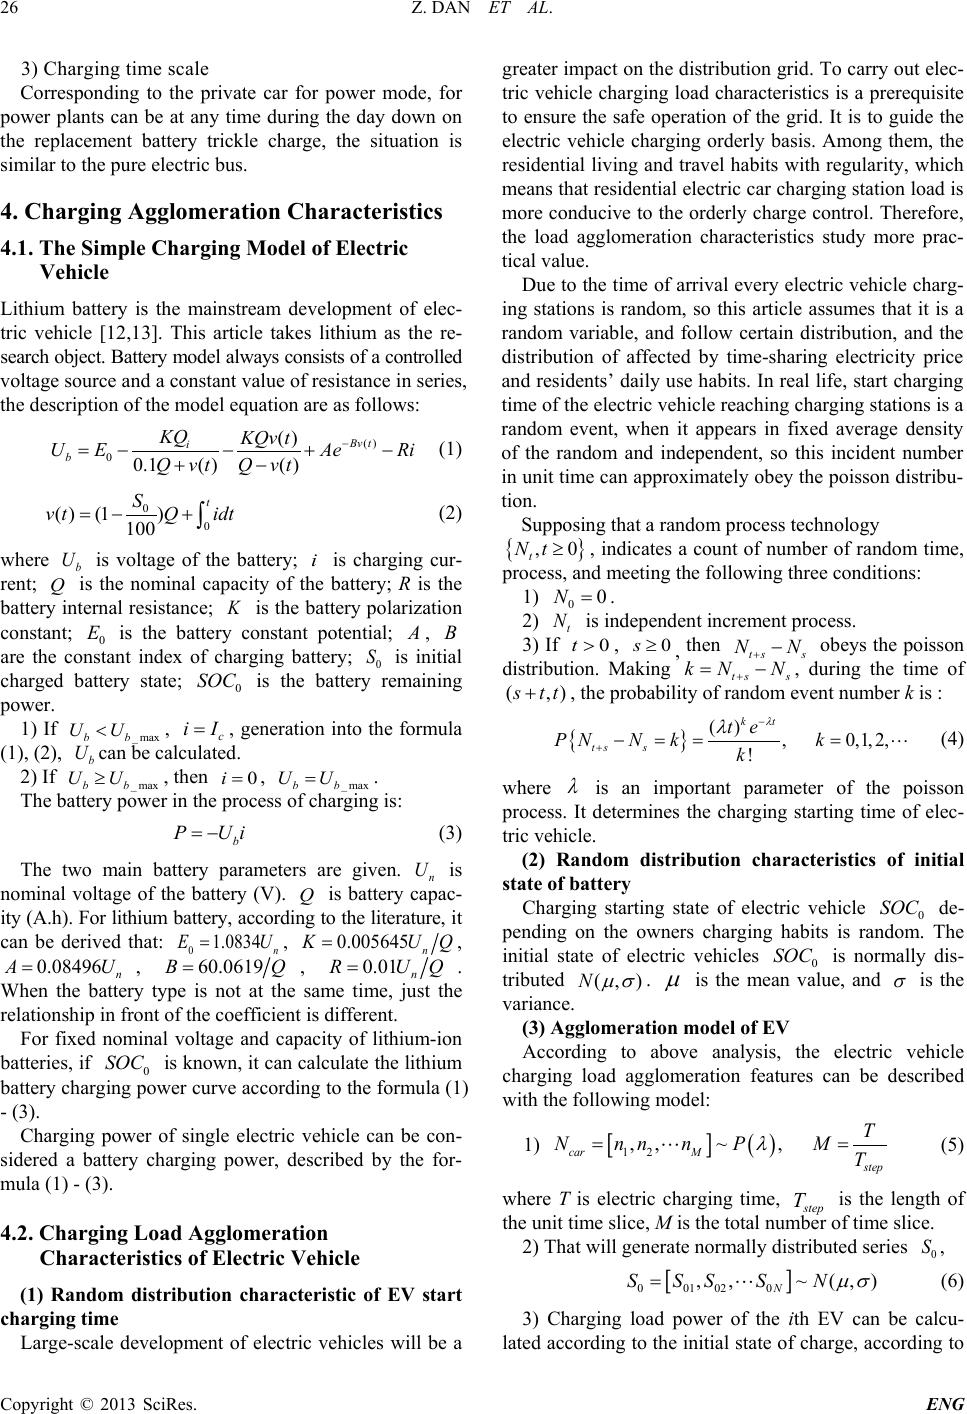 Z. DAN ET AL. Copyright © 2013 SciRes. ENG 3) Charg ing t ime scale Corresponding to the private car for power mode, for power plants can be at any time during the day down on the replacement battery trickle charge, the situation is similar to the pure electric bu s. 4. Charging Agglomeration Characteristics 4.1. The Simple Charging Model of Electric Vehicle Lithium battery is the mainstream development of elec- tric vehicle [12,13]. This article takes lithium as the re- search object. Battery mod e l always consists of a co n tro lled voltage source and a constant value of resistance in series, the description of the model equation are as foll ow s: () 0 () 0.1( )( ) Bv t i b KQ KQv t U EAeRi Q vtQ vt − =−− +− +− (1) (2) where is voltage of the battery; is charging cur- rent; is the nominal capacity of the battery; R is the battery internal resistance; is the battery polarization constant; is the battery constant potential; , are the constant index of charging battery; is initial charged battery state; is the battery remaining power. 1) If , , generation into the formula (1), (2), can be calculated. 2) If , then , . The battery power in th e process of charging is: (3) The t wo main battery par ame t e rs are given. is nominal voltage of the battery (V). is battery capac- ity (A.h). For lithium battery, according to the literature, it can be deriv ed that: , , , , . When the battery type is not at the same time, just the relationship in front of the coefficient is different. For fixed nominal voltage and capacity of lithium-ion batteries, if is known, it can calculate the lithium battery charging power curve according to the formula (1) - (3). Charging powe r of single electric vehicle can be con- side red a battery charging power, described by the for- mula (1) - (3). 4.2. Charging Load Agglomeration Characteristics of Electric Vehicle (1) Random distribution characteristic of EV start charging time Large-scale development of electric vehicles will be a greater impact on the distribution grid. To carry out elec- tric vehicle charging load characteristics is a prerequisite to ensure the safe operation of the grid. It is to guide the electric vehicle charging orderly basis. Among them, the residential living and travel habits with regularity, which means that residential electric car charging station load is mor e conducive to the orderly charge control. Therefore, the load agglomeration characteristics study more prac- tical value. Due to the time of arrival every elec tric vehicle charg- ing stations is random, so this article assumes that it is a random variable, and follow certain distribution, and the distribution of affected by time-sharing electricity price and residents’ daily use habits. In real life, start charging time of the electric vehicle reaching charging stations is a random event, when it appears in fixed average density of the random and independent, so this incident number in unit time can approximately obey the poisson distr ibu- tion. Supposing that a random process technology , indicates a count of number of random time, process, and meeting the following three conditions: 1) . 2) is independent increment process. 3) If , , then obeys the poisson distribution. Making , during the time of ( ,)s tt+, the probability of random event number k is : { } () , 0,1,2, ! kt ts s te PNN kk k λ λ − + −=== (4) where is an important parameter of the poisson process. It determines the charging starting time of elec- tric vehicle. (2) Rand om distribution characteristics of initial state of battery Charging starting state of electric vehicle de- pending on the owners charging habits is random. The initial state of electric vehicles is normally dis- tributed . is the mean value, and is the variance. (3) Agglomeration model of EV According to above analysis, the electric vehicle charging load agglomeration features can be described with the following model: 1) [ ] ( ) 12 ,,~ , car Mstep T NnnnPM T λ = = (5) where T is electric charging time, is the length of the unit time slice, M is the total number of time slice. 2) That will generate normally distributed series , [ ] 001 020 ,,~ (,) N S SSSN µσ = (6) 3) Charging load power of the ith EV can be calcu- lated according to the initial state of charg e, according to 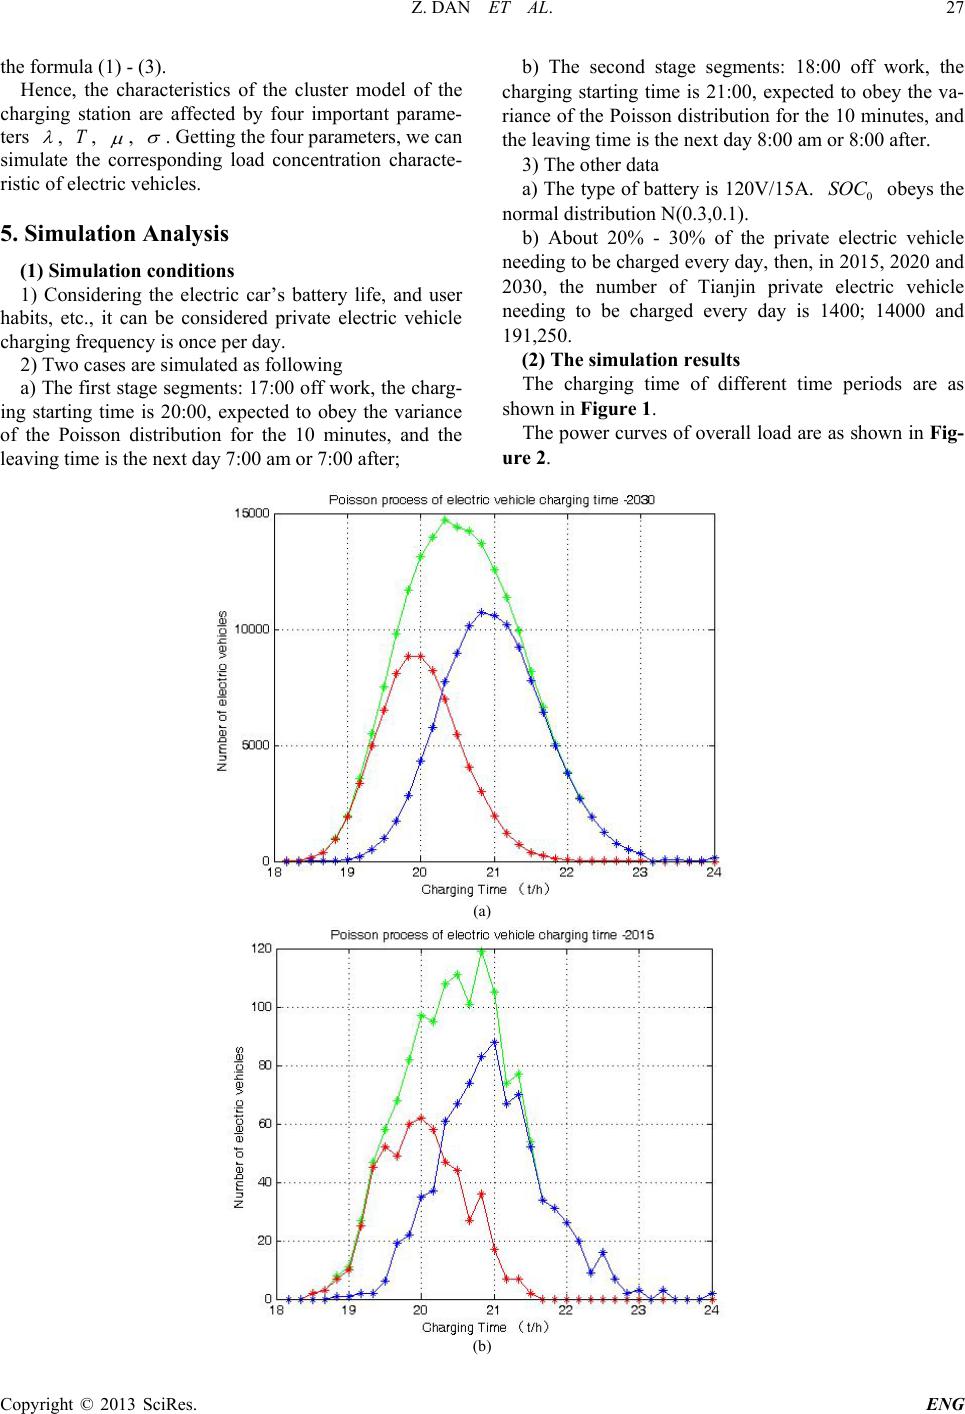 Z. DAN ET AL. Copyright © 2013 SciRes. ENG the formula (1) - (3). Hence, the characteristics of the cluster model of the charging station are affected by four important parame- ters , , , . Getting the four parameters, we can simulate the corresponding lo ad concentration charac t e- ristic of electric vehicles. 5. Simulation Analysis (1) Simulation conditions 1) Considering the electric car’s battery life, and user habits, etc. , it can be considered private electric vehicle charging frequency is once per day. 2) Two cases are simulated as following a) The first stage segments: 17:00 off work, the char g- ing starting time is 20:00, exp e c t ed to obey the variance of the Poisson distribution for the 10 minutes, and the leaving time is the next day 7:00 am or 7:00 after; b) The second stage segments: 18:00 off work, the charging starting time is 21:00, expe cted to obey the va- riance of the Poisson distribution for the 10 minutes, and the leaving time is the next day 8:00 am or 8:00 after. 3) The other data a) The type of battery is 120V/15A. obeys the normal distribution N(0 .3,0 .1 ). b) About 20% - 30% of the private electric vehicle needing to be charged ever y day, then, in 2015, 2020 and 2030, the number of Tianjin private electric vehicle needing to be charged every day is 1400; 14000 and 191,250. (2) The sim ulat ion results The charging time of diffe ren t time periods are as shown in Figure 1. The pow er curves of overall load are as shown in Fig- ure 2. (a) (b) 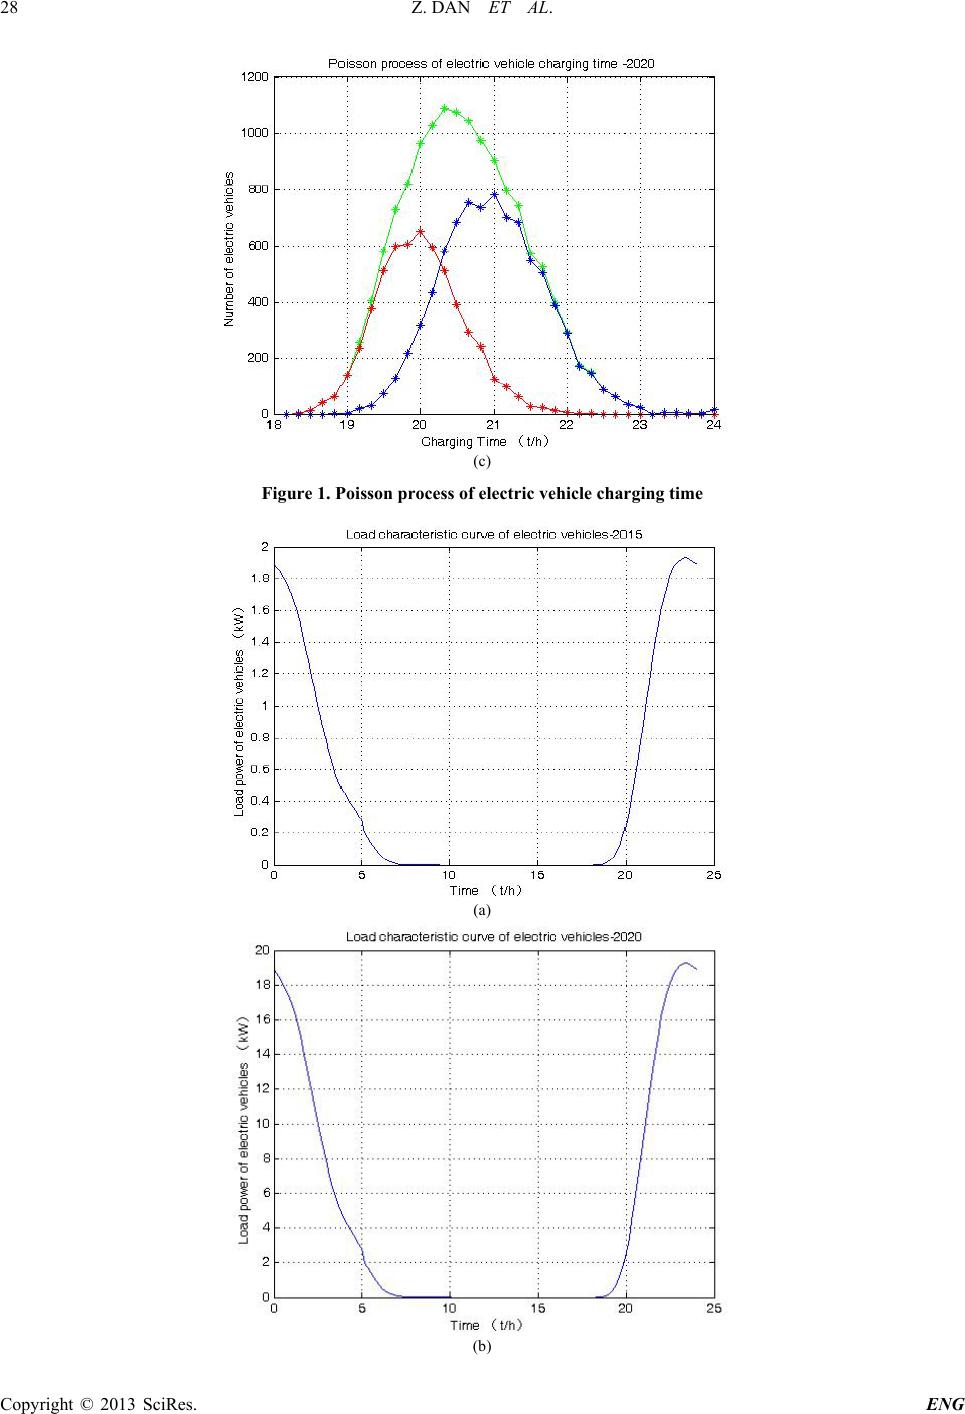 Z. DAN ET AL. Copyright © 2013 SciRes. ENG (c) Figure 1. Poisson process of electric vehicle charging ti me (a) (b) 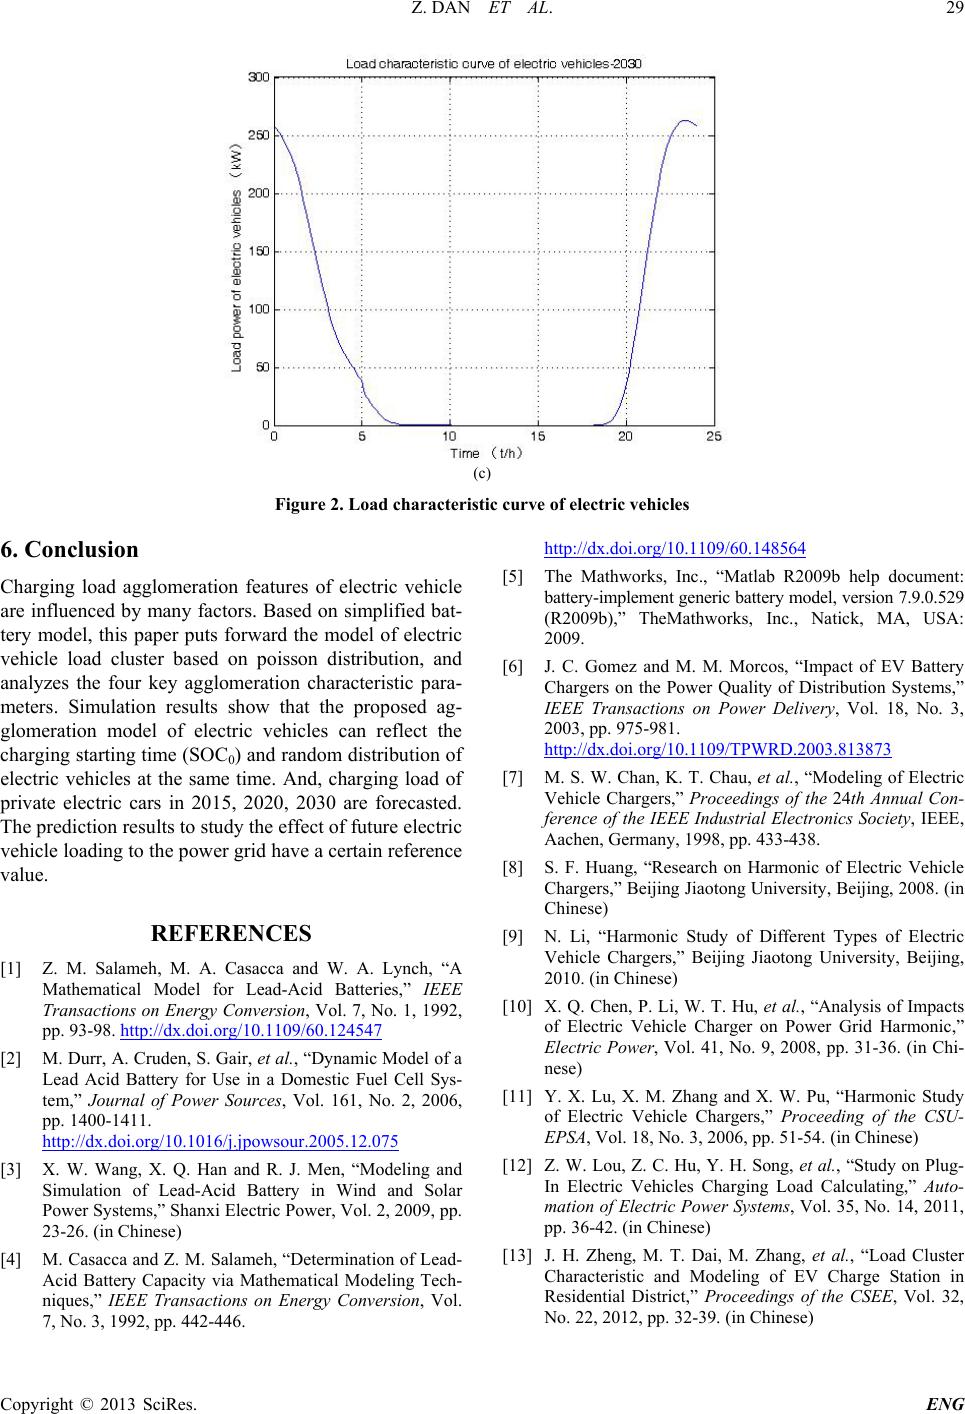 Z. DAN ET AL. Copyright © 2013 SciRes. ENG (c) Figure 2. Load characteristic curve of electric vehicles 6. Conclusion Charging load agglomeration features of electric vehicle are influenced by many factors. Bas ed on simplified bat- tery model, this paper puts forward the model of electric vehicle load cluster based on poisson distribution, and analyzes the four key agglomeration characteristic para- meters. Simulation results sh o w that the proposed ag- glomeration model of electric vehicles can reflect the charging starting time (SOC0) and random distribution of electric vehicles at the same time. And, charging load of private electric cars in 2015, 2020, 2030 are forecasted. The prediction resu lts to study the effect of future electric vehicle loading to the power grid have a certain reference value. REFERENCES [1] Z. M. Salameh, M. A. Casacca and W. A. Lynch, “A Mathematical Model for Lead-Acid Batteries,” IEEE Transactions on Energy Conversion, Vol. 7, No. 1, 1992, pp. 93-98. htt p://dx.doi.org/10.1109/60.124547 [2] M. Durr, A. Cruden, S. G a i r, et al., “Dy nami c Model of a Lead Acid Battery for Use in a Domestic Fuel Cell Sys- tem,” Journal of Power Sources, Vol. 161, No. 2, 2006, pp. 1400-1411. http://dx.doi.org/10.1016/j.jpowsour.2005.12.075 [3] X. W. Wang, X. Q. Han and R. J. Men, “Modeling and Simulation of Lead-Acid Battery in Wind and Solar Power Sy stem s,” Shanxi Electric Power, Vol. 2, 2009, pp. 23-26. (in Chinese) [4] M. Casacca and Z. M. Salameh, “Determination of Lead- Acid Battery Capacity via Mathematical Modeling Tech- niques,” IEEE Transactions on Energy Conversion, Vol. 7, No. 3, 1992, pp. 442-446. http://dx.doi.org/10.1109/60.148564 [5] The Mathworks, Inc., “Matlab R2009b help document: battery-imple ment generic battery model, version 7.9.0.529 (R2009b),” TheMathworks, Inc., Natick, MA, USA: 2009. [6] J. C. Gomez and M. M. Morcos, “Impact of EV Battery Chargers on the Power Quality of Distribution Systems,” IEEE Transactions on Power Delivery, Vol. 18, No. 3, 2003, pp. 975-981. http://dx.doi.org/10.1109/TPWRD.2003.813873 [7] M. S. W. Chan, K. T. Chau, et al., “Modeling of Electric Vehicle Chargers,” Proceedings of the 24th Annual Con- ference of the IEEE Industrial Electronics Society, IEEE, Aachen, Germany, 1998, pp. 433-438. [8] S. F. Huang, “Research on Harmonic of Electric Vehicle Chargers,” Beijing Jiaotong University, Beijing, 2008. (in Chinese) [9] N. Li, “Harmonic S t ud y of Different Types of Electric Vehicle Chargers,” Beijing Jiaotong University, Beijing, 2010. (in Chinese) [10] X. Q. Chen, P. Li, W. T. Hu, et al., “Analysis of Impacts of Electric Vehicle Charger on Power Grid Harmonic,” Electric Power, Vol. 41, No. 9, 2008, pp. 31-36. (in Chi- nese) [11] Y. X. Lu, X. M. Zhang and X. W. Pu, “Harmonic Study of Electric Vehicle Chargers,” Proceeding of the CSU- EPSA, Vol. 18, No. 3, 2006, pp. 51-54. (in Chinese) [12] Z. W. Lou, Z. C. Hu, Y. H. Son g , et al., “Study on Plug- In Electric Vehicles Charging Load Calculating,” Auto- mation of Electric Power Systems, Vol. 35, No. 14, 2011, pp. 36-42. (in Chinese) [13] J. H. Zheng, M. T. Dai, M. Zhang, et al., “Load Cluster Characteristic and Modeling of EV Charge Station in Residential District,” Proceedings of the CSEE, Vol. 32, No. 22, 2012, pp. 32-39. (in Chinese)
|