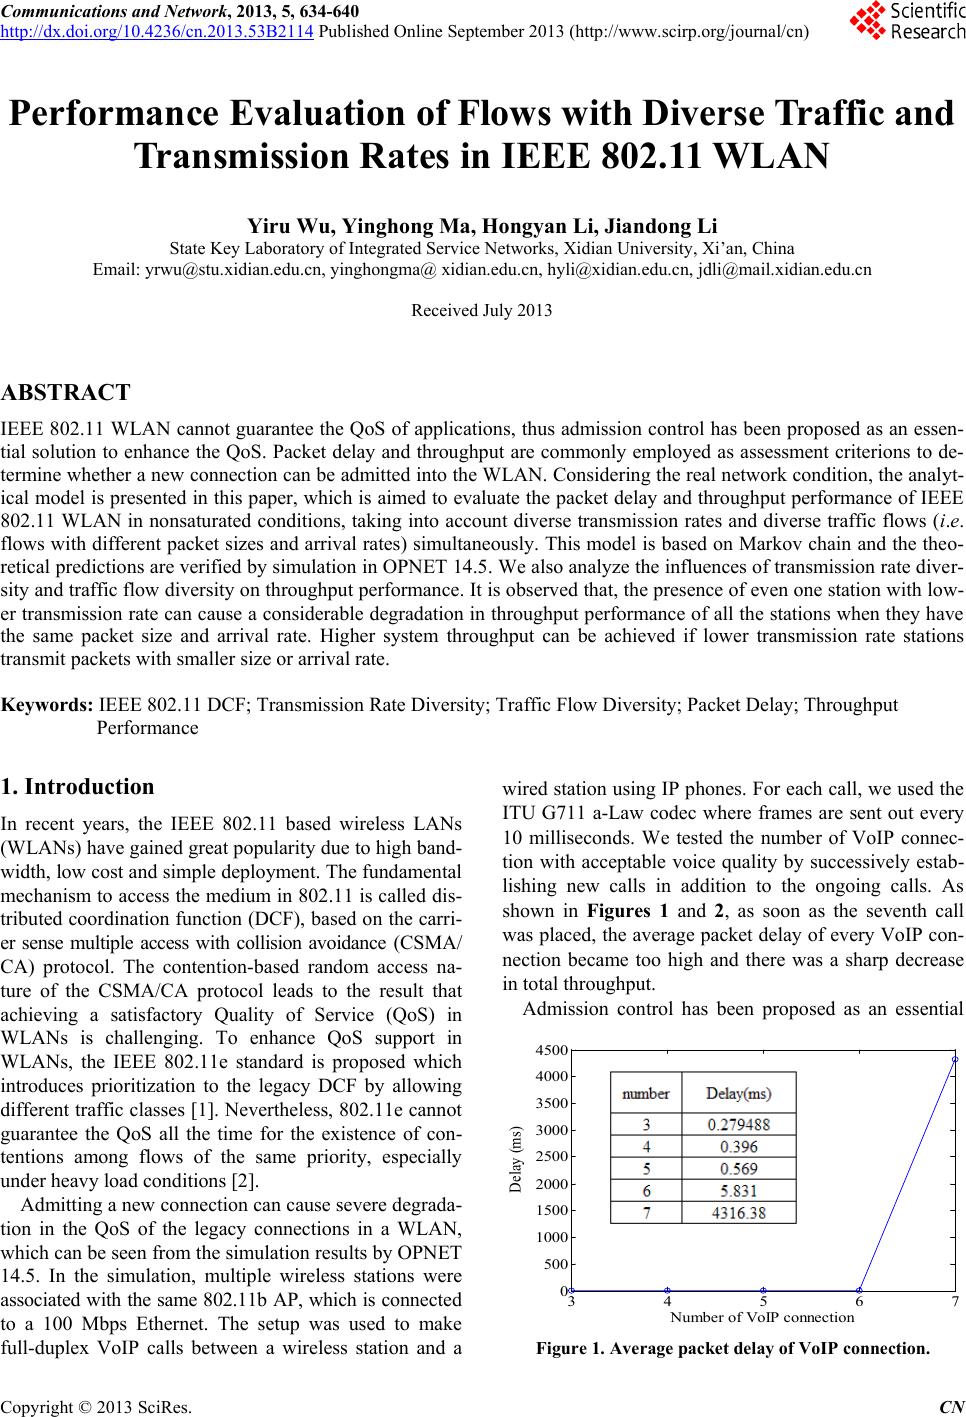
 Communications and Network, 2013, 5, 634-640 http://dx.doi.org/10.4236/cn.2013.53B2114 Published Online September 2013 (http://www.scirp.org/journal/cn) Copyright © 2013 SciRes. CN Performance E valu a tion of Fl o ws with Di vers e Traffic and Transmission Rates in IEEE 802.11 WLAN Yiru Wu, Yinghong Ma, Hongyan Li, Jiandong Li State Key Laboratory of Integrated Service Networks, Xidian University, Xi’an, China Email: yrwu@stu.xi dian.edu.c n, yinghongma@ xidian.edu.cn, hyli@xidian.edu.cn, jdli@mail.xidian.edu.cn Received July 2013 ABSTRACT IEEE 802.11 WLAN cannot guarantee the QoS of applications, thus admission control has been proposed as an essen- tial solution to enhance the QoS. Packet delay and throughput are commonly employed as assessment criterions to de- termine whether a new connection can be admitted into the WLAN. Considering the real network condition, the analyt- ical model is presented in this paper, which is aimed to evaluate the packet delay and throughput performance of IEEE 802.11 WLAN in nonsaturated conditions, taking into account diverse transmission rates and diverse traffic flows (i.e. flows with differ ent packet sizes and arrival rates) simultaneously. This model is based on Markov chain and the theo- retical predictions are verified by simulation in OPNET 14.5. We also analyze the influences of transmission rate diver- sity and traffic flow div ersity on th roughput performance. It is observed that, the presence of even one station with low- er transmission rate can cause a considerable degradation in throughput performance of all the stations when they have the same packet size and arrival rate. Higher system throughput can be achieved if lower transmission rate stations transmit packets with smaller size or arrival rate. Keywords: IEEE 802.11 DCF; Transmission Rate Diversity; Traffic Flow Diversity; Packet Delay; Throughput Performance 1. Introduction In recent years, the IEEE 802.11 based wireless LANs (WLANs) have gained great popularity due to high band- width, low cost and simple deployment. The fundamental mechanism to access the medium in 802.11 is called dis- tributed coordination function (DCF), based on the carri- er sense multiple access with collision avoidance (CSMA/ CA) protocol. The contention-based random access na- ture of the CSMA/CA protocol leads to the result that achieving a satisfactory Quality of Service (QoS) in WLANs is challenging. To enhance QoS support in WLANs, the IEEE 802.11e standard is proposed which introduces prioritization to the legacy DCF by allowing different traffic classes [1]. Nevertheless, 802.11e cannot guarantee the QoS all the time for the existence of con- tentions among flows of the same priority, especially under heavy load conditions [2]. Admitting a new connection can cause severe degrada- tion in the QoS of the legacy connections in a WLAN, which can be seen from the simulation results by OPNET 14.5. In the simulation, multiple wireless stations were associated with the same 802.11b AP, which is connected to a 100 Mbps Ethernet. The setup was used to make full-duplex VoIP calls between a wireless station and a wired station using IP phones. For each call, we used the ITU G711 a-Law codec where frames are sent out every 10 milliseconds. We tested the number of VoIP connec- tion with acceptable voice quality by successively estab- lishing new calls in addition to the ongoing calls. As shown in Figures 1 and 2, as soon as the seventh call was placed, the average packet delay of every VoIP con- nection became too high and there was a sharp decrease in total throughput. Admission control has been proposed as an essential Figure 1. Average packet delay of VoIP connection. 34567 0 500 1000 1500 2000 2500 3000 3500 4000 4500 Number of VoIP connection Dela y (ms ) 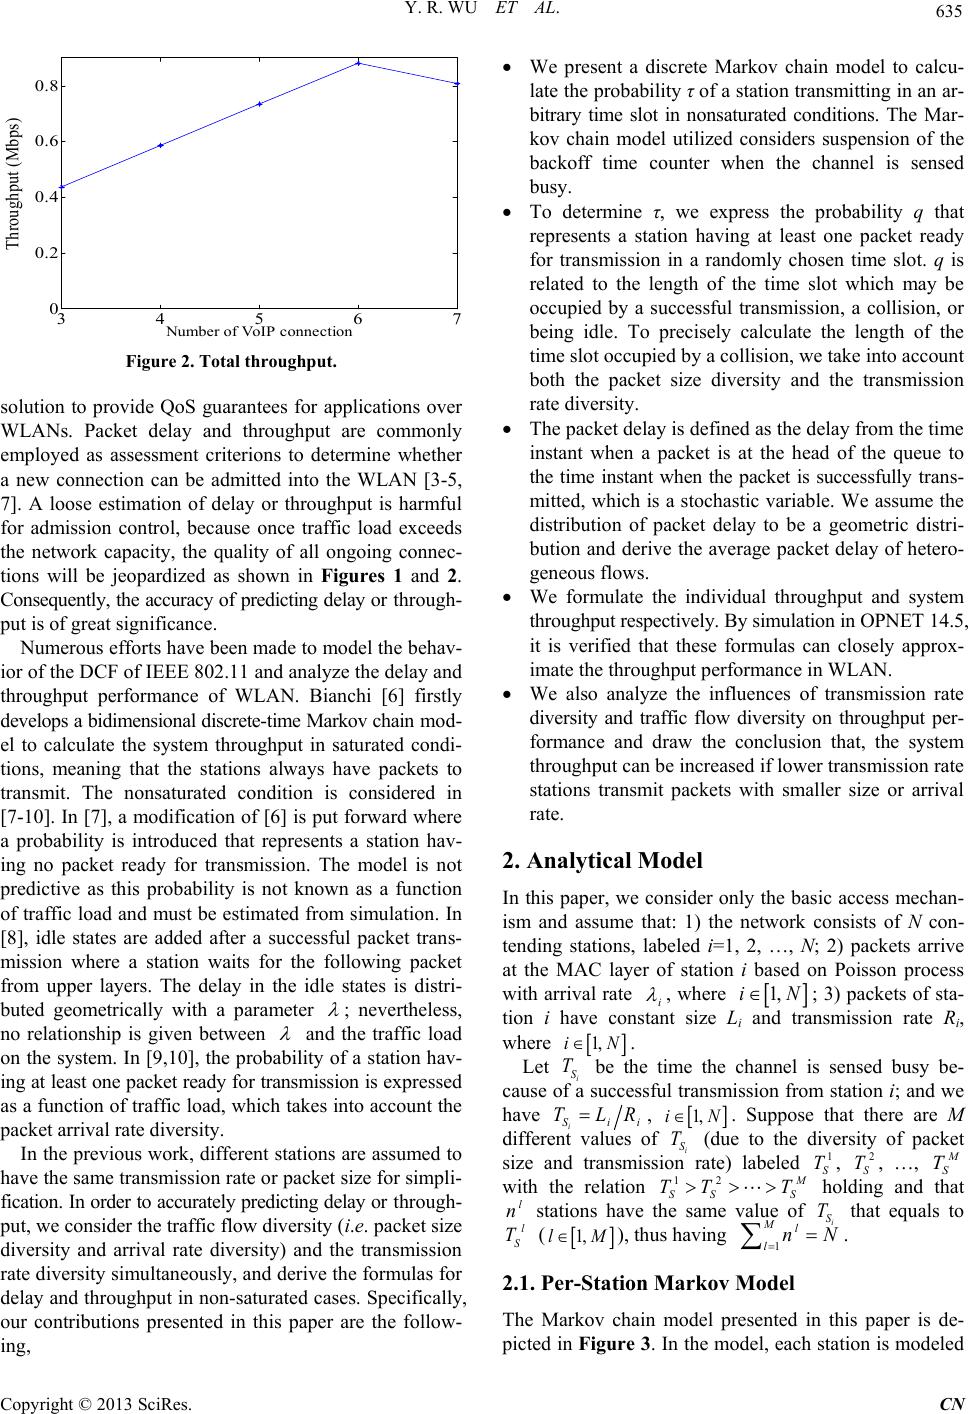 Y. R. WU ET AL. Copyright © 2013 SciRes. CN Figure 2. Total throughput. solution to provide QoS guarantees for applications over WLANs. Packet delay and throughput are commonly employed as assessment criterions to determine whether a new connection can be admitted into the WLAN [3-5, 7]. A loose estimation of delay or throughput is harmful for admission control, because once traffic load exceeds the network capacity, the quality of all ongoing connec- tions will be jeopardized as shown in Figures 1 and 2. Consequently, the accuracy of predicting delay or through- put is of great significance. Numerous efforts have been made to model the behav- ior of the DCF of IEEE 802.11 and analyze the delay and throughput performance of WLAN. Bianchi [6] firstly develops a bidimensional discrete-time Markov chain mod- el to calculate the system throughput in saturated condi- tions, meaning that the stations always have packets to transmit. The nonsaturated condition is considered in [7-10]. In [7], a modification of [6] is put forward where a probability is introduced that represents a station hav- ing no packet ready for transmission. The model is not predictive as this probability is not known as a function of traffic load and must be estimated from simulation. In [8], idle states are added after a successful packet trans- mission where a station waits for the following packet from upper layers. The delay in the idle states is distri- buted geometrically with a parameter ; nevertheless, no relationship is given between and the traffic load on the system. In [9,10], the probability of a sta tion hav- ing at least one p acket ready for transmissio n is expressed as a function of traffic load, which takes into account the packet arrival rate diversity. In the previous work, different stations are assumed to have the same transmission rate or packet size for simpli- fication. In order to accurately predicting delay or through- put, we consider the traffic flow diversity (i.e. packet size diversity and arrival rate diversity) and the transmission rate diversity simultaneously, and derive the formulas for delay and throughp ut in non-saturated cases. Specifically, our contributions presented in this paper are the follow- ing, • We present a discrete Markov chain model to calcu- late the probability τ of a station transmitting in an ar- bitrary time slot in nonsaturated conditions. The Mar- kov chain model utilized considers suspension of the backoff time counter when the channel is sensed busy. • To determine τ, we express the probability q that represents a station having at least one packet ready for transmission in a randomly chosen time slot. q is related to the length of the time slot which may be occupied by a successful transmission, a collision, or being idle. To precisely calculate the length of the time slot occupied by a collision, we take into account both the packet size diversity and the transmission rate diversity. • The packet delay is defined as the delay from the time instant when a packet is at the head of the queue to the time instant when the packet is successfully trans- mitted, which is a stochastic variable. We assume the distribution of packet delay to be a geometric distri- bution and derive the average packet delay of hetero- geneous f l ows. • We formulate the individual throughput and system throughput respectively. By simulation in OPNET 14.5, it is verified that these formulas can closely approx- imate the throughput performance in WLAN. • We also analyze the influences of transmission rate diversity and traffic flow diversity on throughput per- formance and draw the conclusion that, the system throughput can be increased if lower transmission rate stations transmit packets with smaller size or arrival rate. 2. Analytical Model In this paper, we consider only the basic access mechan- ism and assume that: 1) the network consists of N con- tending stations, labeled i=1, 2, …, N; 2) packets arrive at the MAC layer of station i based on Poisson process with arrival r ate , where ; 3) packets of sta- tion i have constant size Li and transmission rate Ri, where . Let be the time the channel is sensed busy be- cause of a successful transmission from station i; and w e have , . Suppose that there are M different values of (due to the diversity of packet size and transmission rate) labeled , , …, with the relation holding and that l n stations have the same value of that equals to ( ), thus having . 2.1. Per-Station Markov M ode l The Markov chain model presented in this paper is de- picted in Fig u r e 3. In the model, each station is modeled 34567 0 0.2 0.4 0.6 0.8 Number of VoIP connection Throughput (Mbps) 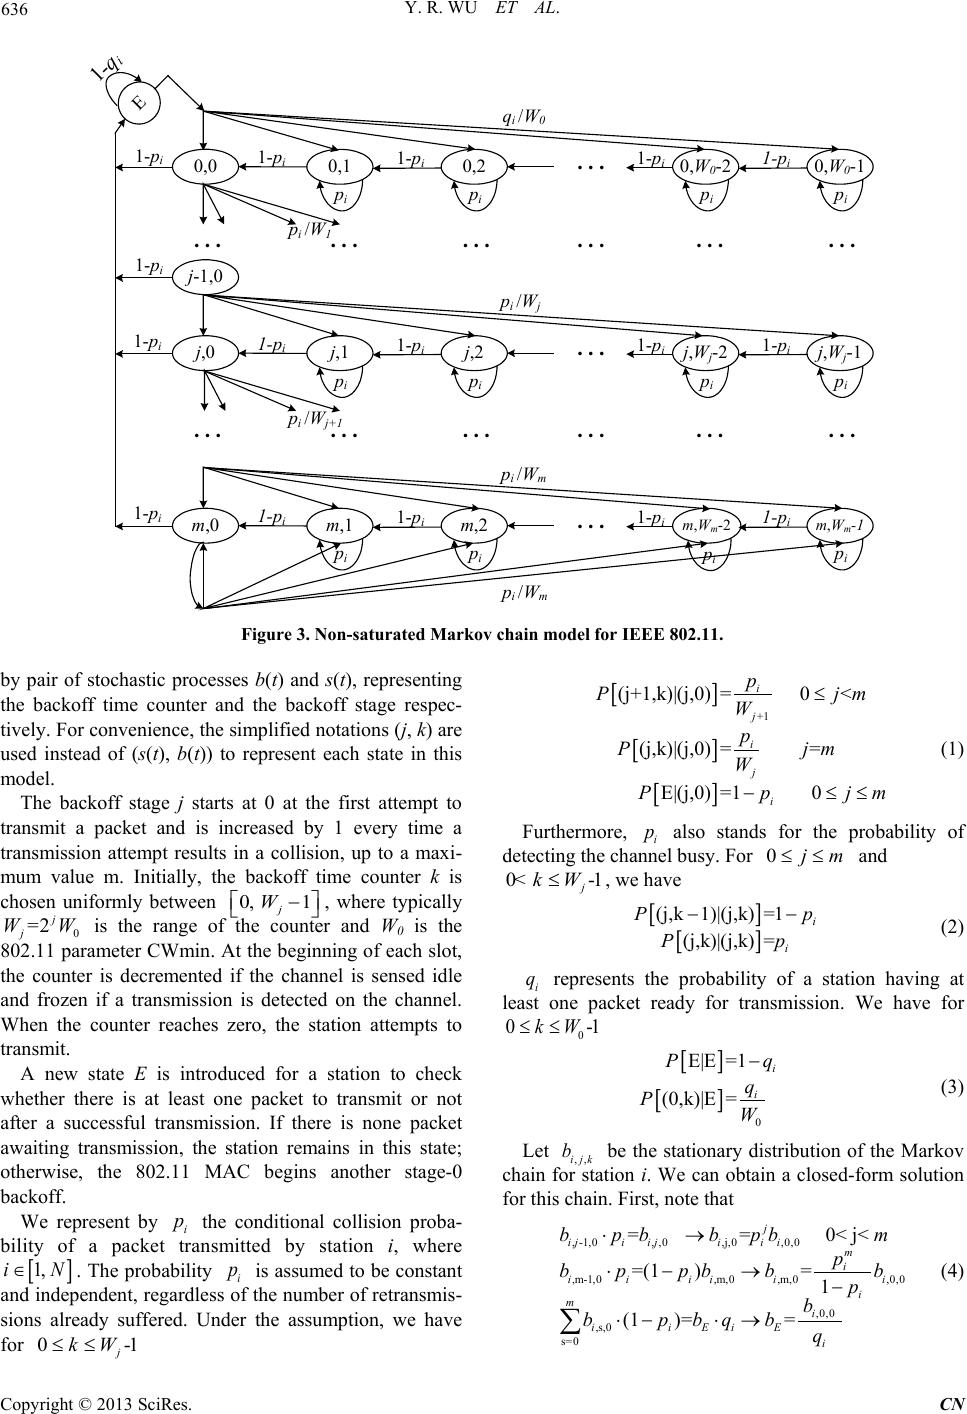 Y. R. WU ET AL. Copyright © 2013 SciRes. CN Figure 3. Non-saturated Markov chain model for IEEE 802.11. by pair of stochastic processes b(t) and s(t), representing the backoff time counter and the backoff stage respec- tively. For convenience, the simplified notations ( j, k) are used instead of (s(t), b(t)) to represent each state in this model. The backoff stage j starts at 0 at the first attempt to transmit a packet and is increased by 1 every time a transmission attempt results in a collision, up to a maxi- mum value m. Initially, the backoff time counter k is chosen uniformly between , where typically is the range of the counter and W0 is the 802.11 parameter CWmin. At the beginning of each slot, the counter is decremented if the channel is sensed idle and frozen if a transmission is detected on the channel. When the counter reaches zero, the station attempts to transmit. A new state E is introduced for a station to check whether there is at least one packet to transmit or not after a successful transmission. If there is none packet awaiting transmission, the station remains in this state; otherwise, the 802.11 MAC begins another stage-0 backoff. We represent by the conditional collision proba- bility of a packet transmitted by station i, where . The probability is assumed to be constant and independent, regardless of the number of retransmis- sions already suffered. Under the assumption, we have for [ ] [ ] [ ] +1 (j+1,k)|(j,0)= 0< (j,k)|(j,0)= = E|(j,0)=1 0 i j i j i p P jm W p P jm W Pp jm ≤ − ≤≤ (1) Furthermore, also stands for the probability of detecting the channel busy. For and , we have [ ] [ ] (j,k1)|(j,k) =1 (j,k)|(j,k)= i i Pp Pp −− (2) represents the probability of a station having at least one packet ready for transmission. We have for [ ] [ ] 0 E|E =1 (0,k)|E = i i Pq q PW − (3) Let be the stationary distribution of the Markov chain for station i. We can obtain a closed-form solution for this chain. First, note that , -1,0, ,0,j,0,0,0 ,m-1,0,m,0 ,m,0,0,0 ,0,0 ,s,0 s=0 == 0< j< =(1)= 1 (1 )== j ijiijii im i i iiiii i mi iiEiE i bpbbpbm p b ppbbb p b bp bqbq ⋅→ ⋅− →− ⋅− ⋅→ ∑ (4) pipipipi 0,0 0,W0-2 0,W0-1 1-pi 0,1 0,2 1-pi. . . 1-pi1-pi pi /W1. . .. . .. . .. . .. . .. . . j-1,0 pipipipi j,0 j,Wj-2 j,Wj-1 1-pi j,1 j,2 1-pi. . . 1-pi1-pi pi /Wj+1 . . .. . .. . .. . .. . .. . . pi /Wj pipipipi m,0 m,W m -2 m,W m -1 1-pi m,1 m,2 1-pi. . . 1-pi1-pi pi /Wm pi /Wm qi /W0 1-qi 1-pi 1-pi 1-pi 1-pi E  Y. R. WU ET AL. Copyright © 2013 SciRes. CN Owing to the chain regularities, the following relations hold, for ( ) , s,0 s=0 , ,, 1,0 , m1,0, ,0 (1 )0 10 1 m ii j ijki ij ji i iim pb j Wk bpb jm Wp p bbjm − − −= − =⋅⋅ ⋅<< − ⋅+ = ∑ (5) From relations (4), we can obtain ( ) , ,0,0,0 j0 =1 m ij ii bb p = − ∑ . Then rewrite (5) as , , , ,0 1 =0, 0< 1 1 j ijk ijj ji Wk bbjm kW Wp −⋅⋅≤≤≤ − − (6) Thus, all the stationary probabilities can be ex- pressed in terms of , and is finally deter- mined by imposing the normalization condition 1 , , =0 =0 + =1 j W m i jkE jk bb − ∑∑ (7) from which ()( ) ()()( ) ( ) ()( ) ,0,0 2 2 00 2 121 =12+1+1 2+2121 i i ii m iiiiii i b qpp qpWq pWppp −− −− −− (8) As any transmission attempt occurs when k = 0, irres- pective of the backoff stage, we can now express the probability that station i transmits in a randomly chosen slot time, that is ()( ) ()()() ( ) ()( ) ,0,0 , ,0 j=0 2 00 == 12 121 =12+1+1 2+2121 mi i ijiiii m iiiiiii b bpqpp qpWq pWppp τ −−− −− −− ∑ (9) A collision occur s if more than one station is trans mit- ting in the same time slot. As station i transmits with probability , the conditional collision probability can be ex pressed as (10 ) With m and W0 given in 802.11 standard, in order to determine τi and pi, we must determine qi first. 2.2. Probability q with Traffic Flow Diversity and Transmissi on Rate Diversity Under our assumption of Poisson process for packet ar- rival, the probability qi can be expressed as (11) where ES is the average length of a time slot. The length of the virtual time slot is not a fixed value, and each time slot may be occupied by a successful transmission, a col- lision, or the medium being idle, which gives 11 =+ + ii NM ll SidleS Scc il E PPTPT σ = = ⋅∑∑ (12) where, is the duration of an empty slot tim e; is the probability the channel is sensed idle (i.e., none sta- tion transmitting); (13) is the time the channel is sensed busy because of a successful transmission from station i; is the proba- bility station i successfully transmits (i.e., only station i transmitting); (14) is the time the channel is sensed busy during a collision, i.e., the longest transmission time of stations involved in a collision; then has M possible values that are (15) is the probability of being equal to , for ( )( ) 0 0 0 1 111 1 11 l Nj N n l ci Nji jiiN j P ττ τ +− + === ++ =− ⋅⋅−− ∑∏∏ (16) where . The set of Equations (9)-(11) (i=1, 2, …, N) represent a nonlinear system with 3N unknowns τi, pi and qi, which can be solved by numerical techniques. 2.3. Average Packet Delay We approximate the random length of the virtual time slot by its average value ES given by (12). Suppose Xi is a random variable that represents the number of time slots that station i needs for a successful transmission, then the packet delay of station i is also a random variable given by . Assume that the distribution of Xi is a geometric distribution, and that the probability of station i successfully transmitting in a random slot is given by (14). Thus, the distribution of packet delay is a geo- metric distribution given as follows, { } ( ) 1 1 i ii x i siSS PTE xPP − =⋅=− ⋅ (17) from which the average packet delay of station i, E[Ti],  Y. R. WU ET AL. Copyright © 2013 SciRes. CN derives, [ ][] 1 i iS iS S ETE EXEP =⋅=⋅ (18) 2.4. Throughput Formulation We are now able to express the throughput of station i as the ratio of the time that the medium is occupied by sta- tion i for successful transmission to the average packet delay of station i. [ ] == i ii S SS i iS T PT SET E (19) As a result, the system throughput is (20) 3. Model Verification Suppose there are 6 stations and two possible trans- mission rates of 1 Mbps and 11 Mbps in the WLAN. The other parameters are summarized in Table 1. We first evaluate the throughput when different sta- tions have different transmission rates but the same packet size (including MAC, IP, UTP and RTP headers) and the same arrival rate λi = λ = 100 packets/sec. Starting with all stations at 1 Mbps, we in- crease the transmission rate of one of them to 11 Mbps in each step. Eventually all six stations have the rate of 11Mbps. We simulate this setup in OPNET 14.5. Figure 4 shows that the analytical formulas (19) and (20) can closely approximate the individual throughput and the system throughput respectively. It is obvious from the figure that even one lower transmission rate can cause a considerable degradation in throughput performance of all the stations. This degradation is a consequence of the DCF mode which guarantees equal packet transmission probability to all stations. As a result, lower data rate stations receive more time to transmit and unfairly bring down the throughput of the higher data rate stations. This degradation was previously observed in [11] under satu- rated conditions. Then we exploit different packet sizes and arrival rates in the analysis. Table 1. System parameters. Slot Time 20 μs PHY header 192 μs Propagation Delay 1 μs DIFS 50 μs SIFS 10 μs ACK 112 bit + PHY header CWmi n 32 m 5 On the one hand, we reduce the packet size of stations with rate 1Mbps to = 102 bytes, but the packet ar- rival rate remains to be 100 packets/sec. As seen from Figure 5, the system throughput and throughput of 11 Mbps stations are improved, whereas the 1 Mbps stations are worse off. In this case, lower data rate stations and higher data rate stations receive the same amount of time to transmit. On the other hand, we reduce th e packet arrival rate of stations with rate 1 Mbps to = 15 packets/sec, but the packet size remains to be 1024 bytes. The throughput performance plotted in Figure 6 resembles that in Figure 5, which shows that the throughput performance of sys- tem and high data rate stations can be enhanced by sacri- ficing that of low data rate stations. By reducing the packet arrival rate of lower data rate stations, the packet transmission probability of lower rate stations is reduced. Figure 7 shows the throughput performance when 1 Figure 4. Throughput with transmission rate diversity (L = 1024 bytes, λ = 100 packets/sec). Figure 5. Throughput with diversity of transmission rates and packet sizes (λ = 100 packets/sec). 0123456 0 1 2 3 4 5 6 7 8 Number of stati ons wi th 11M bps out of 6 s tat i ons, t he rest wi t h 1M bps Throughput (M bps) A nal y ti cal 11M STA A nal y ti cal 1M STA A nal y ti cal System S i m ulati on 11M STA S i m ulati on 1M STA S i m ulati on System 0123 456 0 1 2 3 4 5 6 7 8 Num ber of st ations with 11Mbps out of 6 st ations , the rest with 1Mbps Throughput (Mbps) 11M ST A 1M STA System Opt im ized 11M STA ( L=1024 bytes) Opt im ized 1M STA ( L′ =102 bytes) Opt im ized Sys tem  Y. R. WU ET AL. Copyright © 2013 SciRes. CN Figure 6. Throughput with diversity of transmission rates and packet arrival rates (L = 1024 bytes). Figure 7. Throughput with diversity of transmission rates and traffic flows. Mbps stations have the packet size 102 bytes and the arrival rate 15 packets/sec. There is no striking enhance- ment in throughput performance, compared to that in Figures 5 and 6. 4. Conclusion In this paper, we have presented an analytical model to evaluate the packet delay and throughput performance of IEEE 802.11 WLAN in nonsatur ated conditions. Simula- tion and analysis results show that our analytical formu- las for throughput can closely approximate the perfor- mance for different transmission rates and traffic flows. The analysis results also show that higher system through- put can be achieved if lower data rate stations transmit packets with smaller size or arrival rate. Furthermore, this evaluation method can easily be utilized with suffi- cient accuracy in admission control in the real network environment. 5. Acknowledgments This work is supported by the National Science Founda- tion (609720 47, 61231008 ), National S&T Ma jor Project (2011ZX03005 -004, 2011ZX03004-003, 2011ZX03005- 003-03, 2013ZX03004007-003), Shannxi 13115 Project (2010ZDKG-26), National Basic Research Program of China(2009CB320404), Program for Changjiang Scho- lars and Innovative Research Team in University (IRT0852), the 111 Project (B08038) and State Key La- boratory Foundation (ISN 1002005, ISN090305). REFERENCES [1] IEEE 802.11e WG, “Wireless LAN Medium Access Con- trol (MAC) and Physical Layer (PHY) Specifications: Medium Access Control (MAC) Enhancements for Qual- ity of Service (QoS),” IEEE std 802.11e -draft ed, 2005. [2] J. Villalón, P. Cuenca and L. Orozco-Barbosa, “On the Capabilities of IEEE 802.11e for Multimedia Communi- cations over Heterogeneous 802.11/802.11e WLANs,” Springer Science, Vol. 36, 2007, pp. 27-38. [3] L. Lin, H. Fu and W. Jia, “An Efficient Admission Con- trol for IEEE 802.11 Networks Based on throughput Analyses of (Un) Saturated Channel,” IEEE GLOBECOM, 2005, pp. 3017-3021. [4] A. Bazzi, M. Diolaiti and G. Pasolini, “Measurement Based Call Admission Control Strategies in Infrastruc- tured IEEE 802.11 WLANs,” IEEE International Sympo- sium on Personal, Indoor and Mobile Radio Communica- tions, Vol. 3, 2005, pp. 2093-2098. [5] A. Abdrabou and W. Zhuang, “Stochastic Delay Guaran- tees and Statistical Call Admission Control for IEEE 802.11 Single-Hop Ad Hoc Networks,” IEEE Transac- tions on Wireless Communications, Vol. 7, No. 10, 2008, pp. 3972-3981. http://dx.doi.org/10.1109/T-WC.2008.070564 [6] G. Bianchi, “Performance Analysis of the IEEE 802.11 Distributed Coordination Function,” IEEE Journal on Selected Areas in Communications, Vol. 18 , No. 3, 2000, pp. 535-547. http://dx.doi.org/10.1109/49.840210 [7] M. Ergen and P. Varaiya, “Throughput Analysis and Ad- mission Control for IEEE 802.11a,” Mobile Networks and Applications, Vol. 10, No. 5, 2005, pp. 705-716. http://dx.doi.org/10.1007/s11036-005-3364-9 [8] G.-S. Ahn, A. T. Campbell, A. Veres and L.-H. Sun, “Supporting Service Differentiation for Real-Time and Best-Effort Traffic in Stateless Wireless Ad Hoc Net- works (SWAN),” IEEE Transaction on Mobile Compu- ting, Vol. 1, No. 3, 2002, pp. 192-207. http://dx.doi.org/10.1109/TMC.2002.1081755 [9] D. Malone, K. Duffy and D. Leith, “Modeling the 802.11 Distributed Coordination Function in Nonsaturated Hete- rogeneous Conditions,” IEEE/ACM Transactions on Net- working, Vol. 15, No. 1, 2007, pp. 159-172. http://dx.doi.org/10.1109/TNET.2006.890136 [10] Y. Xu and C. Xu, “On Traffic Flow Diversity over IEEE 802.11 Ad Hoc Networks,” IEEE International Confe- rence on Wireless Communications, Networking and Mo- bile Computing, 2011, pp. 1-4. [11] M. Ergen and P. Varaiya, “Formulation of Distributed Coordination Function of IEEE 802.11 for Asynchronous 0 123 4 56 0 1 2 3 4 5 6 7 8 Num ber of st ations with 11Mbps out of 6 stations , the rest with 1Mbps Throughput (Mbps) 11M ST A 1M STA S ystem Opt im ized 11M S T A ( λ=100 packets/sec) Opt im ized 1M S T A ( λ′ =15 packets/sec) Opt im ized System 0 123 456 0 1 2 3 4 5 6 7 8 Number of stations with 11Mbps out of 6 stations, the rest with 1Mbps Throughput (Mbps) 11M STA 1M STA System Opt imized 11M STA ( L=1024 bytes, λ=100 packets/sec) Opt imized 1M STA ( L′ =102 bytes, λ′ =15 packets/sec) Opt imized Syst em  Y. R. WU ET AL. Copyright © 2013 SciRes. CN Networks Mixed Data Rate and Packet Size,” IEEE Transaction on Vehicular Technology, Vol. 57, 2008, pp. 436-447. http://dx.doi.org/10.1109/TVT.2007.901887
|