Paper Menu >>
Journal Menu >>
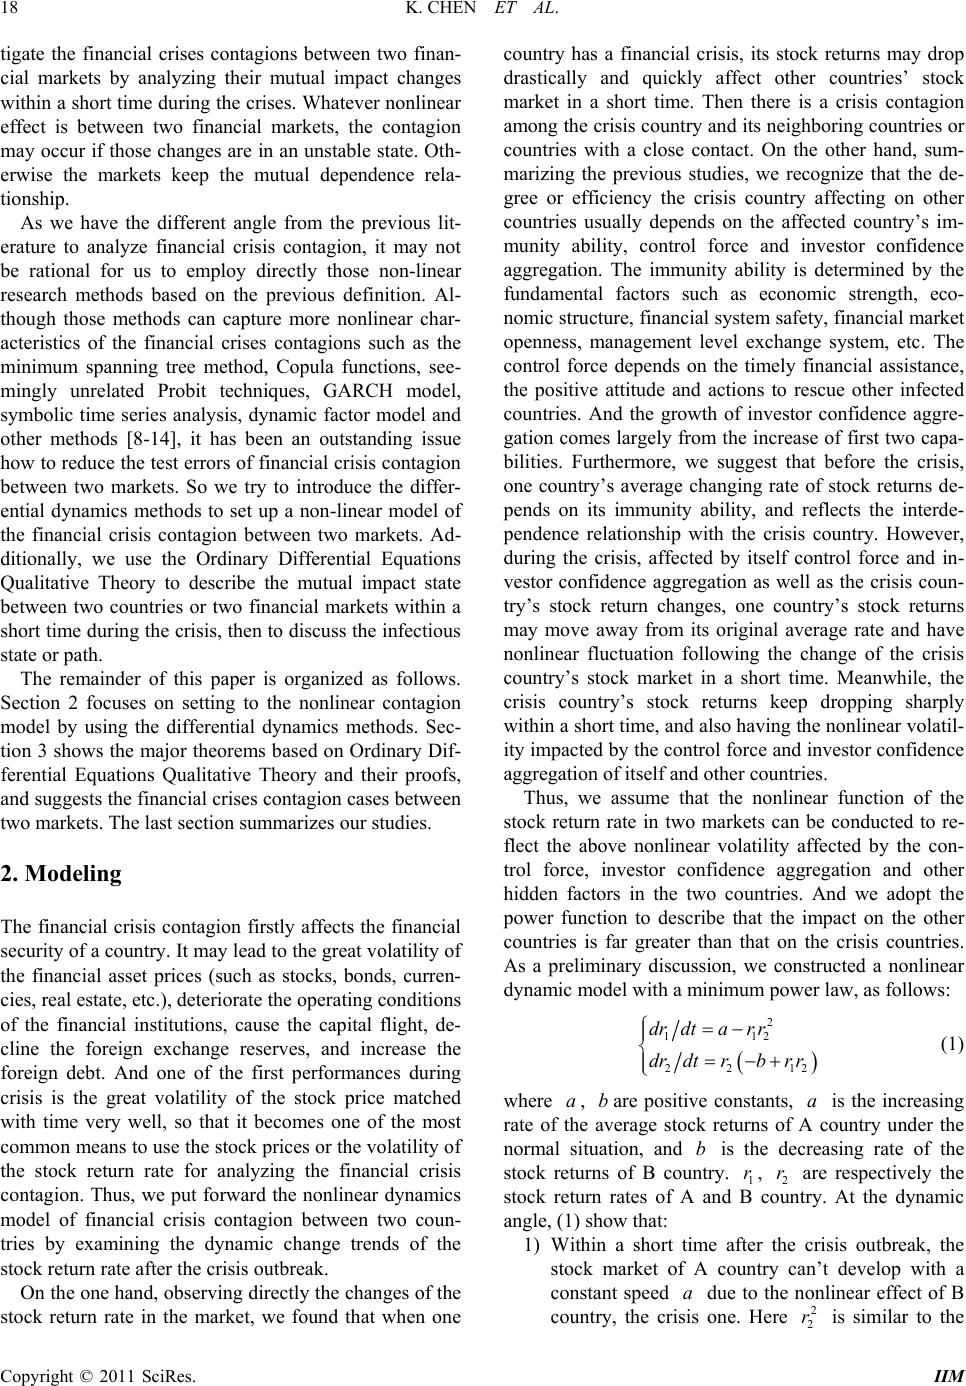
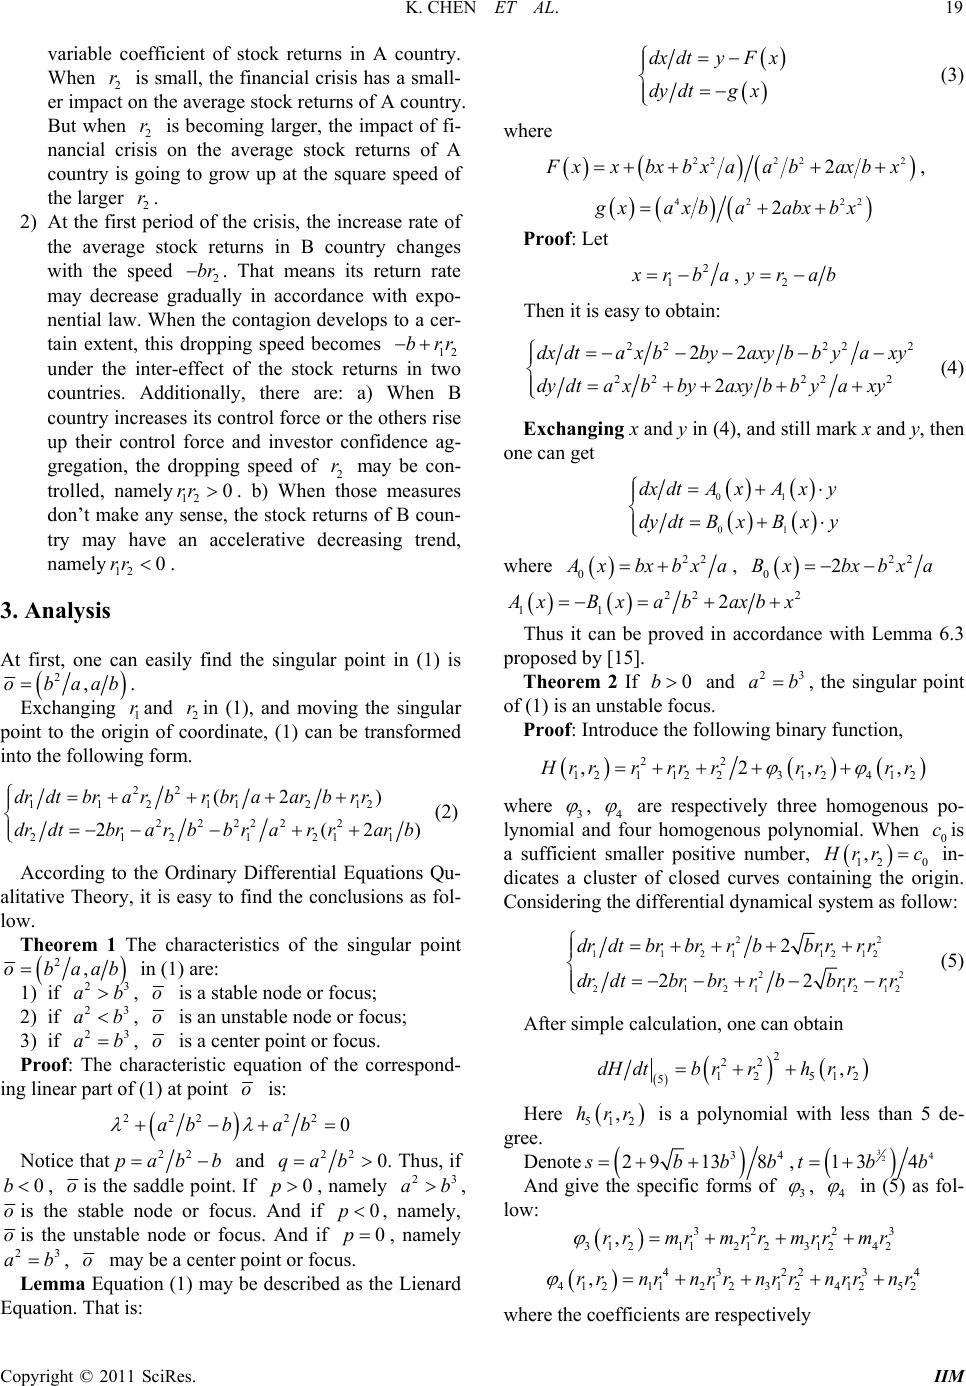
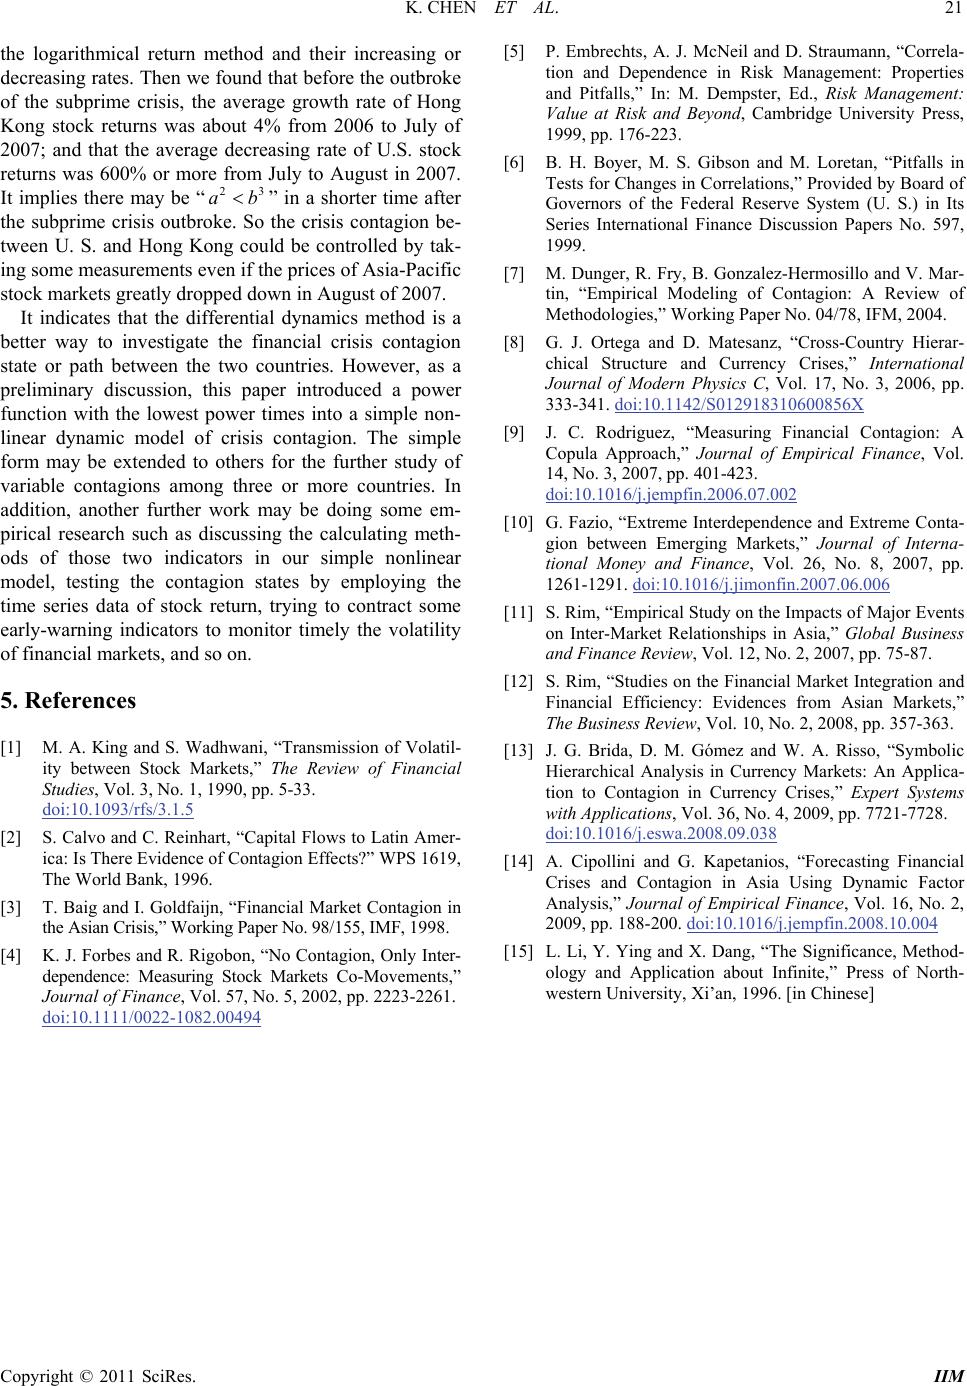
 Intelligent Information Management, 2011, 3, 17-21 doi:10.4236/iim.2011.31002 Published Online January 2011 (http://www.SciRP.org/journal/iim) Copyright © 2011 SciRes. IIM A Nonlinear Dynamic Model of the Financial Crises Contagions* Ke Chen1,2, Yirong Ying1 1College of Management, Shanghai University, Shanghai, China 2College of Finance and Economics, Chongqing Jiaoting University, Chongqing, China E-mail: ckbest@163.com, yrying@staff.shu.edu.cn Received December 19, 2010; revised January 7, 2011; accepted January 10, 2011 Abstract Employing the Differential Dynamics Method, a nonlinear dynamic model is set up to describe the interna- tional financial crises contagion within a short time between two countries. The two countries’ control force depending on the timely financial assistance, the positive attitude and actions to rescue other infected coun- tries, and investor confidence aggregation, and the immunity ability of the infected country are considered as the major reasons to drive the nonlinear fluctuations of the stock return rates in both countries during the cri- sis. According to the Ordinary Differential Equations Qualitative Theory, we found that there are three cases of financial crises contagion within a brief time between two countries: weak contagion with instability but inhibition, contagion with limit and controllable oscillation, and strong contagion without control in a brief time. Keywords: Financial Crises Contagion, Stock Return Rate, Nonlinear Dynamics Model, Limit Cycle 1. Introduction Since 1990s, the international financial crises have fre- quently broken out, and their contagions also greatly increased. The crises like the infectious diseases often spread quickly from the earliest crises country or region to others after their outbreak. For instance, the 1994 “te- quila crisis” in Latin American countries, the 1998 “Rus- sian virus” and the 1997 Southeast Asian financial crises all are the regional financial crises with strong contagion. However, the crisis trigged by 2007 American sub-prime crisis has more strong contagion, and has developed into a global financial crisis. It has leaded some countries into economic crisis and given a profound impact on the or- der of global economic development. Therefore, we pay particularly our attention to the dynamic transmission problems of the financial crisis within a short time after its outbreak. Many researchers have been focused on the financial crisis and its contagion test. But they show the different empirical conclusions under the different definitions of financial crisis contagion. Sometimes the different results may be found even under the same definition framework. For example, the financial crisis contagion is defined as the significantly enhanced correlation among the financial markets after the crisis outbreak. Reference [1-3] find there are the significantly enhanced correlations in cross- border capital markets when they study some major fi- nancial crises. But [4] strictly separates the contagion and mutual dependent degree, and taking account of the different conditions variance, they don’t find the evi- dence that the correlations between the various markets are destroyed during those major crises. For the reasons, [5] have pointed out that the correlation coefficient is only used to describe a linear relationship between the two financial markets, and it is not suitable for studying the non-linear changes. Reference [6] also put forward that without considering the conditional heteroskedastic- ity, the results of correlation test are biased. Furthermore, [7] suggest that these differences in definitions and tests are small, even the same under certain conditions. And after classifying the empirical research methods of finan- cial contagion and analyzing their similarities and dif- ferences, they explain that some models reflect all of the information while others take part of the information. Therefore, we follow the strict distinction on the infec- tious and mutual dependence in [4], but don’t distinguish the amount of information in the model. Then we inves- * This work has been supported by the Research Fund of Program Foundation of Education Ministry of China (10YJA790233)  K. CHEN ET AL. Copyright © 2011 SciRes. IIM 18 tigate the financial crises contagions between two finan- cial markets by analyzing their mutual impact changes within a short time during the crises. Whatever nonlinear effect is between two financial markets, the contagion may occur if those changes are in an unstable state. Oth- erwise the markets keep the mutual dependence rela- tionship. As we have the different angle from the previous lit- erature to analyze financial crisis contagion, it may not be rational for us to employ directly those non-linear research methods based on the previous definition. Al- though those methods can capture more nonlinear char- acteristics of the financial crises contagions such as the minimum spanning tree method, Copula functions, see- mingly unrelated Probit techniques, GARCH model, symbolic time series analysis, dynamic factor model and other methods [8-14], it has been an outstanding issue how to reduce the test errors of financial crisis contagion between two markets. So we try to introduce the differ- ential dynamics methods to set up a non-linear model of the financial crisis contagion between two markets. Ad- ditionally, we use the Ordinary Differential Equations Qualitative Theory to describe the mutual impact state between two countries or two financial markets within a short time during the crisis, then to discuss the infectious state or path. The remainder of this paper is organized as follows. Section 2 focuses on setting to the nonlinear contagion model by using the differential dynamics methods. Sec- tion 3 shows the major theorems based on Ordinary Dif- ferential Equations Qualitative Theory and their proofs, and suggests the financial crises contagion cases between two markets. The last section summarizes our studies. 2. Modeling The financial crisis contagion firstly affects the financial security of a country. It may lead to the great volatility of the financial asset prices (such as stocks, bonds, curren- cies, real estate, etc.), deteriorate the operating conditions of the financial institutions, cause the capital flight, de- cline the foreign exchange reserves, and increase the foreign debt. And one of the first performances during crisis is the great volatility of the stock price matched with time very well, so that it becomes one of the most common means to use the stock prices or the volatility of the stock return rate for analyzing the financial crisis contagion. Thus, we put forward the nonlinear dynamics model of financial crisis contagion between two coun- tries by examining the dynamic change trends of the stock return rate after the crisis outbreak. On the one hand, observing directly the changes of the stock return rate in the market, we found that when one country has a financial crisis, its stock returns may drop drastically and quickly affect other countries’ stock market in a short time. Then there is a crisis contagion among the crisis country and its neighboring countries or countries with a close contact. On the other hand, sum- marizing the previous studies, we recognize that the de- gree or efficiency the crisis country affecting on other countries usually depends on the affected country’s im- munity ability, control force and investor confidence aggregation. The immunity ability is determined by the fundamental factors such as economic strength, eco- nomic structure, financial system safety, financial market openness, management level exchange system, etc. The control force depends on the timely financial assistance, the positive attitude and actions to rescue other infected countries. And the growth of investor confidence aggre- gation comes largely from the increase of first two capa- bilities. Furthermore, we suggest that before the crisis, one country’s average changing rate of stock returns de- pends on its immunity ability, and reflects the interde- pendence relationship with the crisis country. However, during the crisis, affected by itself control force and in- vestor confidence aggregation as well as the crisis coun- try’s stock return changes, one country’s stock returns may move away from its original average rate and have nonlinear fluctuation following the change of the crisis country’s stock market in a short time. Meanwhile, the crisis country’s stock returns keep dropping sharply within a short time, and also having the nonlinear volatil- ity impacted by the control force and investor confidence aggregation of itself and other countries. Thus, we assume that the nonlinear function of the stock return rate in two markets can be conducted to re- flect the above nonlinear volatility affected by the con- trol force, investor confidence aggregation and other hidden factors in the two countries. And we adopt the power function to describe that the impact on the other countries is far greater than that on the crisis countries. As a preliminary discussion, we constructed a nonlinear dynamic model with a minimum power law, as follows: 2 112 2212 drdtar r drdtrbr r (1) where a, bare positive constants, a is the increasing rate of the average stock returns of A country under the normal situation, and b is the decreasing rate of the stock returns of B country. 1 r, 2 r are respectively the stock return rates of A and B country. At the dynamic angle, (1) show that: 1) Within a short time after the crisis outbreak, the stock market of A country can’t develop with a constant speed a due to the nonlinear effect of B country, the crisis one. Here 2 2 r is similar to the  K. CHEN ET AL. Copyright © 2011 SciRes. IIM 19 variable coefficient of stock returns in A country. When 2 r is small, the financial crisis has a small- er impact on the average stock returns of A country. But when 2 r is becoming larger, the impact of fi- nancial crisis on the average stock returns of A country is going to grow up at the square speed of the larger 2 r. 2) At the first period of the crisis, the increase rate of the average stock returns in B country changes with the speed 2 br. That means its return rate may decrease gradually in accordance with expo- nential law. When the contagion develops to a cer- tain extent, this dropping speed becomes 12 brr under the inter-effect of the stock returns in two countries. Additionally, there are: a) When B country increases its control force or the others rise up their control force and investor confidence ag- gregation, the dropping speed of 2 r may be con- trolled, namely120rr . b) When those measures don’t make any sense, the stock returns of B coun- try may have an accelerative decreasing trend, namely 12 0rr . 3. Analysis At first, one can easily find the singular point in (1) is 2,obaab. Exchanging 1 rand 2 rin (1), and moving the singular point to the origin of coordinate, (1) can be transformed into the following form. 22 11211 212 22222 2 2121211 (2 ) 2(2) drdtbrarbrbraarbr r drdtbra rbb rarrarb (2) According to the Ordinary Differential Equations Qu- alitative Theory, it is easy to find the conclusions as fol- low. Theorem 1 The characteristics of the singular point 2,obaab in (1) are: 1) if 23 ab, o is a stable node or focus; 2) if 23 ab, o is an unstable node or focus; 3) if 23 ab, o is a center point or focus. Proof: The characteristic equation of the correspond- ing linear part of (1) at point o is: 222 22 0ab bab Notice that22 pabb and 22 0qab. Thus, if 0b, ois the saddle point. If 0p, namely 23 ab, ois the stable node or focus. And if 0p, namely, ois the unstable node or focus. And if 0p, namely 23 ab, o may be a center point or focus. Lemma Equation (1) may be described as the Lienard Equation. That is: dx dtyFx dy dtgx (3) where 222 22 2 F xxbxbxaab axbx , 42 22 2 g xaxbaabxbx Proof: Let 2 12 , x rbayrab Then it is easy to obtain: 2222 2 2222 2 22 2 dx dtax bbyaxybbyaxy dydta x bbyaxy bbyaxy (4) Exchanging x and y in (4), and still mark x and y, then one can get 01 01 dx dtAxAxy dy dtBxBxy where 22 0 A xbxbxa , 22 02Bx bxbxa 22 2 11 2 A xBxabaxbx Thus it can be proved in accordance with Lemma 6.3 proposed by [15]. Theorem 2 If 0b and 23 ab, the singular point of (1) is an unstable focus. Proof: Introduce the following binary function, 22 1211223 124 12 ,2,, H rrrrr rrrrr where 3 , 4 are respectively three homogenous po- lynomial and four homogenous polynomial. When 0 cis a sufficient smaller positive number, 12 0 , H rr c in- dicates a cluster of closed curves containing the origin. Considering the differential dynamical system as follow: 22 1121 1212 22 212 112 12 2 22 drdtbrbrrbbrr rr drdtbrbrrbbr rr r (5) After simple calculation, one can obtain 2 22 12 512 5,dH dtb rrhrr Here 512 ,hrr is a polynomial with less than 5 de- gree. Denote 34 2913 8 s bbb , 324 13 4tbb And give the specific forms of 3 , 4 in (5) as fol- low: 32 23 3121121231242 ,r rmrmrrmrrmr 432234 41211212 31241252 ,rrnr nrrnrr nrrnr where the coefficients are respectively  K. CHEN ET AL. Copyright © 2011 SciRes. IIM 20 322322 12 125 3,63mbbmb b , 32 2322 34 42, 423mb bmbb 5 12 2 110 8,2020nstn st 95 345 416 1818,44, nstnstnst Then, due to 0b, it can be proved from (5) that the singular point o in (1) is an unstable focus. Theorem 3 If 23 ab, there is no limit cycle in (1). Proof: Denote 2 ,2 x yy Gx , where 43 0 42 ln x Gxgzdza ba bxa ab xabx 2 22 1 a b x Fxx bxxbxa if,0 0xabxFx x And there is 2 4 g xab abxx . Then 400,ddtgxFxxx ab So (4) does not possess any limit cycles. Then there is no limit cycle in (1). Theorem 4 If 23 ab, there is an unique limit cycle in (1). Proof: According to our Lemma and the Theorem 6.6 proposed by [15], one can get 1) There is0100a . Then32 0ba, namely 23 ab; 2) There is 00 . Then 20a, namely 0a ; 3) There is 21 40a . Then 0b; 4) There is 30 . Then 23 20ab Summarizing the above four conclusions, one can find that Theorem 4 is true. According to Theorem 2-4, we conclude that there are three cases of financial crises contagions between two countries: weak contagion with instability but inhibition, contagion with limit and controllable oscillation, and strong contagion without control in a brief time. Case 1, when 23 ab (0b), Theorem 4 indicates that the (1) has unique limit cycle. Its phase plane shows that there occurs an alternating oscillation of stock re- turns between two countries. However, this oscillation may not enlarge without any limitation due to there ex- ists a limit cycle. The immunity ability and self-repair capacity of the economy system in both two countries may limit the oscillation magnitude within some con- trollable size, which depends on the size of the limit cy- cle. So it is a contagion case with limit and controllable oscillation. Case 2, when 23 ab (0b), Theorem 2 suggests that the singular point of (1) is not a center but an unsta- ble focus. Due to there is a little difference between cen- ter point and focus, it show that during the first period of financial crises contagions, the stock return rates of two countries increase gradually their oscillation magnitude by a imperceptible way. Thus this stage should be the best time to control the financial crises contagions. We call it as the weak contagion with instability but inhibi- tion. Case 3, when 23 ab (0b), Theorem 3 dominates that there is no limit cycle in (1). In this case, the finan- cial crises contagions have evolved into a disaster and both the two countries have to endure more and more strong impacts. The governments must take the firmest monetary policies and fiscal policies to curb its spread. 4. Conclusions Within a short time after the crisis outbroke, the stock returns of crisis country would be to drop abruptly and cause quickly the stock returns volatility of other coun- tries. Then there is a nonlinear contagion of the financial crisis. To investigate the above phenomenon, we intro- duce the differential dynamics methods to construct a simple nonlinear dynamic model and derive four theo- rems in accordance with the qualitative theory of differ- ential equations. Furthermore, based on the discussions about the stability of focus and the existence of limit cycle in the nonlinear volatility equations of stock re- turns, we analyze the financial crisis contagion situation between two countries during the crisis, and find there are three cases of financial crises contagions within a short time after the crisis outbroke. First one is that if the average increasing rate square of stock returns in the infected country is more than the decreasing rate cube of stock returns in the crisis country, there is no limit cycle in the nonlinear dynamic model of financial crisis conta- gion. Thus there is a strong contagion between the two countries to be controlled difficultly within a short time. Second one is that if the former is less than the latter, there is a unique stable limit cycle in this model. Thus there is an oscillation contagion between the two coun- tries, whose oscillation magnitude depends on the size of limit cycle. Third one is that if the former equals to the latter, this model has an unstable focus. Thus there is a weak contagion between the two countries. It is easy to be adjusted to the interdependence state before the crisis. Our analysis results are closer to the actual state of fi- nancial crisis contagion within a short term between the two countries. For example, Hong Kong Monetary Au- thority expected the U. S. subprime mortgage crisis will not create systemic impact on Hong Kong banking sys- tem in its paper submitting to Hong Kong SAR Legisla- tive Council in January of 2008. Later this point was also proved. Using Hong Kong’s Hang Seng Index and U. S. S & P500 stock index, we calculated the stock returns by  K. CHEN ET AL. Copyright © 2011 SciRes. IIM 21 the logarithmical return method and their increasing or decreasing rates. Then we found that before the outbroke of the subprime crisis, the average growth rate of Hong Kong stock returns was about 4% from 2006 to July of 2007; and that the average decreasing rate of U.S. stock returns was 600% or more from July to August in 2007. It implies there may be “23 ab” in a shorter time after the subprime crisis outbroke. So the crisis contagion be- tween U. S. and Hong Kong could be controlled by tak- ing some measurements even if the prices of Asia-Pacific stock markets greatly dropped down in August of 2007. It indicates that the differential dynamics method is a better way to investigate the financial crisis contagion state or path between the two countries. However, as a preliminary discussion, this paper introduced a power function with the lowest power times into a simple non- linear dynamic model of crisis contagion. The simple form may be extended to others for the further study of variable contagions among three or more countries. In addition, another further work may be doing some em- pirical research such as discussing the calculating meth- ods of those two indicators in our simple nonlinear model, testing the contagion states by employing the time series data of stock return, trying to contract some early-warning indicators to monitor timely the volatility of financial markets, and so on. 5. References [1] M. A. King and S. Wadhwani, “Transmission of Volatil- ity between Stock Markets,” The Review of Financial Studies, Vol. 3, No. 1, 1990, pp. 5-33. doi:10.1093/rfs/3.1.5 [2] S. Calvo and C. Reinhart, “Capital Flows to Latin Amer- ica: Is There Evidence of Contagion Effects?” WPS 1619, The World Bank, 1996. [3] T. Baig and I. Goldfaijn, “Financial Market Contagion in the Asian Crisis,” Working Paper No. 98/155, IMF, 1998. [4] K. J. Forbes and R. Rigobon, “No Contagion, Only Inter- dependence: Measuring Stock Markets Co-Movements,” Journal of Finance, Vol. 57, No. 5, 2002, pp. 2223-2261. doi:10.1111/0022-1082.00494 [5] P. Embrechts, A. J. McNeil and D. Straumann, “Correla- tion and Dependence in Risk Management: Properties and Pitfalls,” In: M. Dempster, Ed., Risk Management: Value at Risk and Beyond, Cambridge University Press, 1999, pp. 176-223. [6] B. H. Boyer, M. S. Gibson and M. Loretan, “Pitfalls in Tests for Changes in Correlations,” Provided by Board of Governors of the Federal Reserve System (U. S.) in Its Series International Finance Discussion Papers No. 597, 1999. [7] M. Dunger, R. Fry, B. Gonzalez-Hermosillo and V. Mar- tin, “Empirical Modeling of Contagion: A Review of Methodologies,” Working Paper No. 04/78, IFM, 2004. [8] G. J. Ortega and D. Matesanz, “Cross-Country Hierar- chical Structure and Currency Crises,” International Journal of Modern Physics C, Vol. 17, No. 3, 2006, pp. 333-341. doi:10.1142/S012918310600856X [9] J. C. Rodriguez, “Measuring Financial Contagion: A Copula Approach,” Journal of Empirical Finance, Vol. 14, No. 3, 2007, pp. 401-423. doi:10.1016/j.jempfin.2006.07.002 [10] G. Fazio, “Extreme Interdependence and Extreme Conta- gion between Emerging Markets,” Journal of Interna- tional Money and Finance, Vol. 26, No. 8, 2007, pp. 1261-1291. doi:10.1016/j.jimonfin.2007.06.006 [11] S. Rim, “Empirical Study on the Impacts of Major Events on Inter-Market Relationships in Asia,” Global Business and Finance Review, Vol. 12, No. 2, 2007, pp. 75-87. [12] S. Rim, “Studies on the Financial Market Integration and Financial Efficiency: Evidences from Asian Markets,” The Business Review, Vol. 10, No. 2, 2008, pp. 357-363. [13] J. G. Brida, D. M. Gómez and W. A. Risso, “Symbolic Hierarchical Analysis in Currency Markets: An Applica- tion to Contagion in Currency Crises,” Expert Systems with Applications, Vol. 36, No. 4, 2009, pp. 7721-7728. doi:10.1016/j.eswa.2008.09.038 [14] A. Cipollini and G. Kapetanios, “Forecasting Financial Crises and Contagion in Asia Using Dynamic Factor Analysis,” Journal of Empirical Finance, Vol. 16, No. 2, 2009, pp. 188-200. doi:10.1016/j.jempfin.2008.10.004 [15] L. Li, Y. Ying and X. Dang, “The Significance, Method- ology and Application about Infinite,” Press of North- western University, Xi’an, 1996. [in Chinese] |

