 Modern Research in Catalysis, 2013, 2, 136-147 http://dx.doi.org/10.4236/mrc.2013.24019 Published Online October 2013 (http://www.scirp.org/journal/mrc) Adsorption of CO and NO on Ceria- and Pt-Supported TiO2: In Situ FTIR Study Zeinhom M. El-Bahy1,2 1Chemistry Department, Faculty of Science, Taif University, Taif, Saudi Arabia 2Chemistry Department, Faculty of Science, Al-Azhar University, Cairo, Egypt Email: zeinelbahy2020@yahoo.com Received June 19, 2013; revised August 8, 2013; accepted September 2, 2013 Copyright © 2013 Zeinhom M. El-Bahy. This is an open access article distributed under the Creative Commons Attribution License, which permits unrestricted use, distribution, and reproduction in any medium, provided the original work is properly cited. ABSTRACT Pt/TiO2, Ce/TiO2 and binary system PtCe/TiO2 catalysts were prepared by impregnation method and the structural properties of these catalysts were investigated by means of XRD, CO-TPD and UV-vis diffuse reflectance spectroscopy. As investigated by XRD, the composition of the prepared samples anatase and rutile phases with higher amount of ana- tase phase and its particle size was in the range of 19 - 22 nm. The band gap also decreased from 3.1 to 2.85 after addi- tion of metal to TiO2. The adsorption and interaction properties of NO and/or CO gases were monitored using an in situ FTIR technique. The intensity and position of the infrared peaks were strongly dependent on the composition of the catalyst. In presence of Pt, the main oxidative reductive products of (NO + CO) are CO2 and NCO complex. The forma- tion of NCO depends on not only the presence of platinum in the catalyst but also the presence of Lewis acid sites which is Ti4+ in this study. However, the interaction between NO and CO gases increased in presence of CeO2. The op- timum Ce content in PtCe/TiO2 was 0.1% (Ce/TiO2) at which the maximum peak intensity was observed for NCO and CO2. Keywords: In Situ FTIR; NO Reduction; CO Oxidation; TPD-CO; Platinum-Cerium 1. Introduction The importance of environmental gas monitoring and controlling is now recognized as an important area to diminish the hazardous chemical vapors present beyond specified levels. CO and NO are known to be extremely harmful to the human body and also a main cause of air pollution since they are two of the most hazardous prod- ucts released in car exhausts [1]. The best employed methods for eliminating NO and CO are the catalytic re- ductive and oxidative mechanisms, respectively. Both CO and NO are used as common probe molecules in sur- face science to obtain fundamental information about the gas-surface interactions, adsorption sites, and reactive dynamics on variety of metals [2]. One of the most im- portant reactions in automobile exhaust catalysis is the reaction between NO and CO over metal oxide surfaces: 2 gg 2 NOCOCO1 2N g (1) Rhodium, platinum and palladium are mostly used to catalyze the reaction in Equation (1) [3]. A Pt/TiO2 sam- ple has been studied by adsorption and co-adsorption of CO + NO [4]. The activity of Rh supported on the ceria doped titania was investigated and it was found that the presence of ceria favors the Rh dispersion [5]. González et al. [6] reported that Pt supported on Ce-modified TiO2 support exhibited better activity for water gas shift reac- tion than those corresponding to individual CeO2 and TiO2-supported catalysts. These catalysts were prepared by using metal/Ti ratios of 0.5 for Pt/Ti and 0.005 - 0.07 for Ce/Ti. It will be important to prepare Ce-promoted Pt/TiO2 catalyst and test it for NO + CO adsorption and interaction as an oxidative/reductive catalytic method for harmful gas removal. In situ IR spectroscopy study of adsorbed probe mole- cules, especially of CO, is very useful for the characteri- zation of solid surfaces and gives a unique possibility to characterize the coordination state and electrophilic pro- perties of accessible sites [7]. Activity measurements, when coupled with the physicochemical characterization of catalysts suggest that the modifications in the surface reducibility of the support play an essential role in the enhancement of activity and stability observed when Pt- modified TiO2 was promoted with CeO2. Hence, testing the gas interaction over the reduced catalyst should be informative. The purpose of the present work is to investigate the C opyright © 2013 SciRes. MRC  Z. M. EL-BAHY 137 effect of cerium oxide addition on the structure and ad- sorption properties of titania-supported platinum catalyst. CO and/or NO were admitted to the prepared catalysts and the interaction of admitted gases over the catalysts surface was monitored by in situ FTIR spectroscopy technique. X-ray diffraction (XRD), Temperature Pro- grammed Desorption (TPD) of CO and Diffuse reflection spectra (UV) were used for solid characterization. 2. Experimental 2.1. Catalyst Preparation Analytical grade reagents, Pt(NH3)4Cl2·H2O, Ce(NO3)3·6H2O and TiO2 (Degussa P25, known as a commonly used photocatalyst), were employed as start- ing materials in this study. The metal supported TiO2 nanoparticles were prepared by the incipient wetness impregnation method. TiO2 (4 g) was placed and stirred in water to form a homogenous suspension. A proper amount of an aqueous solution of Pt2+, Ce3+ and (Pt2+ + Ce3+) was added to TiO2 suspension to form the required Pt, Ce, and (Pt + Ce)/TiO2 ratios, respectively. The molar ratio Pt/Ti was fixed at 1% and Ce/Ti was changed in the range of 0.05% - 1%. The Pt, Ce and (Pt + Ce) supported TiO2 precursors slurry were refluxed at 80˚C with con- tinuous stirring for 3 h. After impregnation the water was allowed to evaporate using rotary evaporator and the re- sidues were dried at 110˚C over night. The obtained sol- ids were then calcined at 500˚C in air for 3 h with ramp rate of 2˚C /min. The samples were referred to as Pt/TiO2, Cex/TiO2 and PtCex/TiO2 for Pt, Ce and PtCe-supported titania, where x denotes to the Ce/Ti ratio. 2.2. Catalysts Characterizations X-ray diffraction (XRD) technique was used to deter- mine the bulk crystalline structures of the prepared cata- lysts. The XRD patterns were obtained with an x-ray diffractometer, D8 Advance (Bruker axs), with a Cu Kα radiation source (30 kV and 20 mA) in the 2θ range of 20˚ - 60˚. The average crystallize size (D) of the obtained powders was calculated by Hall-equation-Scherrer’s for- mula D = 0.9λ/βcosθ [8]; where λ represents the x-ray wavelength (1.54 Ǻ), θ is the Bragg’s angle and β (in radians) is the pure full width of the fraction line at half of the maximum capacity. Temperature Programmed Desorption (TPD) experi- ments were carried out using CO gas in a fixed-bed re- actor system. Before TPD measurements, the catalyst (30 mg) was treated at 500˚C for 1 h in air. Then the heated sample was evacuated for 1 h at the same temperature under vacuum (10−4 torr). The sample was then cooled under the same pressure until room temperature and then an amount of CO gas with partial pressure of 7 torr was added and left to equilibrate for 30 min. The sample was then degassed for 1 h at room temperature. The degassed CO molecules (m/z = 28) were monitored by a gas de- sorption analyzer (ANELVA, M-QA100TS) equipped with a quadruple mass analyzer in a high-vacuum cham- ber of 7.5 × 10⁻⁹ torr range. TPD profiles were recorded by linear heating of the samples from 25˚C to 750˚C at constant ramp rate of 5˚/min. The UV-vis diffuse reflectance spectra of various sam- ples in the 700 - 200 nm range were obtained using a Jasco V-570 (serial number, C29635) spectrophotometer equipped with a diffuse reflectance attachment, using BaSO4 as a reference. 2.3. Gas Adsorption and Catalytic Activity Measurements In situ FTIR spectra of CO and/or NO adsorption (7 torr of each) were recorded using JASCO FTIR-660 Plus. Briefly, 15 - 20 mg/cm2 self-supporting pellets of the ca- talyst powder were prepared and treated directly in the purpose-made IR quartz cell equipped with CaCl2 win- dows. The IR cell was connected to a static vacuum-ad- sorption system with a residual pressure below 10−4 torr. The samples were heated at 500˚C for 2 h in air followed by 1 h evacuation at same temperature. Then the cata- lysts were cooled at room temperature (RT) and at this point, background spectrum was recorded. CO and/or NO gas mixtures were then admitted. The gases were used in equal partial pressure of 7 torr of each (CO:NO; 1:1). After gas admission, the cell was left to equilibrate for 20 min at RT after which the spectrum was recorded again. The former spectrum (before gas admission) was subtracted from the latter one (after gas admission) and will be discussed below. To test the adsorption at higher temperature, the temperature of the IR cell, including the sample wafer and the gas mixture, was raised to the de- sired temperature. It was kept at such temperature for 20 min after which the IR cell was cooled to RT and then the spectrum was recorded, and kept to test the effect of the addition of trace amount of water vapor, it was added in the gas mixture with a ratio of (CO + NO + H2O; 7:7:1). 3. Results and Discussions 3.1. Catalyst Characterization 3.1.1. X-Ray Diffr ac tion XRD was usually used for identification of the crystal phase and estimation of the ratio of the anatase to rutile as well as crystallite size of each phase. Figure 1 shows the XRD patterns of titania and metal supported TiO2 catalysts. The patterns proved the presence of both ana- tase and rutile phases in all samples. The peaks at 2θ = 26.1 (101), 38.6 (112), 48.8 (200) and 55˚ (211) in the spectrum of all samples are easily identified as the crystal Copyright © 2013 SciRes. MRC  Z. M. EL-BAHY 138 of anatase form [PDF# 84 - 1286], whereas the XRD peaks at 2θ = 28.2 (110), 36.9 (101), 42 (111) and 55.9˚ (211) are easily taken as the crystal of rutile form [PDF# 88 - 1175]. In addition, small peak at 2θ = 37.9˚ due to titanate (H2Ti4O9·1.9H2O) [PDF# 39 - 0040] was ob- served and increased in samples containing Pt. The pat- terns did not show any peaks for loaded metal oxides, indicating that these metal oxides were well dispersed in all cases. The XRD intensities of the anatase peak at 2θ = 26.1˚ and the rutile peak 2θ = 28.2˚ were also analyzed to determine the percentage of anatase in the samples from the respective integrated XRD peak intensities using the following equation [9]: Χ (%) = 100/(1 + 1.265IR/IA), where X is the weight percentage of anatase in the sam- ple; IA represents the intensity of the anatase peak at 2θ = 26.12˚ and IR is that of the rutile peak at 2θ = 28.2˚. The patterns in Figure 1 and the data listed in Table 1 show that most of the structure of the prepared samples is ana- tase form. It could be seen that the presence of other metal oxides such as Pt or Ce oxides increased the ana- tase ratio. These data demonstrated that the employed metals could inhibit the transformation from anatase to rutile. These observations are in good agreement with previous reports [10]. The particle size of the prepared 20 25 30 35 40 45 50 55 60 A A R R R A TR A TiO 2 Pt/TiO 2 PtCe 0.05 /TiO 2 PtCe 0.1 /TiO 2 Ce 0.1 /TiO 2 PtCe 1 /TiO 2 2 theta, degree Counts, au A= Anatase; R = Rutile; T = Titanate Figure 1. X-ray powder diffraction patterns of parent TiO2 and Pt and Ce-supported TiO 2 catalysts. Table 1. Crystallite size of parent TiO2 and Ce- and Pt- supported TiO2 catalysts. Phase % by XRD Crystallite size, nm Catalyst Anatase Rutime Anatase, Rutile Band gap, ev TiO2 72.6 27.4 19.9 25.1 3.1 PtTiO2 80.0 20.0 21.5 27.2 2.95 Ce0.1TiO2 72.3 27.7 20.6 25.7 2.85 PtCe0.05TiO2 76.0 24.0 17.8 24.9 - PtCe0.1TiO2 82.3 17.7 22.6 34.9 2.9 PtCe1TiO2 74.6 25.4 19.4 26.7 solids was calculated using Scherrer’s equation. Table 1 shows the average crystallite size for both anatase (2θ = 25.9˚, 38.5˚ and 48.7˚) and rutile (2θ = 28.1˚, 36.7˚ and 55.9˚) phases. The particle size was found to be in the range of 19 - 22 nm for anatase phase while it was 25 - 35 nm for rutile phase. 3.1.2. Temperature Programmed Desorption (TPD) The TPD spectra after CO adsorption of pure TiO2 and the prepared catalysts are shown in Figure 2. The mag- nitude of the desorption maxima differs somewhat be- tween the metal-free and supported TiO2 samples. The CO peak maximum for pure TiO2 is observed at ap- proximately ≈540˚C. This profile changed after loading of Pt and Ce to TiO2 surface. In case of Pt/TiO2, three CO desorption peaks can be distinguished at ≈175˚C, 560˚C and ≈695˚C. However, Ce0.1/TiO2 showed one CO desorption peak at ≈615˚C. This indicates that CeO2 does not show any CO adsorption which in accordance with other reports [11], though it caused the shift of CO de- sorption peak to higher temperature compared to that of Ce-free TiO2. Bimetallic PtCe0.1/TiO2 sample showed two desorption peaks at ≈125˚C and another one at ≈ 560˚C. The CO desorption temperatures of Ce0.1/TiO2 and Pt/TiO2 are anomalously high comparing to the de- sorption values of TiO2 i.e. these samples have higher molecular CO desorption energy due to the creation of strong basic sites. The strong basic sites of Pt/TiO2 at- tenuated in presence of Ce in Pt/Ce0.1/TiO2. Such at- tenuation may be due to site-blocking effect of the other metal ion (Ce) which occupies adsorption sites for CO and suppresses CO chemisorptions [12]. The data show- ed that the apparent area under peaks for Pt/TiO2 is larger than that for PtCe0.1/TiO2 indicating that the dispersion of Pt in the former is higher than that in the later [11]. 3.1.3. UV-vis Diffuse Reflectance Diffuse reflection spectra of pure TiO2 and metal sup- Ms signal intensity, au Temperature, ˚C 0 100 200 300 400 500 600 700 PtTiO 2 695˚C PtCe 0.1 TiO 2 Ce 0.1 TiO 2 TiO 2 500˚C 614˚C 560˚C 540˚C 174˚C Figure 2. CO-TPD profiles of parent TiO2 and the prepared solids. Copyright © 2013 SciRes. MRC  Z. M. EL-BAHY 139 ported catalysts are shown in Figure 3. Generally, ana- tase-type TiO2 crystalline has a strong absorption edge below 380 nm [13]. From the presented profiles, the pre- pared samples showed mainly anatase structure which is consistent with XRD patterns. In addition, after mounting metal ions to the surface of TiO2, the slopes of the ab- sorption edges slightly changed compared with pure TiO2. The band gap energy was estimated with the Kubelka- Munk method using diffuse reflectance spectra [14]. Af- ter calculations, unpromoted titania has a typical band gap of 3.1 ev, whereas the band gap magnitude of the metal supported titania decreased slightly; that is 2.95, 2.9 and 2.85 ev for Pt/TiO2, PtCe0.1/TiO2 and Ce0.1/TiO2, respectively, as listed in Table 1. These results disclose one crucial fact that the employed metals interact with TiO2 and hence the band gap changed. 3.2. Adsorption of CO on the Prepared Samples The results of CO adoption (7 torr) over the pure TiO2 and metal loaded TiO2 at RT in the range of 2400 - 1100 cm−1 are presented in Figure 4. Since the absorptions regions of Ptn+-CO and Ti4+-CO carbonyls may overlap, it was important to study the adsorption of CO over metal free TiO2. Adsorption of CO on TiO2 sample, Fig- ure 4(a), leads to the appearance of two bands, at 2205 and 2189 cm−1 which are produced by carbonyl com- plexes of two types of coordinatively unsaturated sites (c.u.s.) Ti4+ cations (α- and β-Ti4+, respectively) [15]. The β-Ti4+ sites are the highly unsaturated sites due to kinks and corners [5]. It was reported that the IR bands in the 1600 - 1200 cm−1 is mainly due to the formation of large number of different adsorbed carbonate species. In addi- tion, formate (HCOO-) species can be excluded because they are formed at relatively high temperatures (227˚C) [16]. Consequently, the existence of different bands in the region of 1600 - 1220 cm−1 (1356, 1435 and 1533 cm−1) under the present adsorption conditions may Absorbance, au TiO 2 PtC e 0.1 /TiO 2 Ce 0.1 /TiO 2 P t/TiO 2 Wavelength, nm 210 260 310 360 410 460 Figure 3. UV-vis diffuse reflectance of parent TiO2 and the prepared catalysts. Pt/TiO 2 TiO 2 PtCe0.1TiO 2 Ce0.1TiO 2 2200 2000 1800 1600 1400 1200 2191 2101 2140 2205 2187 1735 1465 1384 1273 2205 2187 2096 2084 1706 1690 Wavenumber, cm Absorbance, au (a) (b) (c) (d) Figure 4. FTIR spectra after admission of CO (7 torr) over parent TiO2 and Pt and Ce-supported TiO2. be taken with a higher degree of confidence to νas(COO-) and νs(COO-) with a geometry change of these species [16]. This indicates that CO can be converted to carbon- ate species over TiO2 even at RT. Indeed, the formation of carbonate has been previously confirmed spectro- scopically on surfaces of various oxides as a result of the adsorption of CO on coordinatively unsaturated Lewis acid-base pair sites (Mn+-O2−), similar to the results re- ported for CO adsorption over ZrO2 [17], PrO2 [16] or PtY [18]. To reveal the effect of Ce and Pt loading on TiO2 sur- face, the in-situ FTIR of CO adsorption on the samples Ce0.1/TiO2, Pt/TiO2 and PtCe0.1/TiO2 was performed and the results are presented in Figures 4(b)-(d) as well. In case of Pt/TiO2, the peaks characteristic of Ti4+ at 2189 and 2205 cm−1 were observed besides three peaks at 2082, 2096 and 2128 cm−1 which are attributed to line- arly adsorbed Pt0-CO, Pt+-CO and Pt2+-CO, respectively [18,19]. The adsorption peaks at 1276, 1362 and 1467, 1690 cm−1 are also related to the presence of carbonate species which are formed on Ptn+-O2− or Ti4+-O2− sites. A peak at 1737 cm−1 was observed which is due to car- boxylate (COO−) species [20]. For Ce0.1/TiO2 catalyst, there were only two peaks at 2187 and 2205 cm−1. It was reported in literature that, two weak peaks at 2177 and 2156 cm−1 were found for CO adsorbed on ceria after evacuation at liquid nitrogen temperature [21]. However, our adsorption temperature is much higher than −196˚C, so it is expected to not ob- serve any of CO adsorption peaks on ceria. Consequently, the peaks at 2187 and 2205 cm−1 are characteristic of CO adsorption on β- and α-Ti4+ sites, respectively. This is also in agreement with the work of Chen et al. [22]. This spectrum also shows peaks characteristic of CO oxida- tion products such as (-COO−) at 1735 cm−1 and carbon- ate species at 1700, 1694, 1467, 1384 and 1273 cm−1. Copyright © 2013 SciRes. MRC 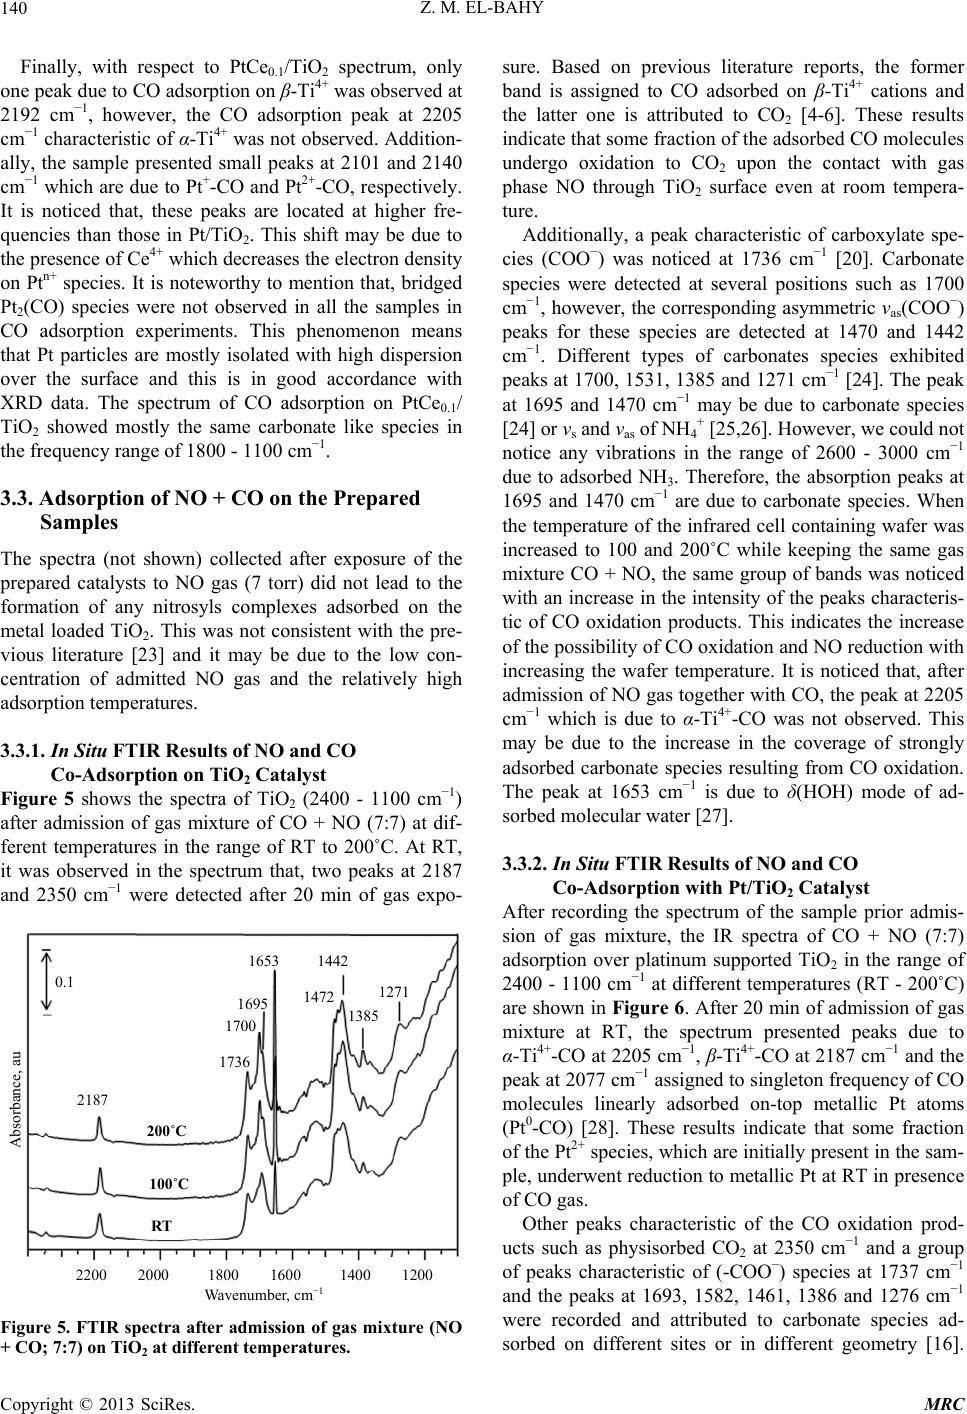 Z. M. EL-BAHY 140 Finally, with respect to PtCe0.1/TiO2 spectrum, only one peak due to CO adsorption on β-Ti4+ was observed at 2192 cm−1, however, the CO adsorption peak at 2205 cm−1 characteristic of α-Ti4+ was not observed. Addition- ally, the sample presented small peaks at 2101 and 2140 cm−1 which are due to Pt+-CO and Pt2+-CO, respectively. It is noticed that, these peaks are located at higher fre- quencies than those in Pt/TiO2. This shift may be due to the presence of Ce4+ which decreases the electron density on Ptn+ species. It is noteworthy to mention that, bridged Pt2(CO) species were not observed in all the samples in CO adsorption experiments. This phenomenon means that Pt particles are mostly isolated with high dispersion over the surface and this is in good accordance with XRD data. The spectrum of CO adsorption on PtCe0.1/ TiO2 showed mostly the same carbonate like species in the frequency range of 1800 - 1100 cm−1. 3.3. Adsorption of NO + CO on the Prepared Samples The spectra (not shown) collected after exposure of the prepared catalysts to NO gas (7 torr) did not lead to the formation of any nitrosyls complexes adsorbed on the metal loaded TiO2. This was not consistent with the pre- vious literature [23] and it may be due to the low con- centration of admitted NO gas and the relatively high adsorption temperatures. 3.3.1. In Situ FTIR Results of NO and CO Co-Adsorption on TiO2 Cat alys t Figure 5 shows the spectra of TiO2 (2400 - 1100 cm−1) after admission of gas mixture of CO + NO (7:7) at dif- ferent temperatures in the range of RT to 200˚C. At RT, it was observed in the spectrum that, two peaks at 2187 and 2350 cm−1 were detected after 20 min of gas expo- Absorbance, au Wavenumber, c −1 2200 2000 1800 1600 1400 1200 200˚C 100˚C RT 2187 1736 1700 1695 1653 1442 1472 1385 1271 0.1 Figure 5. FTIR spectra after admission of gas mixture (NO + CO; 7:7) on TiO2 at different temperatures. sure. Based on previous literature reports, the former band is assigned to CO adsorbed on β-Ti4+ cations and the latter one is attributed to CO2 [4-6]. These results indicate that some fraction of the adsorbed CO molecules undergo oxidation to CO2 upon the contact with gas phase NO through TiO2 surface even at room tempera- ture. Additionally, a peak characteristic of carboxylate spe- cies (COO−) was noticed at 1736 cm−1 [20]. Carbonate species were detected at several positions such as 1700 cm−1, however, the corresponding asymmetric νas(COO−) peaks for these species are detected at 1470 and 1442 cm−1. Different types of carbonates species exhibited peaks at 1700, 1531, 1385 and 1271 cm−1 [24]. The peak at 1695 and 1470 cm−1 may be due to carbonate species [24] or νs and νas of NH4 + [25,26]. However, we could not notice any vibrations in the range of 2600 - 3000 cm−1 due to adsorbed NH3. Therefore, the absorption peaks at 1695 and 1470 cm−1 are due to carbonate species. When the temperature of the infrared cell containing wafer was increased to 100 and 200˚C while keeping the same gas mixture CO + NO, the same group of bands was noticed with an increase in the intensity of the peaks characteris- tic of CO oxidation products. This indicates the increase of the possibility of CO oxidation and NO reduction with increasing the wafer temperature. It is noticed that, after admission of NO gas together with CO, the peak at 2205 cm−1 which is due to α-Ti4+-CO was not observed. This may be due to the increase in the coverage of strongly adsorbed carbonate species resulting from CO oxidation. The peak at 1653 cm−1 is due to δ(HOH) mode of ad- sorbed molecular water [27]. 3.3.2. In Situ FTIR Results of NO and CO Co-Adsorption with Pt/TiO2 Catalyst After recording the spectrum of the sample prior admis- sion of gas mixture, the IR spectra of CO + NO (7:7) adsorption over platinum supported TiO2 in the range of 2400 - 1100 cm−1 at different temperatures (RT - 200˚C) are shown in Figure 6. After 20 min of admission of gas mixture at RT, the spectrum presented peaks due to α-Ti4+-CO at 2205 cm−1, β-Ti4+-CO at 2187 cm−1 and the peak at 2077 cm−1 assigned to singleton frequency of CO molecules linearly adsorbed on-top metallic Pt atoms (Pt0-CO) [28]. These results indicate that some fraction of the Pt2+ species, which are initially present in the sam- ple, underwent reduction to metallic Pt at RT in presence of CO gas. Other peaks characteristic of the CO oxidation prod- ucts such as physisorbed CO2 at 2350 cm−1 and a group of peaks characteristic of (-COO−) species at 1737 cm−1 and the peaks at 1693, 1582, 1461, 1386 and 1276 cm−1 were recorded and attributed to carbonate species ad- sorbed on different sites or in different geometry [16]. Copyright © 2013 SciRes. MRC 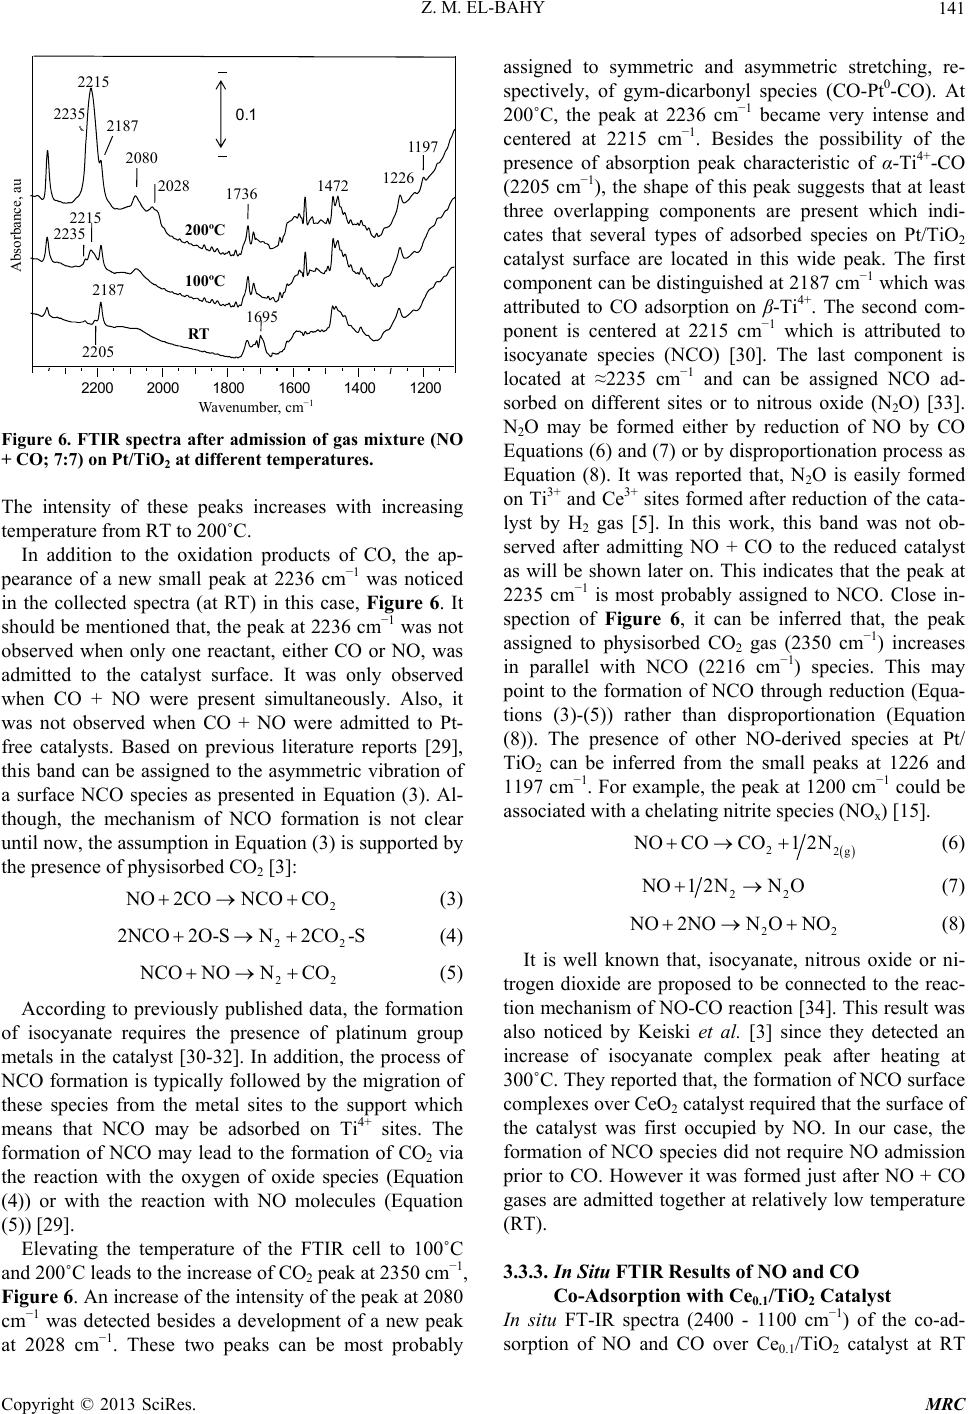 Z. M. EL-BAHY 141 Wavenumber, cm −1 Absorbance, au 0.1 2200 2000 1800 1600 1400 1200 RT 200ºC 100ºC 2187 2080 1695 1472 1226 2215 2235 2187 2205 2215 2235 2028 1736 1197 Figure 6. FTIR spectra after admission of gas mixture (NO + CO; 7:7) on Pt/TiO2 at different temperatures. The intensity of these peaks increases with increasing temperature from RT to 200˚C. In addition to the oxidation products of CO, the ap- pearance of a new small peak at 2236 cm−1 was noticed in the collected spectra (at RT) in this case, Figure 6. It should be mentioned that, the peak at 2236 cm−1 was not observed when only one reactant, either CO or NO, was admitted to the catalyst surface. It was only observed when CO + NO were present simultaneously. Also, it was not observed when CO + NO were admitted to Pt- free catalysts. Based on previous literature reports [29], this band can be assigned to the asymmetric vibration of a surface NCO species as presented in Equation (3). Al- though, the mechanism of NCO formation is not clear until now, the assumption in Equation (3) is supported by the presence of physisorbed CO2 [3]: 2 O2CO NCOCO (3) 22 2NCO2O-SN2CO -S (4) 22 CO NONCO (5) According to previously published data, the formation of isocyanate requires the presence of platinum group metals in the catalyst [30-32]. In addition, the process of NCO formation is typically followed by the migration of these species from the metal sites to the support which means that NCO may be adsorbed on Ti4+ sites. The formation of NCO may lead to the formation of CO2 via the reaction with the oxygen of oxide species (Equation (4)) or with the reaction with NO molecules (Equation (5)) [29]. Elevating the temperature of the FTIR cell to 100˚C and 200˚C leads to the increase of CO2 peak at 2350 cm−1, Figure 6. An increase of the intensity of the peak at 2080 cm−1 was detected besides a development of a new peak at 2028 cm−1. These two peaks can be most probably assigned to symmetric and asymmetric stretching, re- spectively, of gym-dicarbonyl species (CO-Pt0-CO). At 200˚C, the peak at 2236 cm−1 became very intense and centered at 2215 cm−1. Besides the possibility of the presence of absorption peak characteristic of α-Ti4+-CO (2205 cm−1), the shape of this peak suggests that at least three overlapping components are present which indi- cates that several types of adsorbed species on Pt/TiO2 catalyst surface are located in this wide peak. The first component can be distinguished at 2187 cm−1 which was attributed to CO adsorption on β-Ti4+. The second com- ponent is centered at 2215 cm−1 which is attributed to isocyanate species (NCO) [30]. The last component is located at ≈2235 cm−1 and can be assigned NCO ad- sorbed on different sites or to nitrous oxide (N2O) [33]. N2O may be formed either by reduction of NO by CO Equations (6) and (7) or by disproportionation process as Equation (8). It was reported that, N2O is easily formed on Ti3+ and Ce3+ sites formed after reduction of the cata- lyst by H2 gas [5]. In this work, this band was not ob- served after admitting NO + CO to the reduced catalyst as will be shown later on. This indicates that the peak at 2235 cm−1 is most probably assigned to NCO. Close in- spection of Figure 6, it can be inferred that, the peak assigned to physisorbed CO2 gas (2350 cm−1) increases in parallel with NCO (2216 cm−1) species. This may point to the formation of NCO through reduction (Equa- tions (3)-(5)) rather than disproportionation (Equation (8)). The presence of other NO-derived species at Pt/ TiO2 can be inferred from the small peaks at 1226 and 1197 cm−1. For example, the peak at 1200 cm−1 could be associated with a chelating nitrite species (NOx) [15]. 22g NOCOCO12N (6) 2 2 O12N NO (7) 22 O2NO NONO (8) It is well known that, isocyanate, nitrous oxide or ni- trogen dioxide are proposed to be connected to the reac- tion mechanism of NO-CO reaction [34]. This result was also noticed by Keiski et al. [3] since they detected an increase of isocyanate complex peak after heating at 300˚C. They reported that, the formation of NCO surface complexes over CeO2 catalyst required that the surface of the catalyst was first occupied by NO. In our case, the formation of NCO species did not require NO admission prior to CO. However it was formed just after NO + CO gases are admitted together at relatively low temperature (RT). 3.3.3. In Situ FTIR Results of NO and CO Co-Adsorption with Ce0.1/TiO2 Catalyst In situ FT-IR spectra (2400 - 1100 cm−1) of the co-ad- sorption of NO and CO over Ce0.1/TiO 2 catalyst at RT Copyright © 2013 SciRes. MRC 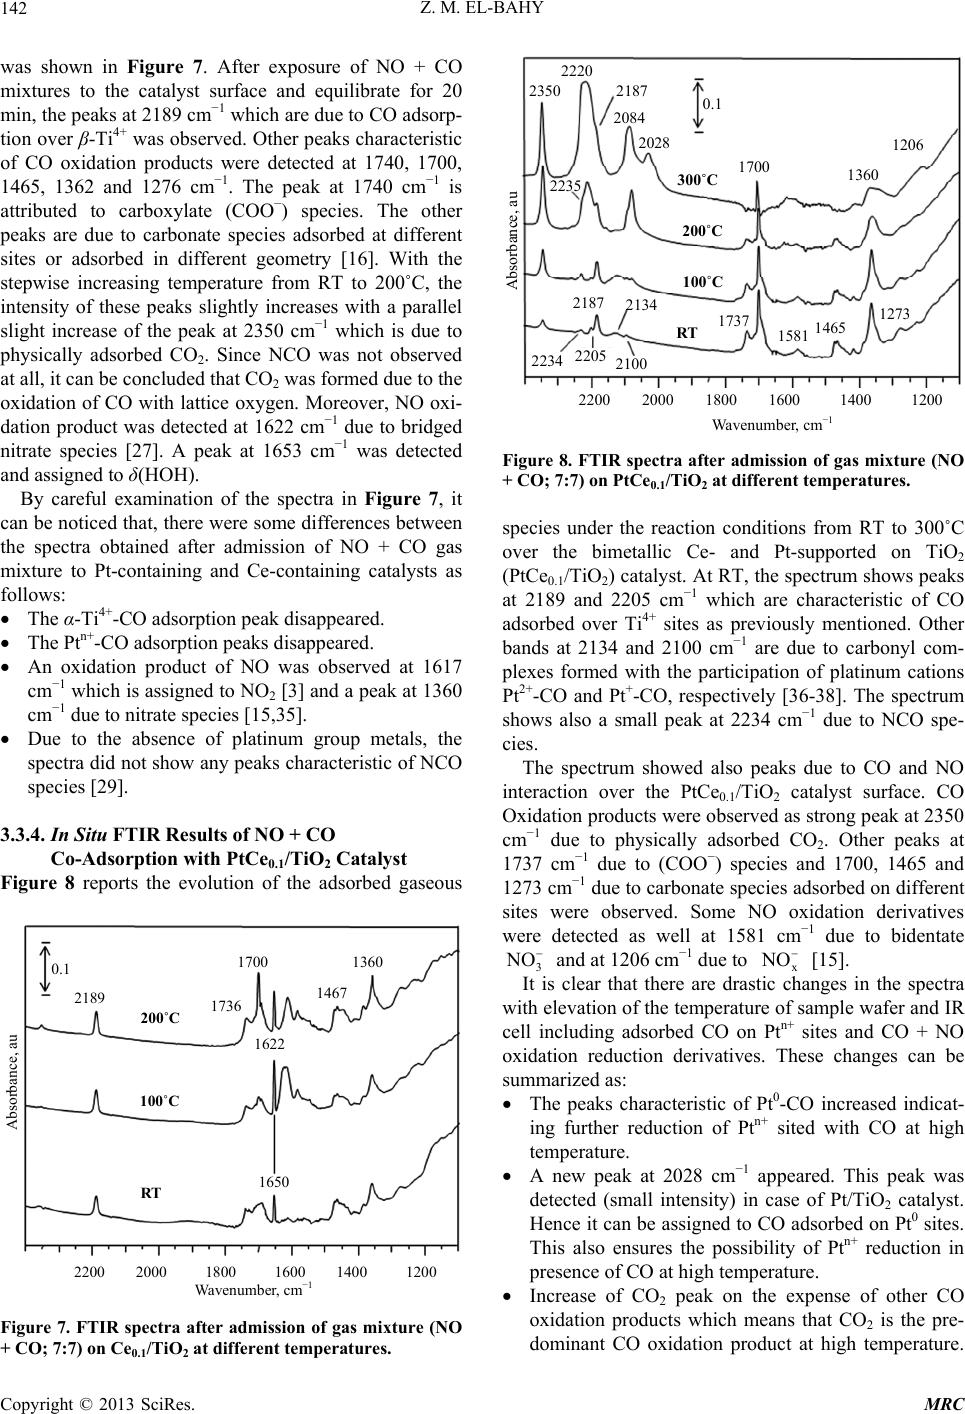 Z. M. EL-BAHY 142 was shown in Figure 7. After exposure of NO + CO mixtures to the catalyst surface and equilibrate for 20 min, the peaks at 2189 cm−1 which are due to CO adsorp- tion over β-Ti4+ was observed. Other peaks characteristic of CO oxidation products were detected at 1740, 1700, 1465, 1362 and 1276 cm−1. The peak at 1740 cm−1 is attributed to carboxylate (COO−) species. The other peaks are due to carbonate species adsorbed at different sites or adsorbed in different geometry [16]. With the stepwise increasing temperature from RT to 200˚C, the intensity of these peaks slightly increases with a parallel slight increase of the peak at 2350 cm−1 which is due to physically adsorbed CO2. Since NCO was not observed at all, it can be concluded that CO2 was formed due to the oxidation of CO with lattice oxygen. Moreover, NO oxi- dation product was detected at 1622 cm−1 due to bridged nitrate species [27]. A peak at 1653 cm−1 was detected and assigned to δ(HOH). By careful examination of the spectra in Figure 7, it can be noticed that, there were some differences between the spectra obtained after admission of NO + CO gas mixture to Pt-containing and Ce-containing catalysts as follows: The α-Ti4+-CO adsorption peak disappeared. The Ptn+-CO adsorption peaks disappeared. An oxidation product of NO was observed at 1617 cm−1 which is assigned to NO2 [3] and a peak at 1360 cm−1 due to nitrate species [15,35]. Due to the absence of platinum group metals, the spectra did not show any peaks characteristic of NCO species [29]. 3.3.4. In Situ FTIR Results of NO + CO Co-Adsorption with PtCe0.1/TiO2 Catalyst Figure 8 reports the evolution of the adsorbed gaseous Absorbance, au Wavenumber, cm−1 2200 2000 1800 1600 1400 1200 200˚C 100˚C RT 1650 1622 1736 1700 2189 1467 1360 0.1 Figure 7. FTIR spectra after admission of gas mixture (NO + CO; 7:7) on Ce0.1/TiO2 at different temperatures. Absorbance, au Wavenumber, cm −1 2200 2000 1800 1600 1400 1200 2350 300˚C 200˚C 100˚C RT 2220 2187 2084 2028 0.1 1700 2187 2134 2234 2205 2100 1737 1360 1206 1273 1465 1581 2235 Figure 8. FTIR spectra after admission of gas mixture (NO + CO; 7:7) on PtCe0.1/TiO2 at different temperatures. species under the reaction conditions from RT to 300˚C over the bimetallic Ce- and Pt-supported on TiO2 (PtCe0.1/TiO2) catalyst. At RT, the spectrum shows peaks at 2189 and 2205 cm−1 which are characteristic of CO adsorbed over Ti4+ sites as previously mentioned. Other bands at 2134 and 2100 cm−1 are due to carbonyl com- plexes formed with the participation of platinum cations Pt2+-CO and Pt+-CO, respectively [36-38]. The spectrum shows also a small peak at 2234 cm−1 due to NCO spe- cies. The spectrum showed also peaks due to CO and NO interaction over the PtCe0.1/TiO2 catalyst surface. CO Oxidation products were observed as strong peak at 2350 cm−1 due to physically adsorbed CO2. Other peaks at 1737 cm−1 due to (COO−) species and 1700, 1465 and 1273 cm−1 due to carbonate species adsorbed on different sites were observed. Some NO oxidation derivatives were detected as well at 1581 cm−1 due to bidentate 3 NO and at 1206 cm−1 due to [15]. x It is clear that there are drastic changes in the spectra with elevation of the temperature of sample wafer and IR cell including adsorbed CO on Ptn+ sites and CO + NO oxidation reduction derivatives. These changes can be summarized as: NO The peaks characteristic of Pt0-CO increased indicat- ing further reduction of Ptn+ sited with CO at high temperature. A new peak at 2028 cm−1 appeared. This peak was detected (small intensity) in case of Pt/TiO2 catalyst. Hence it can be assigned to CO adsorbed on Pt0 sites. This also ensures the possibility of Ptn+ reduction in presence of CO at high temperature. Increase of CO2 peak on the expense of other CO oxidation products which means that CO2 is the pre- dominant CO oxidation product at high temperature. Copyright © 2013 SciRes. MRC 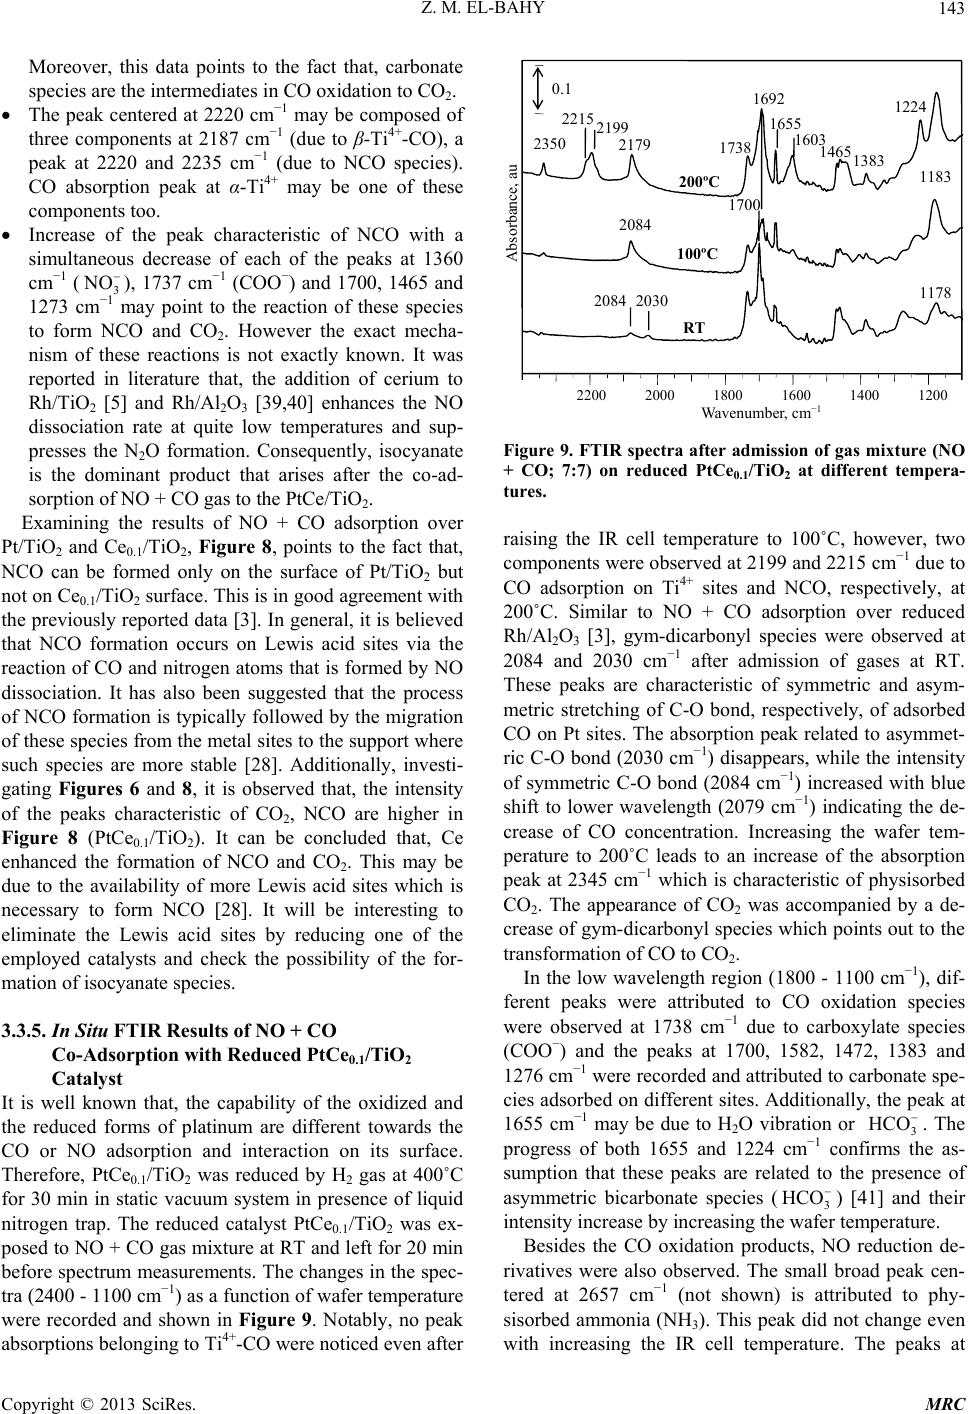 Z. M. EL-BAHY 143 Moreover, this data points to the fact that, carbonate species are the intermediates in CO oxidation to CO2. The peak centered at 2220 cm−1 may be composed of three components at 2187 cm−1 (due to β-Ti4+-CO), a peak at 2220 and 2235 cm−1 (due to NCO species). CO absorption peak at α-Ti4+ may be one of these components too. Increase of the peak characteristic of NCO with a simultaneous decrease of each of the peaks at 1360 cm−1 (3 NO ), 1737 cm−1 (COO−) and 1700, 1465 and 1273 cm−1 may point to the reaction of these species to form NCO and CO2. However the exact mecha- nism of these reactions is not exactly known. It was reported in literature that, the addition of cerium to Rh/TiO2 [5] and Rh/Al2O3 [39,40] enhances the NO dissociation rate at quite low temperatures and sup- presses the N2O formation. Consequently, isocyanate is the dominant product that arises after the co-ad- sorption of NO + CO gas to the PtCe/TiO2. Examining the results of NO + CO adsorption over Pt/TiO2 and Ce0.1/TiO2, Figure 8, points to the fact that, NCO can be formed only on the surface of Pt/TiO2 but not on Ce0.1/TiO2 surface. This is in good agreement with the previously reported data [3]. In general, it is believed that NCO formation occurs on Lewis acid sites via the reaction of CO and nitrogen atoms that is formed by NO dissociation. It has also been suggested that the process of NCO formation is typically followed by the migration of these species from the metal sites to the support where such species are more stable [28]. Additionally, investi- gating Figures 6 and 8, it is observed that, the intensity of the peaks characteristic of CO2, NCO are higher in Figure 8 (PtCe0.1/TiO2). It can be concluded that, Ce enhanced the formation of NCO and CO2. This may be due to the availability of more Lewis acid sites which is necessary to form NCO [28]. It will be interesting to eliminate the Lewis acid sites by reducing one of the employed catalysts and check the possibility of the for- mation of isocyanate species. 3.3.5. In Situ FTIR Results of NO + CO Co-Adsorption with Reduced PtCe0.1/TiO2 Catalyst It is well known that, the capability of the oxidized and the reduced forms of platinum are different towards the CO or NO adsorption and interaction on its surface. Therefore, PtCe0.1/TiO2 was reduced by H2 gas at 400˚C for 30 min in static vacuum system in presence of liquid nitrogen trap. The reduced catalyst PtCe0.1/TiO2 was ex- posed to NO + CO gas mixture at RT and left for 20 min before spectrum measurements. The changes in the spec- tra (2400 - 1100 cm−1) as a function of wafer temperature were recorded and shown in Figure 9. Notably, no peak absorptions belonging to Ti4+-CO were noticed even after 0.1 2200 20001800 1600 14001200 RT 200ºC 100ºC 2350 2030 2084 2084 2199 2215 1738 1692 1700 1655 1603 1465 1383 1183 1224 1178 2179 Absorbance, au Wavenumber, cm −1 Figure 9. FTIR spectra after admission of gas mixture (NO + CO; 7:7) on reduced PtCe0.1/TiO2 at different tempera- tures. raising the IR cell temperature to 100˚C, however, two components were observed at 2199 and 2215 cm−1 due to CO adsorption on Ti4+ sites and NCO, respectively, at 200˚C. Similar to NO + CO adsorption over reduced Rh/Al2O3 [3], gym-dicarbonyl species were observed at 2084 and 2030 cm−1 after admission of gases at RT. These peaks are characteristic of symmetric and asym- metric stretching of C-O bond, respectively, of adsorbed CO on Pt sites. The absorption peak related to asymmet- ric C-O bond (2030 cm−1) disappears, while the intensity of symmetric C-O bond (2084 cm−1) increased with blue shift to lower wavelength (2079 cm−1) indicating the de- crease of CO concentration. Increasing the wafer tem- perature to 200˚C leads to an increase of the absorption peak at 2345 cm−1 which is characteristic of physisorbed CO2. The appearance of CO2 was accompanied by a de- crease of gym-dicarbonyl species which points out to the transformation of CO to CO2. In the low wavelength region (1800 - 1100 cm−1), dif- ferent peaks were attributed to CO oxidation species were observed at 1738 cm−1 due to carboxylate species (COO−) and the peaks at 1700, 1582, 1472, 1383 and 1276 cm−1 were recorded and attributed to carbonate spe- cies adsorbed on different sites. Additionally, the peak at 1655 cm−1 may be due to H2O vibration or 3 HCO . The progress of both 1655 and 1224 cm−1 confirms the as- sumption that these peaks are related to the presence of asymmetric bicarbonate species (3 HC ) [41] and their intensity increase by increasing the wafer temperature. O Besides the CO oxidation products, NO reduction de- rivatives were also observed. The small broad peak cen- tered at 2657 cm−1 (not shown) is attributed to phy- sisorbed ammonia (NH3). This peak did not change even with increasing the IR cell temperature. The peaks at Copyright © 2013 SciRes. MRC  Z. M. EL-BAHY 144 1696 and 1472 cm−1 were also observed and they are assigned to the νs and νas vibrations, respectively, of 4 ions [25,26]. A new peak at 1178 cm−1 was no- ticed after admission of the gas mixture at RT to the re- duced catalyst surface. According to Liu et al. [35], the peak at 1178 cm−1 is due to anionic nitrosyle (NO−) spe- cies. With increasing temperature to 100˚C and 200˚C, the intensity of this peak increased with a red shift to higher wavelength (1183 cm−1). It is noteworthy to men- tion that, NH3 and NO− were detected only after admis- sion of the gas mixture (NO + CO) over reduced PtCe0.1/ TiO2 catalyst but not over Pt/TiO2, Ce0.1/TiO 2 or as pre- pared PtCe0.1/TiO2. These data confirms that, at RT, the formation of NCO (as reductive derivative) is preferable over as-prepared Pt-containing catalysts while NH3 or NO− is preferable over reduced catalysts. NH It is clear that, all the absorption peaks characteristic of C containing species are shifted to lower wavelength with raising temperature. However, the peak at 1692 cm−1, which was detected at 100˚C and 200˚C, can be as- signed to() rather than () species. 2 3 CO 4 It is noteworthy to mention that, the absorption peak related to Pt0-CO increased with increasing temperature to 100 and 200˚C. Also, two peaks at 2345 and ≈2200 cm−1 were observed at 200˚C. These peaks are attributed to physisorbed CO2 and NCO species, respectively. The increase of the absorption peak characteristic of Pt0-CO and the increase of the peak characteristic of CO2 may indicate that carbonate species formed at RT may be re- duced once again to CO and forms Pt0-CO or they may be oxidized further to CO2 which is detected at 200˚C. These results confirm the assumption that NH 2 3 CO anion is an intermediate in the oxidation of CO to CO2. Fur- thermore, reduction of NO with CO (NO* + CO* → NCO* + O*) on the reduced catalysts surface occurs only at relatively high temperature (200˚C) on the reduced surface. Though, this reaction takes place at RT in the Pt-containing as-prepared catalysts. It was mentioned earlier that the presence of Pt sites are essential to the formation of NCO. The absence of both the absorption peaks characteristic of Ti4+-CO and NCO in the temperature range of RT - 100˚C provides clear evidence that Lewis acid sites (most probably Ti4+) is essential for the stabilization of isocyanate species. Nevertheless, NCO species formed at Pt sites can spill onto the support surface where they are accumulated and stabilized [29,30]. The rational increase of the peak characteristic of 3 with the decrease of 4 may indicate that bicarbonate species are formed by the interaction be- tween species and HCONH 2 4 NH 3 CO . 2 43 3 NHCONH HCO 3.3.6. In Situ FTIR Results of NO + CO Co-Adsorption with PtCe0.1/TiO2 Catalyst in Presence of Water Vapor Addition of trace amount of water vapor increased the activity towards the CO oxidation in presence of Pt and decreased the oxidation temperature as well [18,42-44]. Moreover, the gas exhaust usually contains water vapor and then it will be valuable to add trace amount of H2O vapor to the gas mixture to detect its effect on the NO + CO interaction. Figure 10 shows the spectra taken after 20 min of admission of the gas mixture (NO + CO + H2O; 7:7:1) over PtCe0.1/TiO2 to shade light on the effect of introducing water vapor during NO reduction by CO (more realistic conditions). After adsorption of the gas mixture at RT, several peaks were observed due to CO adsorption over Pt+-CO and Pt0-CO at 2094 and 2072 cm−1, respectively. A new peak at 1840 cm−1 due to bridged Pt0-CO-Pt0 was observed [4]. This indicates that the presence of water vapor leads to the decrease of Pt particles dispersion. With increasing temperature, the intensity of the peak at 2092 cm−1 decreases and the peak at 2072 cm−1 slightly shifted to lower frequency and even gained some intensity. This phenomenon is, however, most probably due to some reduction of cationic platinum to metal dur- ing the CO desorption. Also, at 200˚C, small intensity peaks were observed at ≈2350 cm−1 indicating the forma- tion of physically adsorbed CO2. Inspecting of Figure 10, isocyanate species NCO (2240 - 2200 cm−1) could not be observed in presence of water which means that the in- teraction of gas mixture (NO + CO) do not proceed in the pathway to form NCO even at high temperature. The small intensity peaks characteristic of CO2 may be formed by direct CO oxidation with lattice oxygen. It is clear that the Ti4+ sites were not observed except very Wavenumber, c −1 Absorbance, au 0.1 2200 2000 1800 1600 1400 1200 RT 200ºC 100ºC 1850 2072 2094 2068 2094 2068 1738 1700 1696 1465 1383 1611 1554 1183 1225 Figure 10. FTIR spectra after admission of gas mixture (NO + CO + H2O; 7:7:1) on PtCe0.1/TiO2 at different tempera- tures. 3 (9) Copyright © 2013 SciRes. MRC  Z. M. EL-BAHY 145 weak peak at 2180 cm−1 after raising IR cell temperature to 200˚C. This may be due to the competitive adsorption of H2O and CO over Ti4+ sites. The unavailability of Ti4+ and the absence of isocyanate species confirm the as- sumption that, Ti4+ sites (Lewis acid) are necessary as hosts for NCO species after their formation over Pt sites. The spectra were also studied in the frequency range of 1800 - 1100 cm−1. Different peaks characteristic of CO oxidation products were observed at 1738 cm−1 for car- boxylate (COO−), 1554 and 1225 cm−1 for bicarbonate (3) and (1700, 1611 and 1383 cm−1) for HCO2 3 CO species were detected. Finally, some NO reduction prod- ucts were also observed at 1696 and 1465 cm−1 for 4 NH and 1183 cm−1 for NO−. It can be seen that, by increasing the wafer temperature, the peak characteristic of NO− is red shifted to low wavenumber and the intensity of the peaks characteristic to CO + NO oxidative reductive products increased. 3.3.7. Effect of Ce Rati o on t h e in Situ FTIR Results of NO + CO Co-Adsorpt ion with PtCex/TiO2 Catalysts The influence of the amount of Ce in PtCex/TiO2 on the NO + CO adsorption and interaction on the catalyst sur- face was studied using the same above-mentioned ex- perimental conditions, except that the ratio of Ce/TiO2 was changed in the range of 0.05% - 1%. For the sake of simplicity, Figure 11 shows the spectra recorded after admission of the gas mixture and heating the wafer at 200˚C in the range of 2400 - 2000 cm−1 since the spectra did not show significant difference below 2000 cm−1 (now shown) in the CO oxidation products region. The spectra recorded after admission of gases to Pt/TiO2 was added for comparison. This spectrum Figure 11(a) shows different peaks characteristic of linear Pt0-CO (2077 cm−1), CO absorption peak on β-Ti4+ (2187 cm−1), NCO species adsorbed on different sites (2217 and 2236 cm−1) and finally physisorbed CO2 (2350 cm−1). Addition of Ce with 0.05 and 0.1% did not change the peak posi- tions however it caused drastic changes in the intensity of all the peaks since the peaks intensity was maximum in PtCe0.1/TiO2 sample. Increasing Ce content to 0.5% leads to the decrease of the peak intensity and all the peaks (except CO absorption peak on β-Ti4+) disappeared after raising the Ce content to 1%. As previously discussed, according to Di Monte et al. [33], the formation of iso- cyanate requires the presence of platinum group metals in the catalyst. The decrease of NCO and CO2 with in- creasing Ce and the vanish of the adsorption peaks of Ptn+-CO indicate that Ce atoms may block Pt sites at Ce/TiO2 ratio more than 0.1% and it totally mask Pt sites when Ce/TiO2 ratio is 1%. Consequently, neither NCO nor CO2 could be formed. As a result, the optimum ratio of Ce in Pt/TiO2 to reduce NO and oxidize CO is being Wavenumber, cm −1 2400 2300 2200 2100 2000 Absorbance, au 0.05 2236 2217 2187 2077 2350 2230 2187 2217 2084 2350 2187 (e) (d) (c) (b) (a) Figure 11. FTIR spectra after admission of gas mixture (NO + CO; 7:7) on PtCex/TiO2 at different temperatures. (a) x = 0; (b) x = 0.05; (c) x = 0.1; (d) x = 0.5; and (e) x = 1. 0.1%. It is noticed that, NCO was not detected after admis- sion of NO + CO over (PtCe1/TiO2, Ce0.1/TiO2 and TiO2) and also after admission of (NO + CO + H2O) over PtCe0.1/TiO2. In the former case, we could not observe any peak due to Ptn+-CO and in the later case we could not observe any peak due to Ti4+-CO. However, we ob- served NCO after admission of (NO + CO) over Pt/TiO2 and PtCe0.1/TiO2. In these cases, we observed both of Ptn+-CO and Ti4+-CO as well. From forgoing results, it is concluded that the presence of the mutual sites Ptn+ and Ti4+ is crucial for the formation of NCO as a result of NO reduction. Additionally, the activity of PtCe0.1/TiO2 was higher than Pt/TiO2, indicating that Ce enhances the re- action towards NO reduction and forms NCO. 4. Conclusion Platinum and cerium supported TiO2 catalysts were suc- cessfully prepared by incipient wetness impregnation method in the particle size range of 19 - 22 nm. Different reductive/oxidative species were observed after adsorp- tion of NO and/or CO gasses. The presented results in- stantly allowed us to estimate the chemisorbed species after the admission of NO + CO gas mixture and their interactions on Pt and Ce-containing catalysts supported on TiO2. The formation of both NCO and CO2 was par- alled indicating that their formation belongs to the same mechanism which is not certain until now. It was found that, the presence of both Pt sites and Ti4+ is important for NO reduction and NCO formation. Addition of Ce increased the formation of both NCO and CO2 and it was optimum Ce/TiO2 ratio of 0.1%. Copyright © 2013 SciRes. MRC  Z. M. EL-BAHY 146 REFERENCES [1] J. Beheshtian, M. Kamfiroozi, Z. Bagheri and A. Ahmadi, “Computational Study of CO and NO Adsorption on Magnesium Oxide Nanotubes,” Physica E, Vol. 44, No. 3, 2011, pp. 546-549. http://dx.doi.org/10.1016/j.physe.2011.09.016 [2] B. Z. Sun, W. K. Chen, J. D. Zheng and C. H. Lu, “Roles of Oxygen Vacancy in the Adsorption Properties of CO and NO on Cu2O(1 1 1) Surface: Results of a First-Prin- ciples Study,” Applied Surface Science, Vol. 255, No. 5, 2008, pp. 3141-3148. http://dx.doi.org/10.1016/j.apsusc.2008.09.005 [3] R. L. Keiski, M. Härkönen, A. Lahti, T. Maunula, A. Savimäki and T. Slotte, “An Infrared Study of CO and NO Adsorption on Pt, Rh, Pd 3-Way Catalysts, Catalysis and Automotive Pollution Control III,” Studies in Surface Science and Catalysis, Vol. 96, 1995, pp. 85-95. http://dx.doi.org/10.1016/S0167-2991(06)81421-7 [4] E. Ivanova, M. Mihaylov, F. Thibault-Starzyk, M. Daturi and K. Hadjiivanov, “FTIR Spectroscopy Study of CO and NO Adsorption and Co-Adsorption on Pt/TiO2,” Journal of Molecular Catalysis A, Vol. 274, No. 1-2, 2007, pp. 179-184. http://dx.doi.org/10.1016/j.molcata.2007.05.006 [5] E. Guglielminotti and F. Boccuzzi, “Spectroscopic Char- acterization of the CeO2/TiO2 and Rh-CeO2/TiO2 Sys- tems: CO Adsorption and NO-CO, NO-C3H8 Reactions,” Journal of Molecular Catalysis A, Vol. 104, No. 3, 1996, pp. 273-283. http://dx.doi.org/10.1016/1381-1169(95)00180-8 [6] I. D. González, R. M. Navarro, W. Wen, N. Marinkovic, J. A. Rodrigué, F. Rosa and J. L. G. Fierro, “A Comparative Study of the Water Gas Shift Reaction over Platinum Catalysts Supported on CeO2, TiO2 and Ce-Modified TiO2,” Catalysis Today, Vol. 149, No. 3-4, 2010, pp. 372- 379. http://dx.doi.org/10.1016/j.cattod.2009.07.100 [7] I. Malpartida, E. Ivanova, M. Mihaylov, K. Hadjiivanov, V. Blasin-Aube, O. Marie and M. Daturi, “CO and NO Adsorption for the IR Characterization of Fe2+ Cations in Ferrierite: An Efficient Catalyst for NOx SCR with NH3 as Studied by Operando IR Spectroscopy,” Catalysis To- day, Vol. 149, No. 3-4, 2010, pp. 295-303. http://dx.doi.org/10.1016/j.cattod.2009.09.015 [8] P. Klug and L. E. Alexander, “Direction Procedures for Polycrystalline and Amorphous Materials,” Wiley, New York, 1954. [9] Q. H. Zhang, L. Gao and J. K. Guo, “Effects of Calcina- tion on the Photocatalytic Properties of Nanosized TiO2 Powders Prepared by TiCl4 Hydrolysis,” Applied Cataly- sis B, Vol. 26, No. 3, 2000, pp. 207-215. http://dx.doi.org/10.1016/S0926-3373(00)00122-3 [10] L. Q. Jing, X. J. Sun, B. F. Xin, B. Q. Wang, W. M. Cai and H. G. Fu, “The Preparation and Characterization of La Doped TiO2 Nanoparticles and Their Photocatalytic Activity,” Journal of Solid State Chemistry, Vol. 177, No. 10, 2004, pp. 3375-3382. http://dx.doi.org/10.1016/j.jssc.2004.05.064 [11] A. Törncrona, M. Skoglundh, P. Thormählen, E. Fridell and E. Jobson, “Low Temperature Catalytic Activity of Cobalt Oxide and Ceria Promoted Pt and Pd: Influence of Pretreatment and Gas Composition,” Applied Catalysis B, Vol. 14, No. 1-2, 1997, pp. 131-145. http://dx.doi.org/10.1016/S0926-3373(97)00018-0 [12] Z. Jiang, W. Huang, H. Zhao, Z. Zhang, D. Tan and X. Bao, “Dispersion and Site-Blocking Effect of Molybde- num Oxide for CO Chemisorption on the Pt(1 1 0) Sub- strate,” Journal of Molecular Catalysis A, Vol. 268, No. 1-2, 2007, pp. 213-220. http://dx.doi.org/10.1016/j.molcata.2006.12.024 [13] C. Te Hsieh, W. S. Fan, W. Y. Chen and J. Y. Lin, “Ad- sorption and Visible-Light-Derived Photocatalytic Kinet- ics of Organic Dye on Co-Doped Titania Nanotubes Pre- pared by Hydrothermal Synthesis,” Separation and Puri- fication Technology, Vol. 67, No. 3, 2009, pp. 312-318. http://dx.doi.org/10.1016/j.seppur.2009.03.041 [14] W. Y. Teoh, R. Amal, L. Madler and S. E. Pratsinis, “Flame Sprayed Visible Light Active Fe-TiO2 for Pho- tomineralisation of Oxalic Acid,” Catalysis Today, Vol. 120, No. 2, 2007, pp. 203-213. http://dx.doi.org/10.1016/j.cattod.2006.07.049 [15] M. Mihaylov, K. Chakarova and K. Hadjiivanov, “For- mation of Carbonyl and Nitrosyl Complexes on Titania- and Zirconia-Supported Nickel: FTIR Spectroscopy Stu- dy,” Journal of Catalysis, Vol. 228, No. 2, 2004, pp. 273- 281. http://dx.doi.org/10.1016/j.jcat.2004.08.039 [16] I. Tankov, W. H. Cassinelli, J. M. C. Bueno, K. Arishti- rova and S. Damyanova, “DRIFTS Study of CO Adsorp- tion on Praseodymium Modified Pt/Al2O3,” Applied Sur- face Science, Vol. 259, 2012, pp. 831-839. http://dx.doi.org/10.1016/j.apsusc.2012.07.138 [17] K. Pokrovski, K. T. Jung and A. T. Bell, “Investigation of CO and CO2 Adsorption on Tetragonal and Monoclinic Zirconia,” Langmuir, Vol. 17, No. 14, 2001, pp. 4297- 4303. http://dx.doi.org/10.1021/la001723z [18] Z. M. El-Bahy, A. I. Hanafy, M. M. Ibrahim and M. Anpo, “In Situ FTIR Studies of CO Oxidation over Fe-Free and Fe-Promoted PtY Catalysts: Effect of Water Vapor Addition,” Journal of Molecular Catalysis A, Vol. 344, No. 1-2, 2011, pp. 111-121. http://dx.doi.org/10.1016/j.molcata.2011.05.008 [19] S. D. Ebbesen, B. L. Mojet and L. Lefferts, “In Situ ATR-IR Study of CO Adsorption and Oxidation over Pt/Al2O3 in Gas and Aqueous Phase: Promotion Effects by Water and pH,” Journal of Catalysis, Vol. 246, No. 1, 2007, pp. 66-73. http://dx.doi.org/10.1016/j.jcat.2006.11.019 [20] K. Kinoshita, “Carbon, Electrochemical and Physical Pro- perties,” Wiley, New York, 1988. [21] F. Bozon-Verduraz and A. Bensalem, “IR Studies of Ce- rium Dioxide: Influence of Impurities and Defects,” Journal of the Chemical Society, Faraday Transactions, Vol. 90, No. 4, 1994, pp. 653-657. http://dx.doi.org/10.1039/ft9949000653 [22] C. Shengzhou, H. Zou, Z. Liu and W. Lin, “DRIFTS Study of Different Gas Adsorption for CO Selective Oxi- dation on Cu-Zr-Ce-O Catalysts,” Applied Surface Sci- ence, Vol. 255, No. 15, 2009, pp. 6963-6967. http://dx.doi.org/10.1016/j.apsusc.2009.03.021 Copyright © 2013 SciRes. MRC  Z. M. EL-BAHY Copyright © 2013 SciRes. MRC 147 [23] D. B. Akolekar and S. K. Bhargava, “Adsorption of NO and CO on Silver-Exchanged Microporous Materials,” Journal of Molecular Catalysis A, Vol. 157, No. 1-2, 2000, pp. 199-206. http://dx.doi.org/10.1016/S1381-1169(00)00055-8 [24] Q. Yu, L. Liu, L. Dong, D. Li, B. Liu, F. Gao, K. Sun, L. Dong and Y. Chen, “Effects of Ce/Zr Ratio on the Re- ducibility, Adsorption and Catalytic Activity of CuO/ CexZr1−xO2/γ-Al2O3 Catalysts for NO Reduction by CO,” Applied Catalysis B, Vol. 96, No. 3-4, 2010, pp. 350-360. http://dx.doi.org/10.1016/j.apcatb.2010.02.032 [25] T. Nakatsuji, T. Yamaguchi, N. Sato and H. Ohno, “A Selective NOx Reduction on Rh-Based Catalysts in Lean Conditions Using CO as a Main Reductant,” Applied Ca- talysis B, Vol. 85, No. 1-2, 2008, pp. 61-70. http://dx.doi.org/10.1016/j.apcatb.2008.06.024 [26] B. Azambre, L. Zenboury, F. Delacroix and J. V. Weber, “Adsorption of NO and NO2 on Ceria-Zirconia of Com- position Ce0.69Zr0.31O2: A DRIFTS Study,” Catalysis To- day, Vol. 137, No. 2-4, 2008, pp. 278-282. http://dx.doi.org/10.1016/j.apcatb.2008.06.024 [27] C. Morterra and G. Magnacca, “A Case Study: Surface Chemistry and Surface Structure of Catalytic Aluminas, as Studied by Vibrational Spectroscopy of Adsorbed Spe- cies,” Catalysis Today, Vol. 27, No. 3-4, 1996, pp. 497- 532. http://dx.doi.org/10.1016/0920-5861(95)00163-8 [28] K. I. Hadjiivanov and G. N. Vayssilov, “Characterization of Oxide Surfaces and Zeolites by Carbon Monoxide as an IR Probe Molecule,” Advances in Catalysis, Vol. 47, 2002, pp. 307-511. http://dx.doi.org/10.1016/0920-5861(95)00163-8 [29] O. S. Alexeev, S. Krishnamoorthy, C. Jensen, M. S. Zie- barth, G. Yaluris, T. G. Roberie and M. D. Amiridis, “In Situ FTIR Characterization of the Adsorption of CO and Its Reaction with NO on Pd-Based FCC Low NOx Com- bustion Promoters,” Catalysis Today, Vol. 127, No. 1-4, 2007, pp. 189-198. http://dx.doi.org/10.1016/j.cattod.2007.05.003 [30] F. Solymosi and T. Bansagi, “Infrared Spectroscopic Study of the Isocyanate Surface Complex over Cu-ZSM-5 Catalysts,” Journal of Catalysis, Vol. 156, No. 1, 1995, pp. 75-84. http://dx.doi.org/10.1006/jcat.1995.1233 [31] R. Dumpelmann, N. W. Cant and D. L. Trimm, “Forma- tion of Isocyanic Acid during the Reaction of Mixtures of NO, CO and H2 over Supported Platinum Catalysts,” Ap- plied Catalysis B, Vol. 6, No. 4, 1995, pp. L291-L296. http://dx.doi.org/10.1016/0926-3373(95)00024-0 [32] A. M. Sica and C. E. Giola, “Interaction of CO, NO and NO/CO over Pd/γ-Al2O3 and Pd-WOx/γ-Al2O3 Catalysts,” Applied Catalysis A, Vol. 239, No. 1-2, 2003, pp. 121- 139. http://dx.doi.org/10.1016/S0926-860X(02)00380-0 [33] R. Di Monte, J. Kaspar, P. Fornasiero, M. Graziani, C. Pazéand and G. Gubitosa, “NO Reduction by CO over Pd/Ce0.6Zr0.4O2/Al2O3 Catalysts: In Situ FT-IR Studies of NO and CO Adsorption,” Inorganica Chimica Acta, Vol. 334, 2002, pp. 318-326. http://dx.doi.org/10.1016/S0020-1693(02)00800-9 [34] H. Arai and H. Tominaga, “An Infrared Study of Nitric Oxide Adsorbed on Rhodium-Alumina Catalyst,” Journal of Catalysis, Vol. 43, No. 1-3, 1976, pp. 131-142. http://dx.doi.org/10.1016/0021-9517(76)90300-6 [35] L. Liu, B. Liu, L. Dong, J. Zhu, H. Wan, K. Sun, B. Zhao, H. Zhu, L. Dong and Y. Chen, “In Situ FT-Infrared In- vestigation of CO or/and NO Interaction with CuO/ Ce0.67Zr0.33O2 Catalysts,” Applied Catalysis B, Vol. 90, No. 3-4, 2009, pp. 578-586. http://dx.doi.org/10.1016/j.apcatb.2009.04.019 [36] K. Chakarova, M. Mihaylov and K. Hadjiivaniov, “FTIR Spectroscopic Study of CO Adsorption on Pt-H-ZSM-5,” Microporous and Mesoporous Materials, Vol. 81, No. 1-3, 2005, pp. 305-312. http://dx.doi.org/10.1016/j.micromeso.2005.01.033 [37] K. Chakarova, M. Mihaylov and K. Hadjiivaniov, “Poly- carbonyl Species in Pt/H-ZSM-5: FTIR Spectroscopic Study of 12CO-13CO Co-Adsorption,” Catalysis Commu- nications, Vol. 6, No. 7, 2005, pp. 466-471. http://dx.doi.org/10.1016/j.catcom.2005.04.007 [38] K. Chakarova, K. Hadjiivanov, G. Atanasova and K. Tenchev, “Effect of Preparation Technique on the Proper- ties of Platinum in NaY Zeolite: A Study by FTIR Spec- troscopy of Adsorbed CO,” Journal of Molecular Cataly- sis A, Vol. 264, No. 1-2, 2007, pp. 270-279. http://dx.doi.org/10.1016/j.molcata.2006.09.040 [39] S. H. Oh and C. C. Eickel, “Influence of Metal Particle Size and Support on the Catalytic Properties of Supported Rhodium: CO+O2 and CO+NO Reactions,” Journal of Catalysis, Vol. 128, No. 2, 1991, pp. 526-536. http://dx.doi.org/10.1016/0021-9517(91)90310-Z [40] S. H. Oh, “Effects of Cerium Addition on the CO+NO Reaction Kinetics over Alumina-Supported Rhodium Catalysts,” Journal of Catalysis, Vol. 124, No. 2, 1990, pp. 477-487. http://dx.doi.org/10.1016/0021-9517(90)90194-O [41] M. Paulis, H. Peyrard and M. Montes, “Influence of Chlorine on the Activity and Stability of Pt/Al2O3 Cata- lysts in the Complete Oxidation of Toluene,” Journal of Catalysis, Vol. 199, No. 1, 2001, pp. 30-40. http://dx.doi.org/10.1006/jcat.2000.3146 [42] T. M. Salama, Z. M. El-Bahy and F. I. Zidan, “Aqueous H2O2 as an Oxidant for CO over Pt- and Au-NaY Cata- lysts,” Journal of Molecular Catalysis A, Vol. 264, No. 1-2, 2007, pp. 128-134. http://dx.doi.org/10.1016/j.molcata.2006.08.003 [43] A. Parinyaswan, S. Pongstabodee and A. Luengnarue- mitchai, “Catalytic Performances of Pt-Pd/CeO2 Catalysts for Selective CO Oxidation,” International Journal of Hydrogen Energy, Vol. 31, No. 13, 2006, pp. 1942-1949. http://dx.doi.org/10.1016/j.ijhydene.2006.05.002 [44] S. D. Ebbesen, B. L. Mojet and L. Lefferts, “In situ ATR-IR Study of CO Adsorption and Oxidation over Pt/Al2O3 in Gas and Aqueous Phase: Promotion Effects by Water and pH,” Journal of Catalysis, Vol. 246, No. 1, 2007, pp. 66-73. http://dx.doi.org/10.1016/j.jcat.2006.11.019
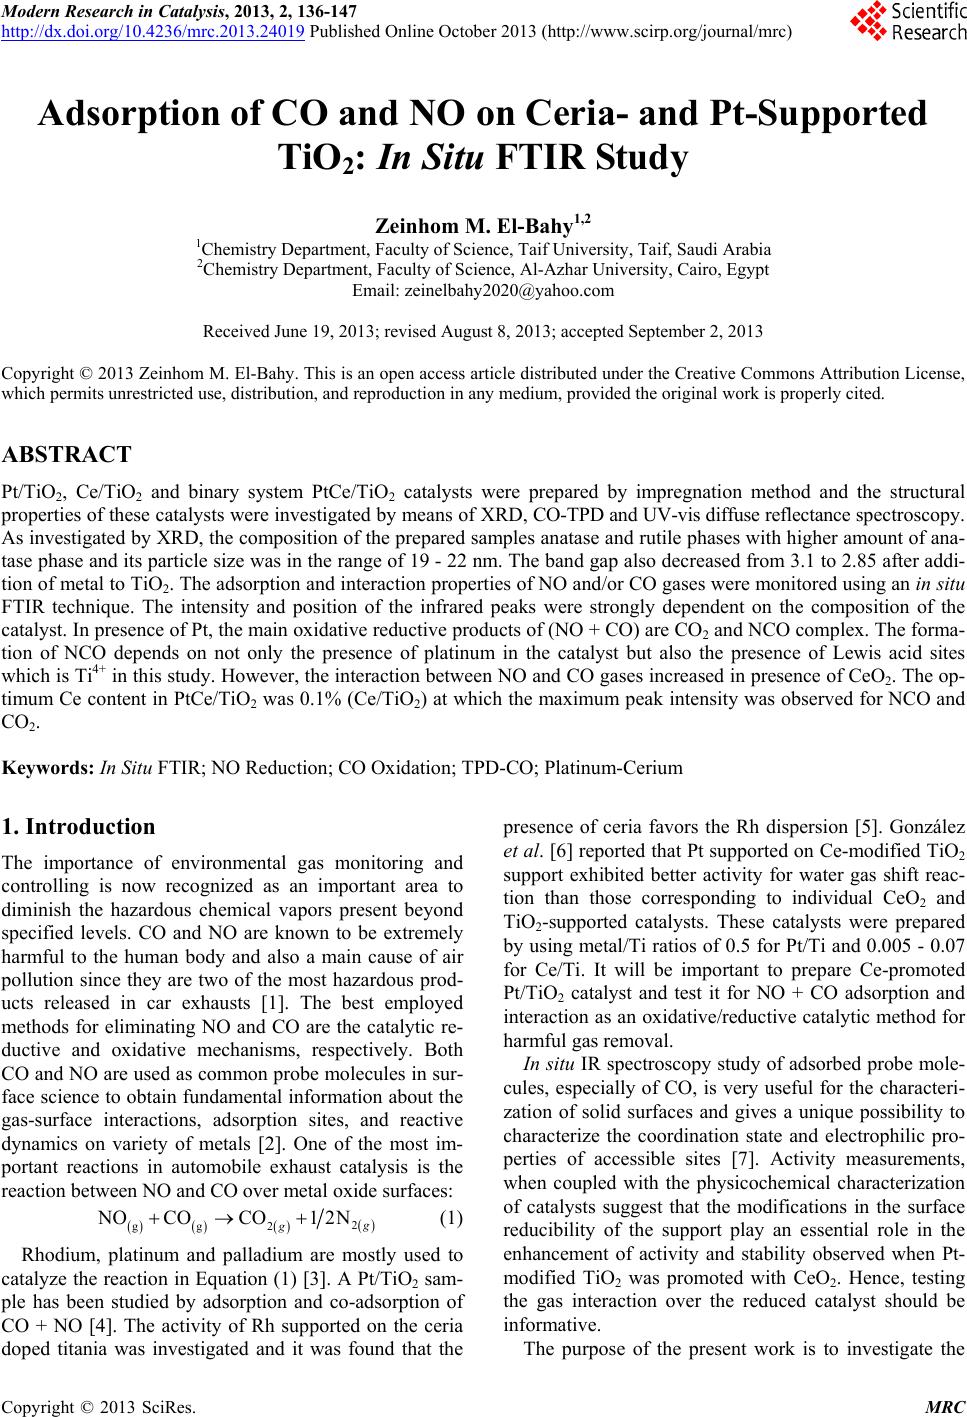
|