Paper Menu >>
Journal Menu >>
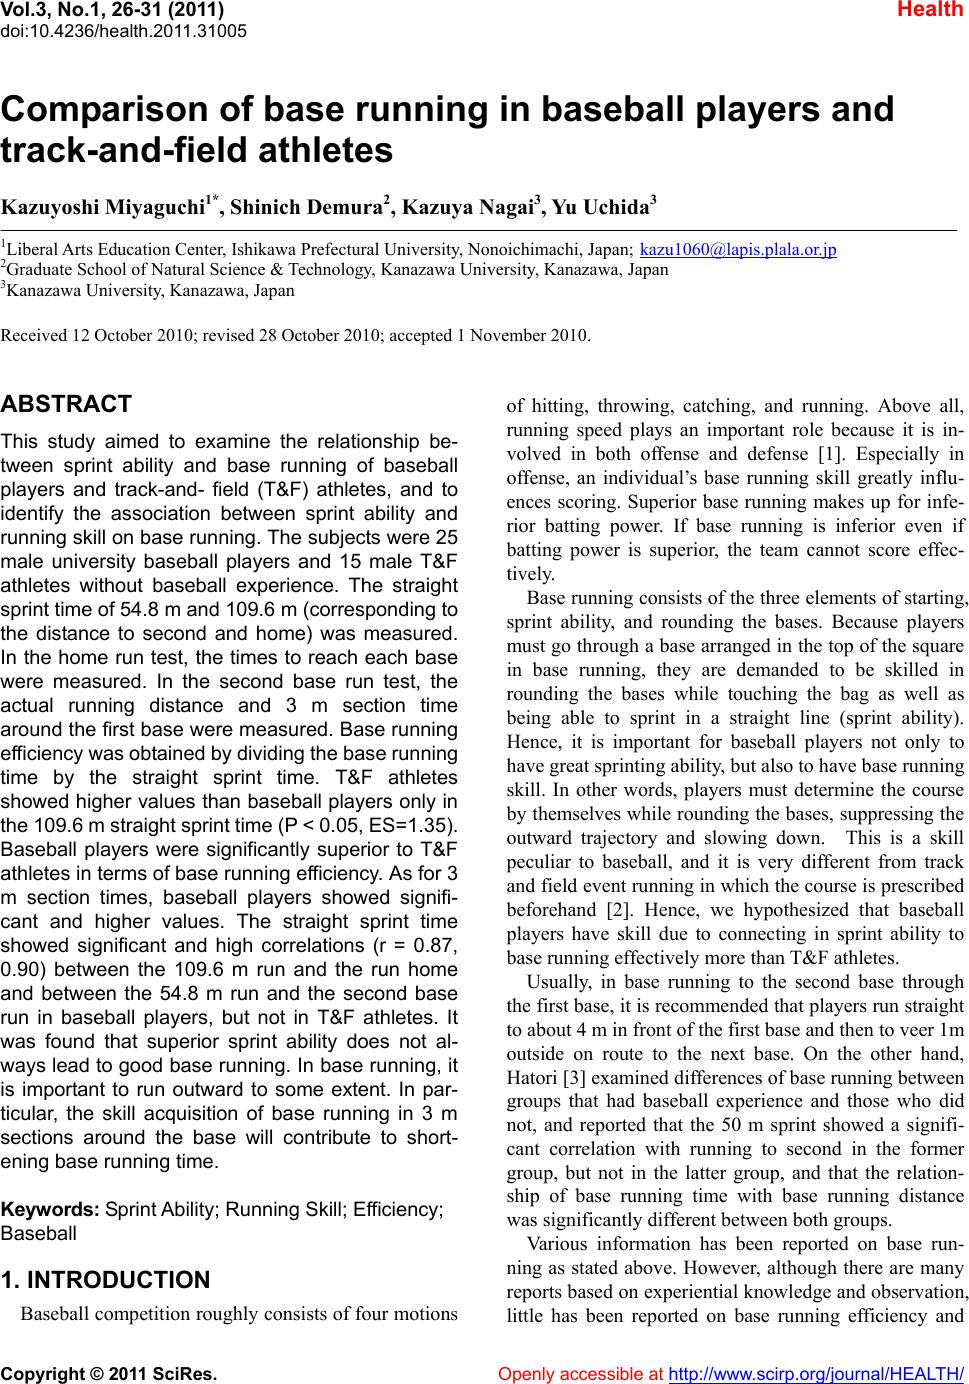 Vol.3, No.1, 26-31 (2011) Health doi:10.4236/health.2011.31005 Copyright © 2011 SciRes. Openly accessible at http://www.scirp.org/journal/HEALTH/ Comparison of base running in baseball players and track-and-field athletes Kazuyoshi Miyaguchi1*, Shinich Demura2, Kazuya Nagai3, Yu Uchida3 1Liberal Arts Education Center, Ishikawa Prefectural University, Nonoichimachi, Japan; kazu1060@lapis.plala.or.jp 2Graduate School of Natural Science & Technology, Kanazawa University, Kanazawa, Japan 3Kanazawa University, Kanazawa, Japan Received 12 October 2010; revised 28 October 2010; accepted 1 November 2010. ABSTRACT This study aimed to examine the relationship be- tween sprint ability and base running of baseball players and track-and- field (T&F) athletes, and to identify the association between sprint ability and running skill on base running. The subjects were 25 male university baseball players and 15 male T&F athletes without baseball experience. The straight sprint time of 54.8 m and 1 09.6 m (co rre spo nding to the distance to second and home) was measured. In the home run test, the times to reach each base were measured. In the second base run test, the actual running distance and 3 m section time around the first base were measured. Base running efficien cy was obtained by dividing the base runnin g time by the straight sprint time. T&F athletes showed h igher values than baseba ll players only in the 109.6 m straight sprint time (P < 0.05, ES=1.35). Baseball players were significantly superior to T&F athletes in terms of base running efficiency. As for 3 m section times, baseball players showed signifi- cant and higher values. The straight sprint time showed significant and high correlations (r = 0.87, 0.90) between the 109.6 m run and the run home and between the 54.8 m run and the second base run in baseball players, but not in T&F athletes. It was found that superior sprint ability does not al- ways lead to good base running. In base running, it is important to run outward to some extent. In par- ticular, the skill acquisition of base running in 3 m sections around the base will contribute to short- ening base running time. Keywords: Sprint Ability; Running Skill; Efficiency; Baseball 1. INTRODUCTION Baseball competition roughly con sists of four motions of hitting, throwing, catching, and running. Above all, running speed plays an important role because it is in- volved in both offense and defense [1]. Especially in offense, an individual’s base running skill greatly influ- ences scoring. Superior base running makes up for infe- rior batting power. If base running is inferior even if batting power is superior, the team cannot score effec- tively. Base running consists of the three elements of starting, sprint ability, and rounding the bases. Because players must go through a base arranged in the top of the square in base running, they are demanded to be skilled in rounding the bases while touching the bag as well as being able to sprint in a straight line (sprint ability). Hence, it is important for baseball players not only to have great sprinting ability, but also to have base running skill. In other words, players must determine the course by themselves while rounding the bases, suppressing the outward trajectory and slowing down. This is a skill peculiar to baseball, and it is very different from track and field even t running in which the course is prescribed beforehand [2]. Hence, we hypothesized that baseball players have skill due to connecting in sprint ability to base running effectively more than T&F athletes. Usually, in base running to the second base through the first base, it is recommended that players run straight to about 4 m in front of the first base and then to veer 1m outside on route to the next base. On the other hand, Hatori [3] examined differences of base running between groups that had baseball experience and those who did not, and reported that the 50 m sprint showed a signifi- cant correlation with running to second in the former group, but not in the latter group, and that the relation- ship of base running time with base running distance was significantly different between both groups. Various information has been reported on base run- ning as stated above. However, although there are many reports based on experiential know ledge and observa tion, little has been reported on base running efficiency and 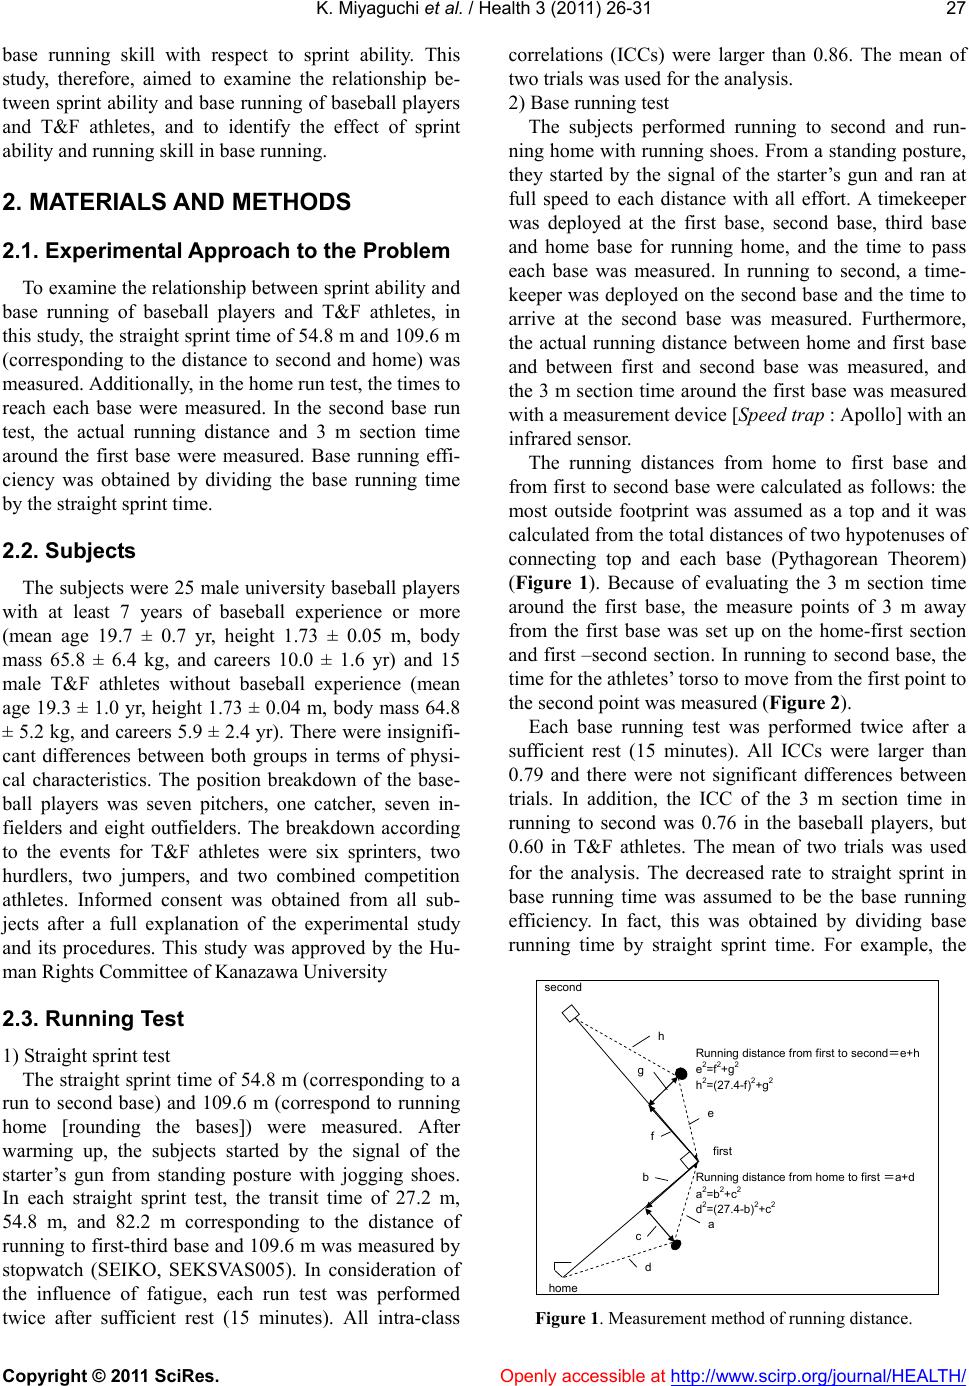 K. Miyaguchi et al. / Health 3 (2011) 26-31 Copyright © 2011 SciRes. Openly accessible at http://www.scirp.org/journal/HEALTH/ 27 base running skill with respect to sprint ability. This study, therefore, aimed to examine the relationship be- tween sprint ability and base running of baseball players and T&F athletes, and to identify the effect of sprint ability and running sk ill in base running. 2. MATERIALS AND METHODS 2.1. Experimental Approach to the Problem To examine the relationsh ip between sprint ability and base running of baseball players and T&F athletes, in this study, the straight sprint time of 54.8 m and 109.6 m (corresponding to the distance to second and home) was measured. Additionally, in the home run test, the times to reach each base were measured. In the second base run test, the actual running distance and 3 m section time around the first base were measured. Base running effi- ciency was obtained by dividing the base running time by the straight spri nt time. 2.2. Subjects The subjects were 25 male university baseball players with at least 7 years of baseball experience or more (mean age 19.7 ± 0.7 yr, height 1.73 ± 0.05 m, body mass 65.8 ± 6.4 kg, and careers 10.0 ± 1.6 yr) and 15 male T&F athletes without baseball experience (mean age 19.3 ± 1.0 yr, height 1.73 ± 0.04 m, body mass 64.8 ± 5.2 kg, and careers 5.9 ± 2.4 yr). There were insignifi- cant differences between both groups in terms of physi- cal characteristics. The position breakdown of the base- ball players was seven pitchers, one catcher, seven in- fielders and eight outfielders. The breakdown according to the events for T&F athletes were six sprinters, two hurdlers, two jumpers, and two combined competition athletes. Informed consent was obtained from all sub- jects after a full explanation of the experimental study and its procedures. This study was approved by the Hu- man Rights Committee of Kanazawa University 2.3. Running Test 1) Straight sprint test The straight sprint time of 54.8 m (corresponding to a run to second base) and 109.6 m (correspond to running home [rounding the bases]) were measured. After warming up, the subjects started by the signal of the starter’s gun from standing posture with jogging shoes. In each straight sprint test, the transit time of 27.2 m, 54.8 m, and 82.2 m corresponding to the distance of running to first-third base and 109.6 m was measured by stopwatch (SEIKO, SEKSVAS005). In consideration of the influence of fatigue, each run test was performed twice after sufficient rest (15 minutes). All intra-class correlations (ICCs) were larger than 0.86. The mean of two trials was used for the analysis. 2) Base running test The subjects performed running to second and run- ning home with running shoes. From a standing posture, they started by the signal of the starter’s gun and ran at full speed to each distance with all effort. A timekeeper was deployed at the first base, second base, third base and home base for running home, and the time to pass each base was measured. In running to second, a time- keeper was deployed on the second base and the time to arrive at the second base was measured. Furthermore, the actual running distance between home and first base and between first and second base was measured, and the 3 m section time around the first base was measured with a measurement device [Speed trap : Apollo] with an infrared sensor. The running distances from home to first base and from first to second base were calculated as follows: the most outside footprint was assumed as a top and it was calculated from the total distances of two hypotenuses of connecting top and each base (Pythagorean Theorem) (Figure 1). Because of evaluating the 3 m section time around the first base, the measure points of 3 m away from the first base was set up on the home-first section and first –second section. In running to second base, the time for the athletes’ torso to move from the first point to the second point was measured (Figure 2). Each base running test was performed twice after a sufficient rest (15 minutes). All ICCs were larger than 0.79 and there were not significant differences between trials. In addition, the ICC of the 3 m section time in running to second was 0.76 in the baseball players, but 0.60 in T&F athletes. The mean of two trials was used for the analysis. The decreased rate to straight sprint in base running time was assumed to be the base running efficiency. In fact, this was obtained by dividing base running time by straight sprint time. For example, the second e 2 =f 2 + g 2 first a 2 =b 2 +c 2 home d 2 =(27.4-b) 2 +c 2 h 2 =(27.4-f) 2 +g 2 Running distance from first to second=e+h Running distance from home to first =a+d a b c d e g f h Figure 1. Measurement method of running distance. 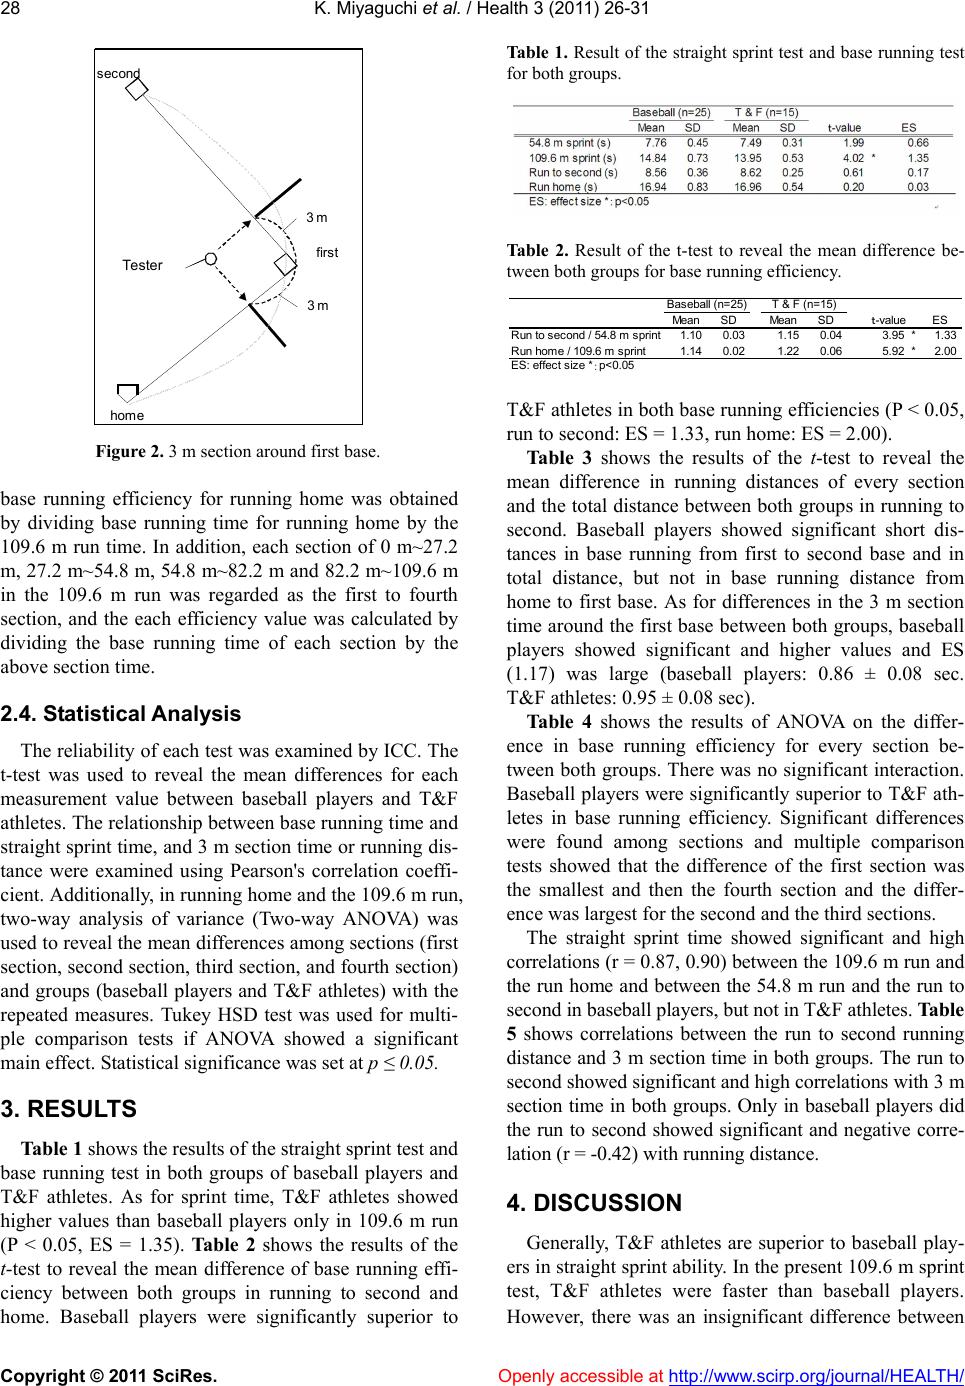 K. Miyaguchi et al. / Health 3 (2011) 26-31 Copyright © 2011 SciRes. Openly accessible at http://www.scirp.org/journal/HEALTH/ 28 second first home 3 m 3 m Tester Figure 2. 3 m section around first base. base running efficiency for running home was obtained by dividing base running time for running home by the 109.6 m run time. In addition, each section of 0 m~27.2 m, 27.2 m~54.8 m, 54.8 m~82.2 m and 82.2 m~109.6 m in the 109.6 m run was regarded as the first to fourth section, and the each efficiency value was calculated by dividing the base running time of each section by the above section time. 2.4. Statistical Analysis The reliability of each test was examined by ICC. The t-test was used to reveal the mean differences for each measurement value between baseball players and T&F athletes. The relationship between base running time and straight sprint time, and 3 m section time or running dis- tance were examined using Pearson's correlation coeffi- cient. Additionally, in running home and the 109.6 m run, two-way analysis of variance (Two-way ANOVA) was used to reveal the mean differences among sections (first section, second section, third section , and fourth section) and groups (baseball players and T&F athletes) with the repeated measures. Tukey HSD test was used for multi- ple comparison tests if ANOVA showed a significant main effect. Statistical significance was set at p ≤ 0.05. 3. RESULTS Table 1 shows the resu lts of the straight sprint test and base running test in both groups of baseball players and T&F athletes. As for sprint time, T&F athletes showed higher values than baseball players only in 109.6 m run (P < 0.05, ES = 1.35). Tab l e 2 shows the results of the t-test to reveal the mean difference of base running effi- ciency between both groups in running to second and home. Baseball players were significantly superior to Table 1. Result of the straight sprint test and base running test for both groups. Ta b le 2. Result of the t-test to reveal the mean difference be- tween both groups for base running efficiency. Mean SDMean SDES Run to second / 54.8 m sprint1.100.031.150.043.95*1.33 Run home / 109.6 m sprint1.140.021.220.065.92*2.00 t-value ES: effect size *:p<0. 05 Baseball (n=25)T & F (n=15) T&F athletes in both base running efficiencies (P < 0.05, run to second: ES = 1.33, run home: ES = 2.00). Table 3 shows the results of the t-test to reveal the mean difference in running distances of every section and the total distance between bo th groups in running to second. Baseball players showed significant short dis- tances in base running from first to second base and in total distance, but not in base running distance from home to first base. As for differences in the 3 m section time around the first base between both groups, baseball players showed significant and higher values and ES (1.17) was large (baseball players: 0.86 ± 0.08 sec. T&F athletes: 0.95 ± 0.08 sec). Table 4 shows the results of ANOVA on the differ- ence in base running efficiency for every section be- tween both groups. There was no significant interaction. Baseball players were significantly superior to T&F ath- letes in base running efficiency. Significant differences were found among sections and multiple comparison tests showed that the difference of the first section was the smallest and then the fourth section and the differ- ence was largest for the second and the third sections. The straight sprint time showed significant and high correlations (r = 0.87, 0.90) between th e 109.6 m run and the run home and between the 54.8 m run and the run to second in baseball players, bu t not i n T&F athl et es. Table 5 shows correlations between the run to second running distance and 3 m section time in both groups. The run to second showed significant and high correlations with 3 m section time in both groups. Only in baseball players did the run to second showed significant and negative corre- lation (r = -0.4 2) wi t h ru nni n g di st ance. 4. DISCUSSION Generally, T&F athletes are superior to baseball play- ers in straight sprint ability. In the presen t 109.6 m sprint test, T&F athletes were faster than baseball players. However, there was an insignificant difference between 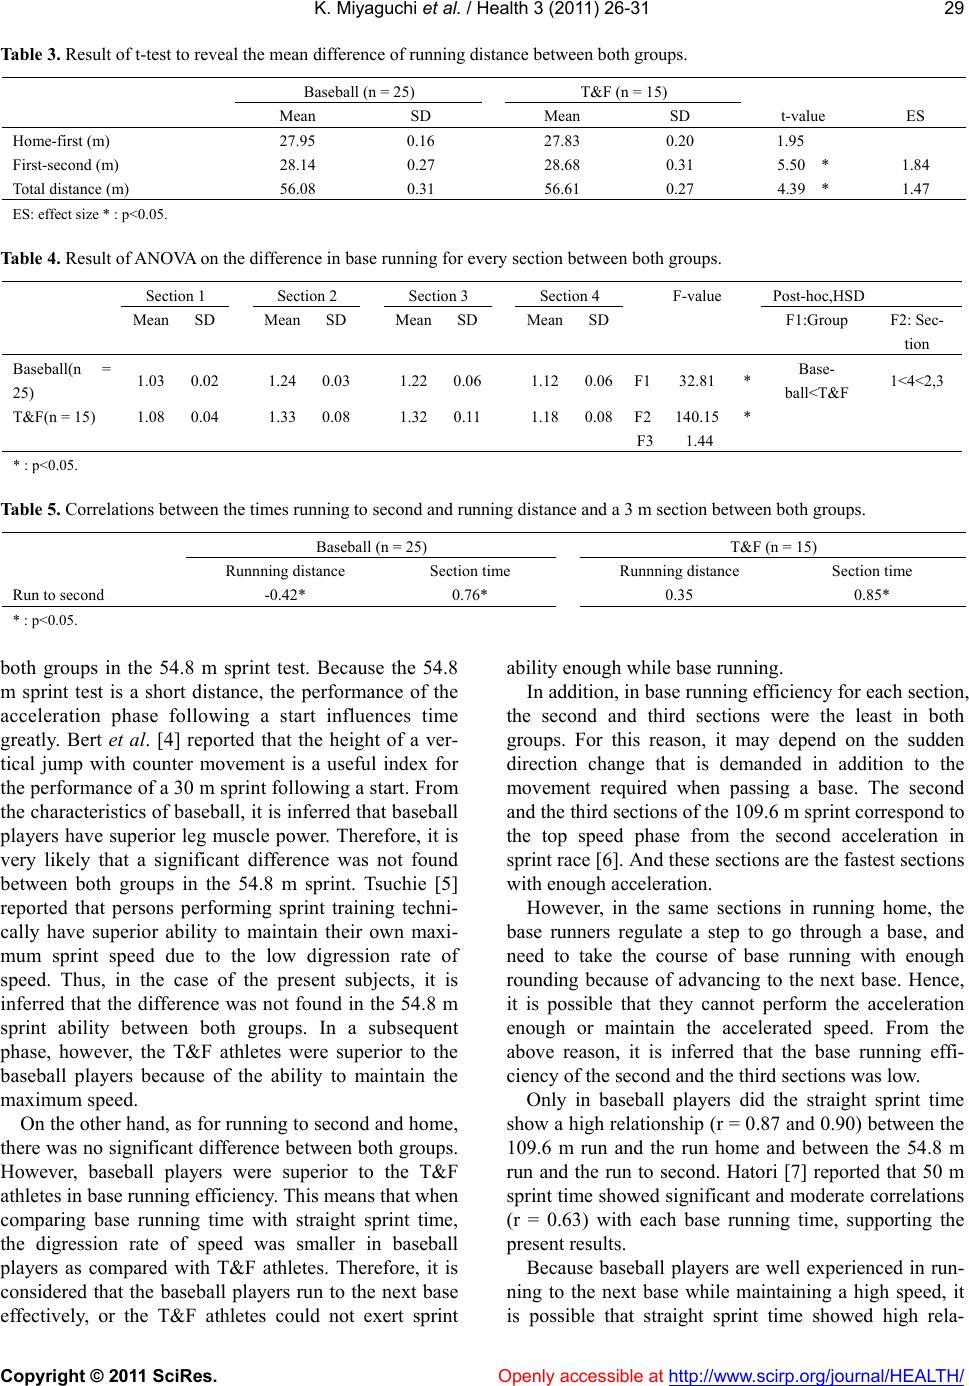 K. Miyaguchi et al. / Health 3 (2011) 26-31 Copyright © 2011 SciRes. Openly accessible at http://www.scirp.org/journal/HEALTH/ 29 Table 3. Result of t-test to reveal the mean difference of running distance between both groups. Baseball (n = 25) T&F (n = 15) Mean SD Mean SD t-value ES Home-first (m) 27.95 0.16 27.83 0.20 1.95 First-second (m) 28.14 0.27 28.68 0.31 5.50 * 1.84 Total distance (m) 56.08 0.31 56.61 0.27 4.39 * 1.47 ES: eff ect size * : p<0.05. Table 4. Result of ANOVA on the difference in base running for every section between both groups. Section 1 Section 2 Section 3 Section 4 F-value Post-hoc,HSD Mean SD Mean SD MeanSDMeanSD F1:Group F2: Sec- tion Baseball(n = 25) 1.03 0.02 1.24 0.03 1.220.061.120.06 F132.81 * Base- ball<T&F 1<4<2,3 T&F(n = 15) 1.08 0.04 1.33 0.08 1.320.111.180.08F2140.15* F3 1.44 * : p<0.05. Table 5. Correlations between the times running to second and running distance and a 3 m section between both groups. Baseball (n = 25) T&F (n = 15) Runnning distan ce Section t ime Runnning distance Section time Run to second -0.42* 0.76* 0.35 0.85* * : p<0.05. both groups in the 54.8 m sprint test. Because the 54.8 m sprint test is a short distance, the performance of the acceleration phase following a start influences time greatly. Bert et al. [4] reported that the height of a ver- tical jump with counter movement is a useful index for the performance of a 30 m sprint following a start. From the characteristics of baseball, it is inferred that baseball players have superior leg muscle power. Therefore, it is very likely that a significant difference was not found between both groups in the 54.8 m sprint. Tsuchie [5] reported that persons performing sprint training techni- cally have superior ability to maintain their own maxi- mum sprint speed due to the low digression rate of speed. Thus, in the case of the present subjects, it is inferred that the difference was not found in the 54.8 m sprint ability between both groups. In a subsequent phase, however, the T&F athletes were superior to the baseball players because of the ability to maintain the maximu m spee d . On the other hand, as for running to second and ho me, there was no significant difference between both groups. However, baseball players were superior to the T&F athletes in base running efficiency. This means that when comparing base running time with straight sprint time, the digression rate of speed was smaller in baseball players as compared with T&F athletes. Therefore, it is considered that the baseball players run to the next base effectively, or the T&F athletes could not exert sprint ability enough while base running. In addition, in base running efficiency for each section, the second and third sections were the least in both groups. For this reason, it may depend on the sudden direction change that is demanded in addition to the movement required when passing a base. The second and the third sections of the 109.6 m sprint correspond to the top speed phase from the second acceleration in sprint race [6]. And these sections are the fastest sections with enough acceleration. However, in the same sections in running home, the base runners regulate a step to go through a base, and need to take the course of base running with enough rounding because of advancing to the next base. Hence, it is possible that they cannot perform the acceleration enough or maintain the accelerated speed. From the above reason, it is inferred that the base running effi- ciency of the second and the third sections was low. Only in baseball players did the straight sprint time show a high relationship (r = 0.87 and 0.90) between the 109.6 m run and the run home and between the 54.8 m run and the run to second. Hatori [7] reported that 50 m sprint time showed significant and moderate correlations (r = 0.63) with each base running time, supporting the present results. Because baseball players are well experienced in run- ning to the next base while maintaining a high speed, it is possible that straight sprint time showed high rela-  K. Miyaguchi et al. / Health 3 (2011) 26-31 Copyright © 2011 SciRes. Openly accessible at http://www.scirp.org/journal/HEALTH/ 30 tionship with base running time. On the other hand, al- though T&F athletes have superior straight sprint ability as compared with baseball players, it is inferred that be- cause they cannot efficiently exert this sprint ability in base running, the relationship between straight sprint time and base running time was low. In this study, characteristics of base running method were examined by measuring the running distance of running to second and the 3 m section time around the first base. The run to second showed a high relationship with the 3 m section time in both groups. This suggests that the runner's skill is closely related with base runn ing time regardless of expertise, or that the person is an in- experienced baseball player when going through a base. As for the 3 m section time, the baseball players were superior to the T&F athletes (ES = 1.15). This suggests that they can run to the next base while maintain ing their speed because of having skillful base running technique from experience. In contrast, the T&F athletes cannot exert their own sprint ability enough because of insuffi- cient base running skill. Greg [8] stated that the followin g is impor tant fo r b ase running: 1) When approaching the base, one must lean one’s body to the inside of the field, using the inside and outside edges of their feet. 2) One must maintain accel- eration and stride length, and not to increase the number of steps near the base. 3) One must kick the ground with the ball of the foot and to go through the base with swinging arms to maintain speed and power. Also Mi- zuno [9] stated that the first base provides a role such as the start block of track-and-field. It is likely that 3 m section time of baseball players was fast because they have learned the above base running technique. In the conventional baseball playbook, going through a base with the left foot has been recommended, but recently there have been few reports proposing going through a base with the right foot. Actually, many baseball players in this study went through a base with the right foot. From now, examining more effective base running me- thod will be necessary. As for the distance to second, baseball players had a shorter distance than T&F athletes in base running dis- tance from first to second base, but not in base running distance from home to first base. From this, it is inferred that the T&F athletes rounded out greatly after having gone through first base. On the other hand, the run to second in baseball players showed a negative correlation with running distance. This may mean that if the base running time is short, the runnin g distance is long. Hatori [3] reported that the relationship between run- ning distance and base running time was positive in those who are inexperienced at baseball, but negative in players with experience. The present findings supported the above. It was suggested that running the shortest distance is not always ideal for base running, and run- ning the cour se with ro unding to some extent co ntributes to shortening total distance and time as a result. By comparing T&F athletes and baseball players, it was found that superior sprint ability does not always lead to good base running. It is inferred that the T&F athletes cannot exert sprint ability with poorly-trained base running skills whereas baseball players go through a base smoothly and can maintain maximum speed. In base running, it is important to run with rounding to some extent. In particular, the skill acquisition of base running in 3 m sections around the bases will lead to shortening the base running time. Professional baseball is a sport in which running speed plays an important role. Because running speed is the only common denominator of both offense and de- fense, Professional Major League Baseball (MLB) scouting agents emphasize a running speed when evalu- ating talent [10]. However, the faster players do not al- ways participate at the major-league level (highest level in professional baseball). Data collected on 210 profes- sional players in the 30- and 60- yd dash showed that the fastest players were at the AA level (second to lowest level in professional baseball)[11]. The above means that the players who can use their own running speed in both offense and defense can play a more active part in the upper levels. Therefore, as for base running, players must train to raise running speed. And it will be neces- sary for coaches to measure the times of straight line runs and base runs regularly, and give feedback to the players about this information to confirm base running efficiency. REFERENCES [1] Coleman, A.E. (2007) Running Speed in Professional Baseball. Strength & Conditioning Journal, 29, 72-76. [2] Young, W. and Farrow, D. (2006) A Review of Agility: Practical Applications for Strength and Conditioning. Strength & Conditioning Journal, 28, 24-29. doi:10.1519/1533-4295(2006)28[24:AROAPA]2.0.CO;2 [3] Hatori, Y. (1978) A study on base-running of baseball (2): On base-running between home base and second base in novice and advanced subjects. Bulletin of Tokyo Gakugei University Series, 30, 245-251. [4] Bert, C., Rahmani, A., Dufour, A.B., Messonnier, L. and Jacour, J.R. (2002) Leg strength and stiffness as ability factors in 100 m sprint running. The Journal of Sports Medicine and Physical Fitness, 42, 274-281. [5] Tsuchie, H. (2007) Physical and technical factors effect to each phase of sprint running. Research Quarterly for Athletics, 75, 2-11. [6] Delecluse, C. H., Van Coppenolle, H., Willems, E., Van Leemputte, M., Diels, R. and Goris, M. (1995) Influence of high resistance and high velocity training on sprint performance. Medicine and Science in Sports and Exer- cise, 27, 1203-1209.  K. Miyaguchi et al. / Health 3 (2011) 26-31 Copyright © 2011 SciRes. Openly accessible at http://www.scirp.org/journal/HEALTH/ 31 doi:10.1249/00005768-199508000-00015 [7] Hatori, Y. (1977) A study on base-running of baseball: On base-running between home base and second base in trained subject. Bulletin of Tokyo Gakugei University Se- ries, 29, 173-178. [8] Greg, F. (2007) Improving Your Base Running Speed. NSCA’s Performance Training Journal, 6, 10-13. [9] Mizuno, M. (2009) The run in the baseball. Training Journal, 31, 19-24. [10] Coleman, G. (2000) 52-Week Baseball Training. Human Kinetics, Champaign. [11] Coleman, A.E. and Laskey, L.M. (1992) Assessing run- ning speed and body composition in professional base- ball players. Journal of Applied Sports Science Research, 6, 207-213. |