E. J. FULLER, J. M. DESHLER
Copyright © 2013 SciRes.
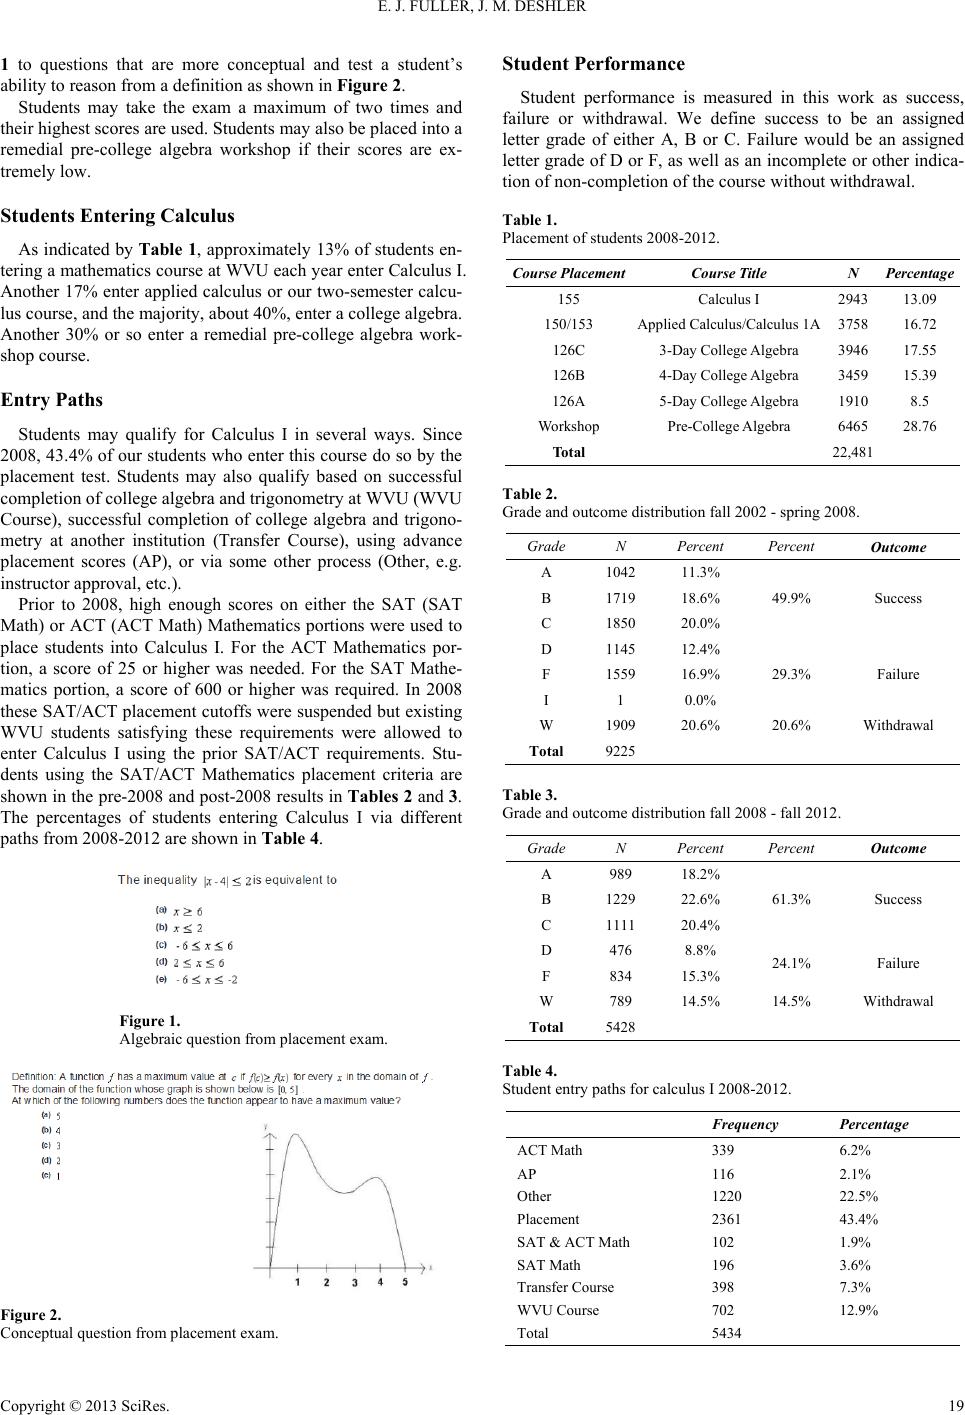
Table 8.
SAT and ACT math score averages by grade in calculus I.
Grades All Students Entry Path
Entry From College Algebra Calculus I Direct Placement
ACT Mathematics Averages
A
N = 510
σ = 3.535
N = 54
σ = 2.430
N = 290
σ = 3.057
A, B or C
N = 1568
σ = 3.803
N = 329
σ = 2.776
N = 771
σ = 2.921
SAT Mathematics Averages
A
N = 432
σ = 63.286
N = 38
σ = 41.883
N = 242
σ = 57.96
A, B or C
N = 1534
N = 312
N = 785
We see that much higher average scores are observed in both
cases for successful students than the previous cutoffs that were
used prior to 2008.
Conclusion
We antic ipat e the current placement process to provide better
placement for all students placing into a WVU undergraduate
mathematics courses, and believe the data indicates somewhat
conclusively that this is the case for our mainstream Calculus I
course. However, appropriate placement is only one part of a
more complete approach to ensuring student success that in-
cludes implementing best teaching practices, appropriate as-
sessment and feedback techniques and teaching for under-
standing. In particular, assessment of student performance in
prerequisite courses such as college algebra and the subsequent
performance of these students in calculus, as well as the per-
formance of student in successor courses such as Calculus II,
Calculus III and other upper division courses are also essential
elements of a properly functioning placement process. We be-
lieve the change in placement at our institution is the first step
to encourage as many of our 29,000 students as possible to
succeed in mathematics and persist in the study of mathematics
and science. Further work will be described in subsequent pub-
lications relating to student performance in precursor and suc-
cessor courses, as well as more refined analyses of student per-
formance for demographic subsets.
SAT and ACT Ma th Scores of Successful Students
Given the success rates observed for prior SAT and ACT
math cutoffs, it is reasonable then to ask what scores do corre-
late with success in calculus for these tests. Table 8 shows the
average ACT mathematics score and average SAT mathematics
score for students who in the first row obtained an A in the
Calculus I. In the second row, the average scores for students
obtaining an A, B or C are shown. We further break these down
by entry via placement or using credit for college algebra as a
previous course.
In this data we see that the average score of successful stu-
dents overall is 1.47 points higher than the original ACT cutoff
and almost exactly the same for the SAT cutoff. After subset-
ting by entry path, we see, however, that students entering via
prior coursework skew this average downwards, and that stu-
dents entering via placement show ACT math averages a full
3.62 points higher and SAT math averages 34.67 points higher.
Both of these are close to a standard deviation above the prior
cutoffs, suggesting that these earlier placement criteria were too
low for students without prior coursework, and that the new
placement process is more effective. Further work needs to be
done to see if alternative cutoffs for SAT and ACT scores could
be used.
REFERENCES
Baron, J., & Norman, F. (1992). SATs, achievement test, and high-
school class rank as predictors of college performance. Educational
and Psychological Measurement, 52, 1047-1055.
Bridgeman, B. (1982). Comparative validity of the college board scho-
lastic aptitude test—Mathe matics and the descriptive t ests of mathe-
matics skills for predicting performance in college mathematics
courses. Educat ional and Psychological Measurement, 42, 361-366.
Dalton, S. (1976). A decline in the predictive validity of the SAT and
high school achievement. Educational and Psychological Measure-
ment, 36, 445-448.
Fuller, E., Deshler, J., Kuhn, B., & Squire, D. (2013). Tracking success
of pre-college algebra workshop students through subsequent college
mathematics classes. Primus, in press.
Kohler, E. (19 73). The relation ship between the coop erative mathemat-
ics test, Algebra III, ACT mathematics usage test, ACT composite
and grade point average in college Algebra. Educational and Psy-
chological Measurement, 33, 929-931.
Lesik, S. (2007). Do developmental mathematics programs have a cau-
sal impact on student retention? An application of discrete-ti me sur -
vival and regression-disco ntinuity analysis. Research in Higher Edu-
cation, 48.
Mathematical Association of America (2010). Placement test program
user’s guide (7th ed.). Washington DC: MAA.
Parker, M. (2005). Placement, retention, and success: A longitudinal
study of mathematics and retention. The Journal of General Educa-
tion, 54.1, 22-40.
Pedersen, G. L. (2004). Academic performance and demographic va-
riables in predicting success in college algebra and graduation rates
in an urban multi-campus community college (Florida). Ed.D. dis-
sertation, Florida Atlantic University.
Rothstein, J. M. (2 004). College performance pred ictions and the SAT.
Journal of Econometrics, 121, 297-317.
Rubino, N. D. (1998). An analysis of pre-admission test scores and
their relationship to su ccessful o utcomes for stu dents in the as sociate
degree nursing program at Wesley College. Ed.D. dissertation, Wil-
mington Coll ege.