Psychology
2013. Vol.4, No.9A1, 12-16
Published Online September 2013 in SciRes (http://www.scirp.org/journal/psych) http://dx.doi.org/10.4236/psych.2013.49A1003
Copyright © 2013 SciRes.
12
Comparing the Sensitivity of the MMPI-2 Clinical Scales and the
MMPI-RC Scales to Clients Rated as Psychotic, Borderline or
Neurotic on the Psychodiagnostic Chart
Robert M. Gordon1, Ronald W. Stoffey2, Bethany L. Perkins3
1Independent Practice, Allentown, USA
2Psychology Department, Kutztown University, Kutztown, USA
3Department of Education and Human Services, Lehigh University, Bethlehem, USA
Email: rmgordonphd@gmail.com
Received July 14th, 2013; revised August 15th, 2013; accepted September 19th, 2013
Copyright © 2013 Robert M. Gordon et al. This is an open access article distributed under the Creative Com-
mons Attribution License, which permits unrestricted use, distribution, and reproduction in any medium, pro-
vided the original work is properly cited.
The purpose of this study was to assess the differences between the MMPI-2 and the MMPI-RC scales in
sensitivity to levels of psychopathology. Ninety-eight clients from forensic, disability and psychotherapy
evaluations were evaluated on the MMPI-2 and RC scales and rated for personality organization (neurotic,
borderline or psychotic) on the Psychodiagnostic Chart. The results over-all showed support that most of
the MMPI-2 scales have more clinical sensitivity than the RC scales at all levels of psychopathology and
particularly at the less pathological levels. K correction does not account for the elevation differences.
Most of the RC scales add little to no incremental validity to the MMPI-2 Clinical scales except for RC 1,
RC 2, and RC 9 and these may be used as supplemental scales.
Keywords: MMPI-2; MMPI-RC; MMPI-RF; Psychodiagnostic Chart; PDM; Psychopathology
Introduction
Tellegen, Ben-Porath, McNulty, Arbisi, Graham, and Kaem-
mer (2003) first produced the Restructured Clinical scales (RC)
to improve measurement of the core constructs of the MMPI-2
Clinical scales, but then went on to develop a separate compet-
ing form of the MMPI. Rouse, Greene, Butcher, Nichols, and
Williams (2008) looked at a sample of 78,159 respondents
across diverse clinical settings and found that each RC scale
was highly correlated with the existing MMPI-2 contents scales;
higher, in fact, than the correlation between the RC scale and its
parent scale concluding that the RC scales added nothing new
to the MMPI-2 scales.
Binford and Liljequist (2008) compared the behavioral cor-
relates of RCd, RC 2, and RC 4 with their original Clinical
scale counterparts (Scale 2, Scale 4), and conceptually related
Content scales (DEP, ASP, CYN) in an outpatient clinical sam-
ple (N = 150). The results indicated that RC 4 is a stronger
predictor of several antisocial behaviors than Clinical Scale 4 or
the Content Scales ASP and CYN. In contrast, RC 2 demon-
strated significantly lower correlations with several behaviors
conceptually related to depression than its Clinical scale coun-
terpart or DEP. Bolinskey, and Nichols (2011) concluded that
RC 4, RC 7, and RC 9 are not necessarily equivalent to those
assessed by the original scales.
The RC scales have higher internal consistency and dis-
criminant validity than the original MMPI-2 clinical scales,
which the authors believe, would lead to greater clinical utility.
However, Gordon (2008) warned that the high internal consis-
tency of the RC scales violates a basic assumption of complex
psychopathology. Whereas some unitary symptoms such as
anxiety or anger can be assessed with scales of high internal
consistency, such homogenized scales will not work well for
complex diagnostic conditions such as Hysteria, Post Traumatic
Stress Disorder and Borderline Personality.
For example, Tellegen, et al. (2003) eliminated the Hysteria
scale and replaced it with the RC 3 Cynicism scale. Dahlstrom,
Welsh, and Dahlstrom (1972) stated that the items on the Hys-
teria scale seem mutually contradictory. The Hysteria scale has
such seemingly unrelated issues such as somatic complaints,
naiveté, denial of aggressive motives, unhappy home life and
sexual conflicts. The RC researchers removed from the Hys-
teria scales the demoralization and somatic complaints items
and assigned them to their own distinct scales, leaving mainly
the items of naively trusting. Naiveté is an aspect of hysteria.
The researchers reversed the scoring of the naiveté items and
produced the RC 3 scale of Cynicism. Cynicism is neither an
aspect of nor a substitute for Hysteria. The authors found that
RC 3 poorly correlated with the MMPI-2 Hysteria scale; .24
for females and .18 for males. The RC 3 scale serves as an
excellent example of the failure of the behavioral assumption
that psychopathology is simply the sum of additive correlated
symptoms.
The RC scales have been criticized for having less clinical
sensitivity than the MMPI-2 Clinical Scales. Wallace (2005)
found that the majority of client MMPI-2 profiles (56%) had
fewer scale elevations on the RC scales as compared to the
MMPI-2 Clinical scales. In Nichols’ (2011) review of the issue,
he concluded “upon the presently available weight of the evi-
dence, the RC scales, like the MMPI content scales, the sub-
R. M. GORDON ET AL.
stantive MMPI-2-RF scales, and other content-based measures
lack sensitivity and therefore may underestimate the presence,
significance, and magnitude of clinical problems, a liability that
may render them less than suitable for screening purposes (e.g.,
employment screening) for which maximal sensitivity is desir-
able...” (p. 16).
Sellbom, Ben-Porath, McNulty, Arbisi, and Graham (2006)
felt that the demoralization items, subtle items, and K correc-
tion contributed substantially to elevation differences between
the MMPI-2 and RC scales. Though the item diversity of clini-
cal syndromes would contribute to greater sensitivity of the
MMPI-2 over the RC scales, it is unlikely that K is a cause of
the differences. K is often lower with greater psychopathology
and would not be adding to the elevation.
There are currently no known published studies comparing
the sensitivity of the MMPI-2 Clinical scales and the MMPI-
RC scales with a population of individuals diagnosed through
the full dimension of psychopathology (psychotic, borderline
and neurotic). Lanyon and Thomas (2013) did look at the
MMPI-RF and Psychological Screening Inventory (PSI) noting
that the 3 Higher Order (HO) scales of the MMPI-RF and the 3
core clinical scales of the PSI/PSI-2 were developed to broadly
represent the 3 traditional categories of mental disorder: major
psychiatric disorder (“psychotic”), general psychological dis-
tress (“neurotic”), and significant antisocial characteristics
(“character disorder”). Their research found support for using
these basic personality organizations, but the authors did not
compare the sensitivity of these tests to these categories.
Gordon and Bornstein (2012) developed the Psychodiagnos-
tic Chart (PDC)1,2 to operationalize the Psychodynamic Diag-
nostic Manual (2006). The first axis of the PDC measures per-
sonality organization with the Overall Personality Organization
scale (OPO), which helps categorized individuals as mainly
operating on a psychotic, borderline or neurotic to healthy level
(Bornstein & Gordon, 2012). A preliminary study of the OPO
scale and PDC indicted good reliability and validity (Gordon &
Stoffey, 2013).
Method
Participants
Thirty-eight psychologists who are MMPI-2 experts were
contacted by email and asked to rate their last ten psychother-
apy patients, disability or forensic clients on the PDC. They
were advised to share no other identifying data other than the
client’s initials, gender, ethnicity, age and years of education.
They were given a manual as to how to use the Psychodiagnos-
tic Chart (PDC) and asked to rate each client without looking at
their MMPI-2s. Of the 38 psychologists, 15 sent in 98 PDCs
with MMPI-2s. The overall sample of 104 clients consisted of
43 women, 61 men (93% Caucasian, mean age = 40.65, age
range: 18 - 74 years, mean years of education = 15.54, educa-
tion range: 6 - 22 years). The client sample included people
from forensic, disability and psychotherapy evaluations, repre-
senting a wide range from psychotic to neurotic personality
organizations.
Results
Hypothesis One
For Hypothesis 1, we predicted that the MMPI-2 scales
should show more clinical sensitivity than the RC scales at: 1)
all levels of psychopathology and 2) particularly at the less
pathological levels. To test this hypothesis, we calculated a
series of paired-samples t tests using 8 MMPI-2 scale scores
(Hs, D, Hy, Pd, Pa, Pt, Sc, Ma) and 8 corresponding MMPI-RC
scale scores (RC 1, RC 2, RC 3, RC 4, RC 6, RC 7, RC 8, RC 9)
within each of the three levels or categories of the Overall Per-
sonality Organization (OPO) scale. The categories were derived
by dividing the 10-point OPO scale into psychotic (ratings 1 - 3,
n = 13), borderline (4 - 6, n = 51), and neurotic (7 - 10, n = 33)
levels. (There were no “healthy” levels of individuals in this
sample so this category was labeled “neurotic.”).
Within the psychotic level, the first 3 paired-samples t tests
comparing MMPI-2 Hs, D, and Hy scales with the correspond-
ing MMPI RC 1, RC 2, RC 3 scales were not significant. The
paired-samples t tests comparing MMPI-2 Pd, Pa, Pt, and Sc
with the MMPI RC 4, RC 6, RC 7, and RC 8 were all signifi-
cant. Finally, the paired-samples t test comparing the MMPI-2
Ma scale with the MMPI RC 9 scale failed to reach significance.
Taken together, within the psychotic level of the OPO, 50% of
the paired-samples t tests were significant in the predicted di-
rection (see Table 1 for a summary of the scale means, standard
deviations, t values, p values and d values within the psychotic
level of the OPO).
Within the borderline level, the first paired-sample t test
comparing the MMPI-2 Hs scale with the MMPI RC 1 scale
was not significant. The paired-samples t tests comparing
Table 1.
The MMPI-2 vs. RC sensitivity at psychotic level of overall personality
organization.
Scale M SD t p d
Hs 65.69 17.12 1.95 .075 .54
RC 1 69.31 19.31
D 71.23 17.54 1.29 .223 .36
RC 2 67.38 18.87
Hy 72.69 18.46 1.91 .08 .53
RC 3 60 9.8
Pd 79.46 12.07 7.4 .001 2.06
RC 4 56.54 5.75
Pa 80.46 18.67 3.99 .002 1.11
RC 6 66.08 15.07
Pt 78 19.43 6.27 .001 1.74
RC 7 54.38 10.28
Sc 85.77 19.55 4.4 .001 1.22
RC 8 67.54 16.88
Ma 61.38 14.06 .318 .756 .09
RC 9 62.23 10.13
1Parts of these findings were presented at the American Psychoanalytic
Association National Meeting at New York Discussion on January 17, 2013,
“Research in Psychoanalysis: Creating the Psychodynamic Diagnostic Man-
ual, Version 2 (PDM-2): Conceptual and Empirical Issues.” The session was
co-organized by the American Psychoanalytic Association and the Psycho-
dynamic Psychoanalytic Research Society.
2For free copies of the PDC search online for “Psychodiagnostic Chart” or
email rmgordonphd@gmail.com.
Copyright © 2013 SciRes. 13
R. M. GORDON ET AL.
MMPI-2 D, Hy, Pd, Pa, Pt, and Sc with the corresponding
MMPI RC 2, RC 3, RC 4, RC 6, RC 7, and RC 8 were all sig-
nificant.
The final paired-sample t test comparing the MMPI-2 Ma
scale with the MMPI RC 9 scale failed to reach significance.
Taken together, 75% of the paired-sample t tests within the
borderline level were significant in the predicted direction (see
Table 2 for a summary of the scale means, standard deviations,
t values, p values and d values within the borderline level of the
OPO).
The last set of paired-sample t tests examined mean differ-
ences between the MMPI-2 and MMPI RC scales within the
neurotic level of the OPO. The only paired-samples t test that
failed to reach significance was between the MMPI-2 D and
MMPI RC 2 scale. Within the neurotic level, a total of 88% of
the paired-samples t tests were significant in the predicted di-
rection (see Table 3 for a summary of the scale means, scale
standard deviations, t values, p values and d values within the
neurotic level of the OPO).
Across all three levels of the Overall Personality Organiza-
tion (OPO) scale a total of 71% of the paired-samples t tests
were significant. Taken together, the above analyses lend strong
support to Hypothesis 1 (a). In support of Hypothesis 1 (b), the
neurotic level of the OPO contained the largest percentage of
significant pair-sample t tests (88%), followed by the borderline
level (75%), and lastly the psychotic level (50%).
Hypothesis Two
For Hypothesis 2, we predicted that the added K correction
does not account for the differences in elevation between the
MMPI-2 scales versus the MMPI RC scales. To test this hy-
pothesis, we calculated means and standard deviations both
within each level of the Overall Personality Organization (OPO)
scale and an overall mean and standard deviation across all
three levels of the OPO. The level means and standard devia-
tions were: psychotic (M = 40.08, SD = 7.16), borderline (M =
48.44, SD = 8.65) and neurotic (M = 55.88, SD = 9.33). The
Table 2.
The MMPI-2 vs. RC sensitivity borderline level of the overall personal-
ity organization.
Scale M SD t p d
Hs 58.86 13.36 1.34 .185 .19
RC 1 57.63 13.98
D 66.57 16.01 3.43 .001 .48
RC 2 61.94 15.91
Hy 64.31 13.98 5.23 .001 .73
RC 3 50.24 10.13
Pd 66.06 11.2 7.15 .001 1
RC 4 54.04 10.13
Pa 63.33 11.71 5.6 .001 .78
RC 6 53.94 11.9
Pt 63.67 12.98 7.69 .001 1.08
RC 7 50.86 10.98
Sc 62.08 12.39 6.02 .001 .84
RC 8 52.86 11.78
Ma 50.63 8.57 1.21 .234 .17
RC 9 49.35 8.31
Table 3.
The MMPI-2 vs. RC sensitivity neurotic level of the overall personality
organization.
Scale M SD t p d
Hs 56.67 11.24 3.21 .003 .56
RC 1 52.85 11.55
D 54.73 9.92 1.1 .279 .19
RC 2 52.85 7.44
Hy 59.85 12.15 4.49 .001 .78
RC 3 46.79 8.31
Pd 59.7 8.87 4.41 .001 .77
RC 4 52 9.68
Pa 56.97 9.85 5.9 .001 1.03
RC 6 46.48 8.02
Pt 57.27 10.07 6.15 .001 1.07
RC 7 45.97 8.04
Sc 56.18 9.28 4.91 .001 .85
RC 8 45.91 7.84
Ma 49.24 6.49 2.67 .012 .46
RC 9 45.76 6.76
overall mean and standard deviation across all levels of the
OPO was M = 49.80 and SD = 10.30 indicating that the greater
elevations in the MMPI-2 Clinical scales are not due to the K
correction.
Hypothesis Three
For hypothesis 3, we predicted that for each clinical scale,
the RC scale adds very little incremental validity to the MMPI-
2 clinical scales in predicting the level of severity in the Overall
Personality Organization (OPO) scale. In testing hypothesis 3, a
series of multiple regressions were conducted where an MMPI-
2 scale was entered first, followed by its corresponding RC
scale.
In the first regression, Hs was entered first followed by RC 1.
For the first model, Hs accounted for 3.80% of the variance in
the OPO scale (R2 = .038). When RC 1 is included (model 2),
this value increases to .149 or 14.9% of the variance in the OPO
scale (R2 = .149), an increase of 11.1%. The F change for
model 2 was significant, F(1,94) = 12.303, p = .001, indicating
that adding RC 1 significantly improved the prediction of the
OPO scale compared to using Hs as a single predictor.
In the second regression, D was entered first followed by RC
2. For model 1, D accounted for 15% of the variance in the
OPO scale (R2 = .150). When RC 2 was entered in model 2,
this value increased to .153 or 15.3% (R2 = .153), an increase of
only .30%. The F change for model 2 was not significant,
F(1,94) = .382, p = .538, indicating that adding the RC 2 scale
did not significantly improve the prediction of the OPO scale
compared to using only D.
The third regression entered Hy followed by RC 3. For
model 1, Hy accounted for 7.30% of the variance in the OPO
scale (R2 = .073). For model 2, this value increased to .247 or
24.7% (R2 = .247), an increase of 17.4%. The F change was
significant, F(1,94) = 21.68, p = .001, indicating the adding RC
3 did significantly improve the prediction of the OPO scale
above and beyond what was predicted using only Hy. However,
Copyright © 2013 SciRes.
14
R. M. GORDON ET AL.
RC 3 is a measure of Cynicism and not hysterical personality
traits and therefore cannot be considered a substitute for the
MMPI-2 Hy scale.
In the next regression, model 1 contained Pd, with RC 4
added in model 2. For model 1, Pd accounted for 23.9% of the
variance in the OPO scale (R2 = .239). For model 2, this value
increased to .241 or 24.1% (R2 = .241), an increase of only .2%.
This change in R2 produced a non-significant F(1,94) = .249, p
= .619, indicating no predictive improvement with the inclusion
of RC 4.
The fifth regression entered Pa followed by RC 6. For the
first model with Pa entered alone, Pa accounted for 24.2% of
the variance in the OPO scale (R2 = .242). When RC 6 was
added in model 2, this value increased to .289 or 28.9%, pro-
ducing a significant F(1,94) = 6.228, p = .014, indicating im-
provement in predicting the OPO scale compared to using only
Pa. An examination of the beta values for these two predictors
in model 2 suggests, however, that Pa predicts more of the
variance in the OPO scale than does RC 6 (.317 vs. .279).
That is, while RC 6 predicts additional variance above and
beyond that predicted by Pa alone, the amount predicted is
small relative to Pa.
We next entered Pt in model 1 followed by RC 7 in model 2.
For model 1, Pt accounted for 18.2% of the variance in the
OPO scale (R2 = .182). For model 2, this value increased
to .184 or 18.4 (R2 = .184), an increase of only .2%. This
change in R2 produced a non-significant F(1,94) = .306, p
= .582, indicating no predictive improvement with the inclusion
of RC 7.
The next regression entered Sc in model 1 and RC 8 in
model 2. For model 1, Sc accounted for 28.3% of the variance
in the OPO scale (R2 = .283). For model 2, this value increased
to .320 or 32.0.1% (R2 = .320), an increase of 3.7%. This
change in R2 produced a significant F(1,94) = 5.036, p = .027,
indicating improvement in predicting in the OPO scale with the
inclusion of RC 8. However, the beta values indicate the Sc
predicts more of the variance in the OPO scale than does the
RC 8 scale (.366 vs. .253).
In the final regression, Ma was entered first, followed in
model 2 with RC 9. For model 1, Ma accounted for 11.3% of
the variance in the OPO scale (R2 = .113). Adding RC 9 in
model two increased this value to 24.1% (R2 = .241), producing
a significant F(1,94) = 15.809, p = .001. In this regression, the
beta values indicate that RC 9 in comparison to MA also pre-
dicts more of the variance in the OPO scale (.476 vs. .021).
In summary, 5 of the 8 RC scales (RC 1, RC 2, RC 6, RC 8,
and RC 9) added incremental validity to the MMPI-2 clinical
scales in predicting the level of severity in the Overall Person-
ality Organization (OPO) scale. However, an examination of
the beta values indicates that for 2 of the 5 RC scales (RC 6 and
RC 8) the amount of additional predicted variance is relatively
small in comparison to the amount predicted by their corre-
sponding MMPI-2 scales (Pa and SC). Taken together, in terms
of predictive utility, the results suggest that only 3 of the 8 or
37.5% of the RC scales contribute incrementally in predicting
the level of severity in the OPO scale, lending support to hy-
pothesis 3.
Discussion
This study looked at the clinical sensitivity of the MMPI-2
Clinical scales vs. the MMPI-RC scales with 98 clients from
forensic, disability and psychotherapy evaluations, representing
a wide range from psychotic, borderline to neurotic levels of
personality organization as measured by the Psychodiagnostic
Chart. Since the RC scales lack a diversity of items and subtly,
we hypothesized that the MMPI-2 Clinical scales would have
more clinical sensitivity than the RC scales at: 1) all levels of
psychopathology and 2) particularly at the less pathological
levels where subtlety is more of an issue in detecting psycho-
pathology.
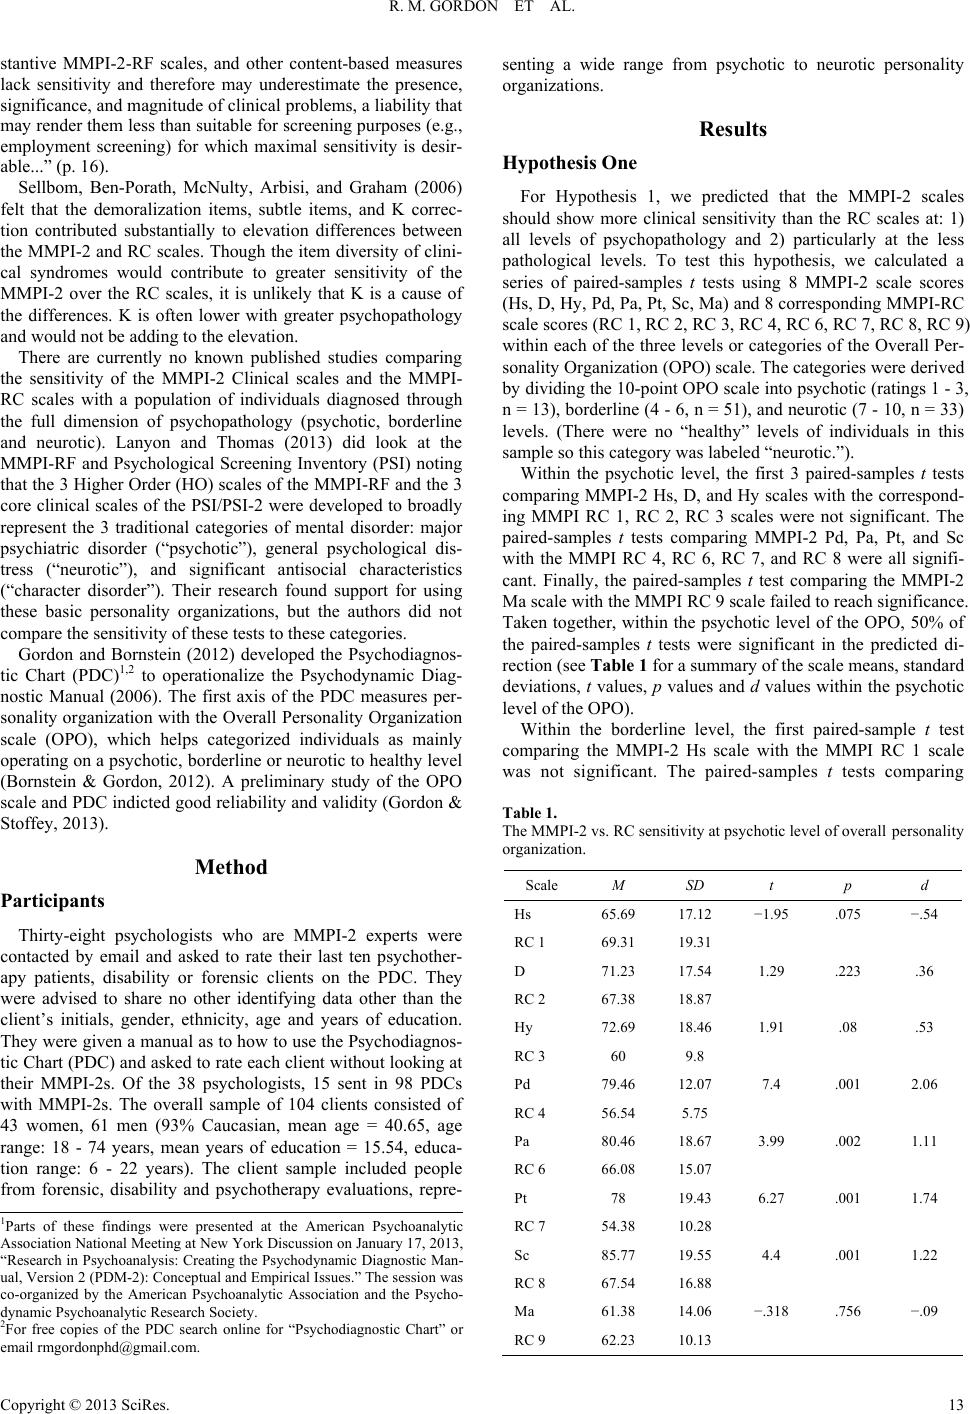
We found that the clients at the psychotic level of personality
organization as measured by the PDC, the MMPI-2 Hs, D, Hy
and Ma scales were not significantly different than the corre-
sponding MMPI RC 1, RC 2, RC 3, RC 9 scales. The MMPI-2
Pd, Pa, Pt, and Sc were all significantly higher than the corre-
sponding RC 4, RC 6, RC 7, and RC 8. Only 4 of the RC scales
reached clinical significance (T 65 or more), while 7 of the 8
MMPI 2 Clinical scales were T 65 or more for clients at the
psychotic level.
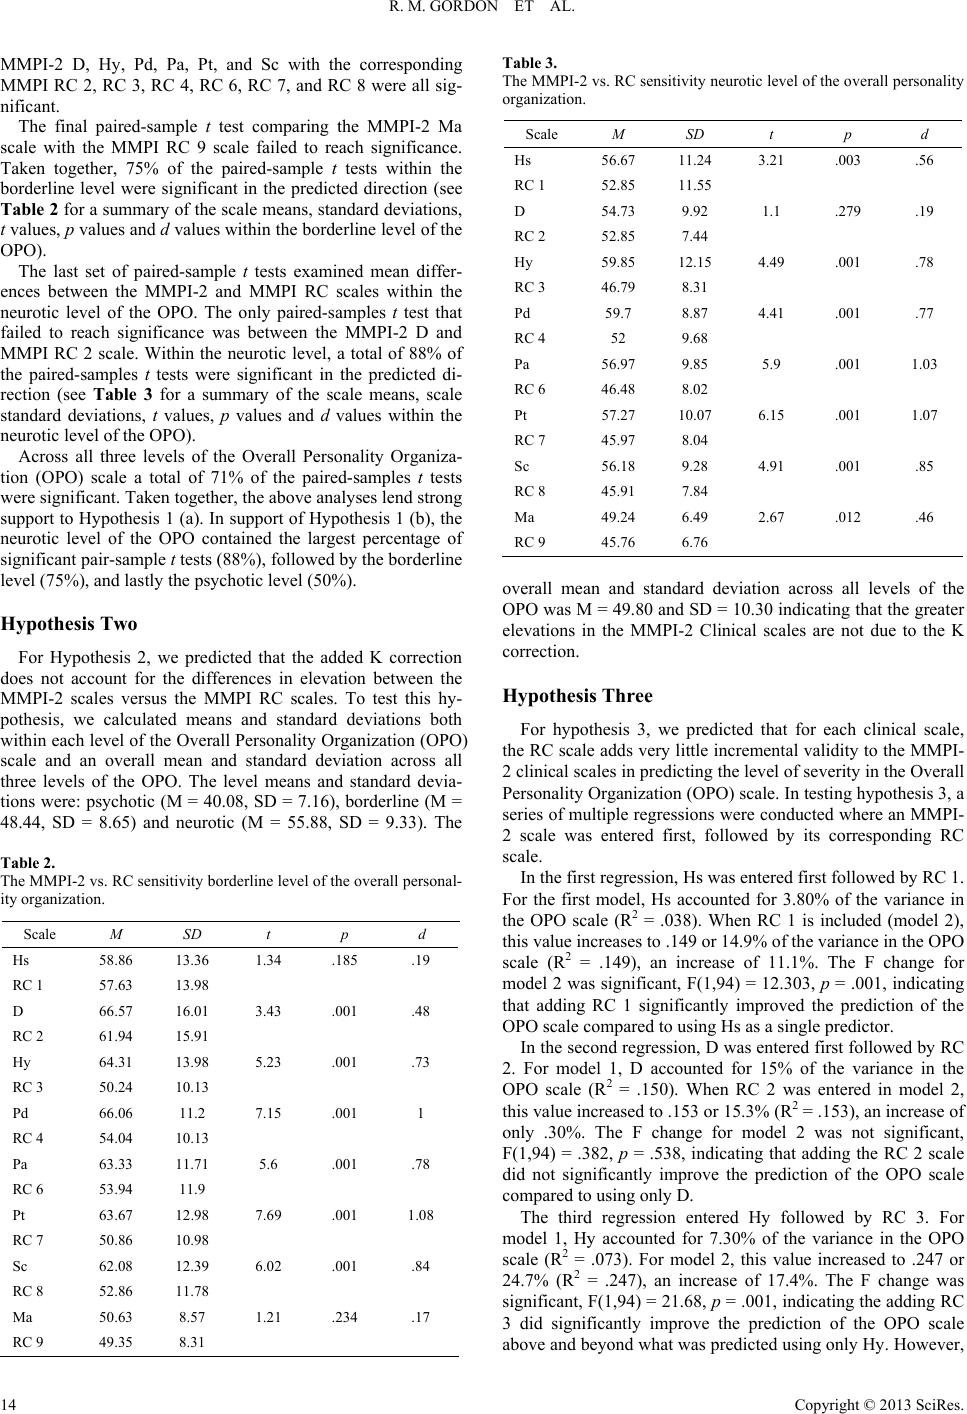
For those clients rated on the PDC at the borderline level the
MMPI-2, Hs and Ma scales and the RC 1 and RC 9 scales were
not significantly different. The MMPI-2 D, Hy, Pd, Pa, Pt, and
Sc were all significantly higher than the corresponding RC 2,
RC 3, RC 4, RC 6, RC 7, and RC 8 scales. D and Pd were in
the clinical range, but none of the RC scales reached the clinical
range of T 65.
For those clients rated on the PDC at the neurotic level, only
the MMPI-2 D scale and the RC 2 scales were not significantly
different. The MMPI-2 Hs, Hy, Pd, Pa, Pt, Sc and Ma were all
significantly higher than the corresponding RC scales. Across
all three levels of the Overall Personality Organization (OPO),
the neurotic level of the OPO had 88% difference between the
MMPI-2 and RC, followed by the borderline level (75%) and
lastly the psychotic level (50%).
The added K correction to the MMPI-2 Clinical scales does
not seem likely to account for the differences in elevations.
Overall, K was at the normal level (M = 49.80). K was lowest
in the psychotic level and highest in the neurotic level. K func-
tions in much the same way as the subtle items function in
those scales that are not K corrected, i.e. as the defensive as-
pects of the psychopathology (Gordon, 1989). These diagnosti-
cally valid items are not artificially elevating the Clinical scales.
Both K and the subtle items add diagnostic sensitivity to the
MMPI-2 scales not found in homogenized scales.
Most of the RC scales add little to no incremental validity to
the MMPI-2 Clinical scales in predicting the level of severity in
the Overall Personality Organization (OPO) scale. However,
RC 1, RC 2, and RC 9 do have value in adding to the incre-
mental validity of the MMPI-2 and should be considered as
supplemental scales. We recommend using the MMPI-2 Clini-
cal scales for screening psychopathology and to use the RC
scales only as supplemental scales. The broader issue, however,
is the value of criteria-based scales. The MMPI-2 scales were
based on the complexity expressed in the conflicts of disturbed
individuals. The RC scales are based on behavioral reductionis-
tic assumptions of psychopathology which fail to capture the
complexity of human conflicts.
REFERENCES
Binford, A., & Liljequist, L. (2008). Behavioral correlates of selected
MMPI-2 clinical, content, and restructured clinical scales. Journal of
Personality Assessment, 90, 608-614.
Copyright © 2013 SciRes. 15
R. M. GORDON ET AL.
Copyright © 2013 SciRes.
16
doi:10.1080/00223890802388657
Bolinskey, P. K., & Nichols, D. S. (2011). Construct drift in the MMPI-
2 restructured clinical scales: Further evidence and a possible historic
example. Journal of Clini cal Psychology, 67, 907-917.
doi:10.1002/jclp.20814
Bornstein, R. F., & Gordon, R. M. (2012). What do practitioners want
in a diagnostic taxonomy? Comparing the PDM with DSM and ICD.
Division/Review: A Quarterly Psychoanalytic Forum, 6.
Dahlstrom, W. G., Welsh, G. S., & Dahlstrom, L. E. (1972). An MMPI
handbook: Vol. I: Clinical interpretations. Minneapolis, MN: Uni-
versity of Minnesota Press.
Gordon, R. M. (1989). Interpreting MMPI subtle scales as representing
defense mechanisms. Paper presented at the 24th Annual Symposium
on Recent Developments in the Use of the MMPI, Honolulu.
Gordon, R. M. (2006). False assumptions about psychopathology, hys-
teria and the MMPI-2 restructured clinical scales. Psychological Re-
ports, 98, 870-872. doi:10.2466/pr0.98.3.870-872
Gordon, R. M., & Stoffey, R. W. (2013). Research in psychoanalysis:
Creating the psychodynamic diagnostic manual, version 2 (PDM-2):
Conceptual and empirical issues. Presented at the American Psy-
choanalytic Association Nat ional Meeting, New York.
Lanyon, R. I., & Thomas, M. L. (2013). Assessment of global psychiat-
ric categories: The PSI/PSI-2 and the MMPI-2-RF. Psychological
Assessment, 25, 227-232. doi:10.1037/a0030313
Nichols, D. S. (2011). Essentials of MMPI-2 assessment (2nd ed.).
Essentials of psychological assessment. Hoboken, NJ: John Wiley &
Sons Inc.
PDM Task Force (2006). Psychodynamic diagnostic manual. Silver
Spring, MD: Alliance of Psychoanalytic Organizations.
Rouse, S. V., Greene, R. L., Butcher, J. N., Nichols, D. S., & Williams,
C. L. (2008). What do the MMPI-2 restructured clinical scales relia-
bly measure? Answers from multiple research settings. Journal of
Personality Assessment, 90, 435-442.
doi:10.1080/00223890802248695
Sellbom, M., Ben-Porath, Y. S., McNulty, J. L., Arbisi, P. A., & Gra-
ham, J. R. (2006). Elevation differences between MMPI-2 clinical
and restructured clinical (RC) scales: Frequency, origins, and inter-
pretative implications. Assessment, 13, 430-441.
doi:10.1177/1073191106293349
Tellegen, A., Ben-Porath, Y. S., McNulty, J. L., Arbisi, P. A., Graham,
J. R., & Kaemmer, B. (2003). MMPI-2 restructured clinical (RC)
scales: Development, validation, and interpretation. Minneapolis,
MN: University of Minnesota Press.
Wallace, A., & Laura, L. (2005). A comparison of the correlational
structures and elevation patterns of the MMPI-2 restructured clinical
(RC) and clinical scales. Assessment, 12, 290-294.
doi:10.1177/1073191105276250