 International Journal of Analytical Mass Spectrometry and Chromatography, 2013, 1, 22-30 http://dx.doi.org/10.4236/ijamsc.2013.11004 Published Online September 2013 (http://www.scirp.org/journal/ijamsc) Measurement of Glutathio n yl ated Haemog lobin by MALDI-ToF Mass Spectrometry as a Biomarker of Oxidative Stress in Heavy Smokers and in Occupational Obese Subjects Federico Maria Rubino1*, Cinzia Della Noce2, Luisella Vigna3, Rachele De Giuseppe4, Cristina Novembrino5, Federica de Liso5, Rita Maiavacca5, Lorenzo Patrini3, Luciano Riboldi3, Fabrizia Bamonti4 1Laboratorio di Tossicologia e Metabonomica Analitica (LaTMA), Dipartimento di Scienze della Salute, Università degli Studi di Milano, Milano, Italy 2Consiglio Nazionale delle Ricerche, Istituto di Fisiologia Clinica, Dipartimento CardioToracico e Vascolare, Ospedale Niguarda Ca’ Granda, Milano, Italy 3Dipartimento di Medicina Preventiva, U.O. Medicina del Lavoro, “Clinica del Lavoro L Devoto”, Fondazione IRCCS Ca’ Granda Ospedale Maggiore Policlinico, Milano, Italy 4Dipartimento di Scienze Biomediche, Chirurgiche e Odontoiatriche, Università degli Studi di Milano, Unità Operativa di Ematologia e CTMO, Fondazione IRCCS Ca’ Granda Ospedale Maggiore Policlinico via F. Sforza 35, Milano, Italy 5Laboratorio Centrale di Analisi Chimico Cliniche e Microbiologia, Fondazione IRCCS Cà Granda Ospedale Maggiore Policlinico, via F. Sforza 35, Milano, Italy Email: *federico.rubino@unimi.it Received July 10, 2013; revised August 16, 2013; accepted September 7, 2013 Copyright © 2013 Federico Maria Rubino et al. This is an open access article distributed under the Creative Commons Attribution License, which permits unrestricted use, distribution, and reproduction in any medium, provided the original work is properly cited. ABSTRACT Glutathionyl-haemoglobin (Hb-SSG) is a minor form of haemoglobin characterized by the presence of a disulfide bond between the β-93 cysteine residue and the thiol group of glutathione. Hb-SSG is naturally present in the erythrocytes at levels comparable to those of glycated haemoglobin and can be measured by MALDI mass spectrometry on very small samples of erythrocytes from peripheral blood. Since Hb-SSG has been recognized as a sensitive biomarker of oxidative stress in several degenerative diseases (diabetes, hyperlipidemia, kidney disease) and in healthy workers exposed to glutathione-depleting toxic agents such as butadiene, we have measured for the first time the levels of Hb-SSG in two groups: healthy heavy cigarette smokers and overweight-obese. For both classes of subjects, the measured levels (6.4% ± 1.7%, n = 30 for smokers; 3.0% ± 0.8%, n = 20 for overweight-obese) are in the upper 97th percentile of those meas- ured in the Italian general population. Levels in smokers show a small, yet statistically significant dependence on the level of smoking addiction (>20 cig./day vs. 20 cig./day: 7.0% ± 1.4% vs. 5.7% ± 1.1%; p < 0.05). This biomarker thus adds to those presently available to rationally assess the extent of biological damage caused by tobacco smoking. Keywords: Biomarker; Glutathionyl-Haemoglobin; Oxidative Stress; Erythrocyte; Mass Spectrometry 1. Introduction Tobacco smoking is a long known major cause of mor- bidity and premature death, mainly due to cardiovascular disease and lung cancer. Among the toxic effects of in- halation of the combustion products of tobacco, a main one is the induction of local and systemic oxidative stress. This condition occurs when the excessive production of, or exposure to, reactive chemical substances (e.g. metal ions, unsaturated aldehydes, quinones) overwhelms the level of natural defence mechanisms, (e.g. free radical quenchers, antioxidant enzymes, electrophile scavengers). As a consequence, key enzymes can be inactivated and cellular functions impaired to the point that diseases such as atherosclerosis and cancer can be triggered [1]. Overweight or obesity is a common condition in the population of the “western” world and can lead to long- term health impairment and risk of myocardial infarction, brain stroke and other life-threatening complications [2]. *Corresponding author. C opyright © 2013 SciRes. IJAMSC 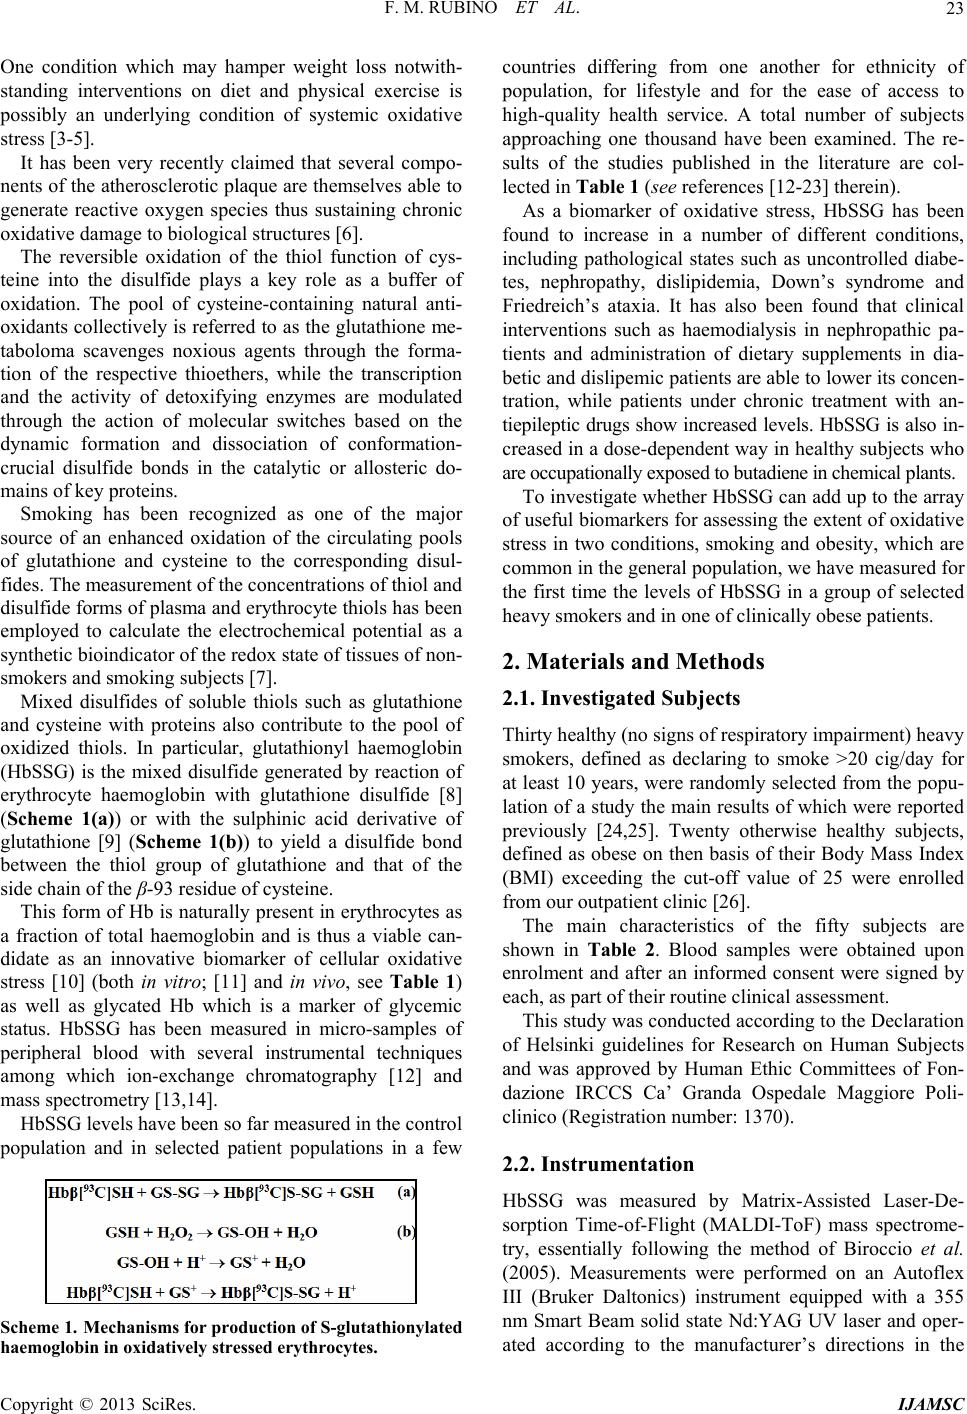 F. M. RUBINO ET AL. 23 One condition which may hamper weight loss notwith- standing interventions on diet and physical exercise is possibly an underlying condition of systemic oxidative stress [3-5]. It has been very recently claimed that several compo- nents of the atherosclerotic plaque are themselves able to generate reactive oxygen species thus sustaining chronic oxidative damage to biological structures [6]. The reversible oxidation of the thiol function of cys- teine into the disulfide plays a key role as a buffer of oxidation. The pool of cysteine-containing natural anti- oxidants collectively is referred to as the glutathione me- taboloma scavenges noxious agents through the forma- tion of the respective thioethers, while the transcription and the activity of detoxifying enzymes are modulated through the action of molecular switches based on the dynamic formation and dissociation of conformation- crucial disulfide bonds in the catalytic or allosteric do- mains of key proteins. Smoking has been recognized as one of the major source of an enhanced oxidation of the circulating pools of glutathione and cysteine to the corresponding disul- fides. The measurement of the concentrations of thiol and disulfide forms of plasma and erythrocyte thiols has been employed to calculate the electrochemical potential as a synthetic bioindicator of the redox state of tissues of non- smokers and smoking subjects [7]. Mixed disulfides of soluble thiols such as glutathione and cysteine with proteins also contribute to the pool of oxidized thiols. In particular, glutathionyl haemoglobin (HbSSG) is the mixed disulfide generated by reaction of erythrocyte haemoglobin with glutathione disulfide [8] (Scheme 1(a)) or with the sulphinic acid derivative of glutathione [9] (Scheme 1(b)) to yield a disulfide bond between the thiol group of glutathione and that of the side chain of the β-93 residue of cysteine. This form of Hb is naturally present in erythrocytes as a fraction of total haemoglobin and is thus a viable can- didate as an innovative biomarker of cellular oxidative stress [10] (both in vitro; [11] and in vivo, see Table 1) as well as glycated Hb which is a marker of glycemic status. HbSSG has been measured in micro-samples of peripheral blood with several instrumental techniques among which ion-exchange chromatography [12] and mass spectrometry [13,14]. HbSSG levels have been so far measured in the control population and in selected patient populations in a few Scheme 1.Mechanisms for production of S-glutathionylated haemoglobin in oxidatively stressed erythr ocytes. countries differing from one another for ethnicity of population, for lifestyle and for the ease of access to high-quality health service. A total number of subjects approaching one thousand have been examined. The re- sults of the studies published in the literature are col- lected in Table 1 (see references [12-23] therein). As a biomarker of oxidative stress, HbSSG has been found to increase in a number of different conditions, including pathological states such as uncontrolled diabe- tes, nephropathy, dislipidemia, Down’s syndrome and Friedreich’s ataxia. It has also been found that clinical interventions such as haemodialysis in nephropathic pa- tients and administration of dietary supplements in dia- betic and dislipemic patients are able to lower its concen- tration, while patients under chronic treatment with an- tiepileptic drugs show increased levels. HbSSG is also in- creased in a dose-dependent way in healthy subjects who are occupationally exposed to butadiene in chemical plants. To investigate whether HbSSG can add up to the array of useful biomarkers for assessing the extent of oxidative stress in two conditions, smoking and obesity, which are common in the general population, we have measured for the first time the levels of HbSSG in a group of selected heavy smokers and in one of clinically obese patients. 2. Materials and Methods 2.1. Investigated Subjects Thirty healthy (no signs of respiratory impairment) heavy smokers, defined as declaring to smoke >20 cig/day for at least 10 years, were randomly selected from the popu- lation of a study the main results of which were reported previously [24,25]. Twenty otherwise healthy subjects, defined as obese on then basis of their Body Mass Index (BMI) exceeding the cut-off value of 25 were enrolled from our outpatient clinic [26]. The main characteristics of the fifty subjects are shown in Table 2. Blood samples were obtained upon enrolment and after an informed consent were signed by each, as part of their routine clinical assessment. This study was conducted according to the Declaration of Helsinki guidelines for Research on Human Subjects and was approved by Human Ethic Committees of Fon- dazione IRCCS Ca’ Granda Ospedale Maggiore Poli- clinico (Registration number: 1370). 2.2. Instrumentation HbSSG was measured by Matrix-Assisted Laser-De- sorption Time-of-Flight (MALDI-ToF) mass spectrome- try, essentially following the method of Biroccio et al. (2005). Measurements were performed on an Autoflex III (Bruker Daltonics) instrument equipped with a 355 nm Smart Beam solid state Nd:YAG UV laser and oper- ated according to the manufacturer’s directions in the Copyright © 2013 SciRes. IJAMSC 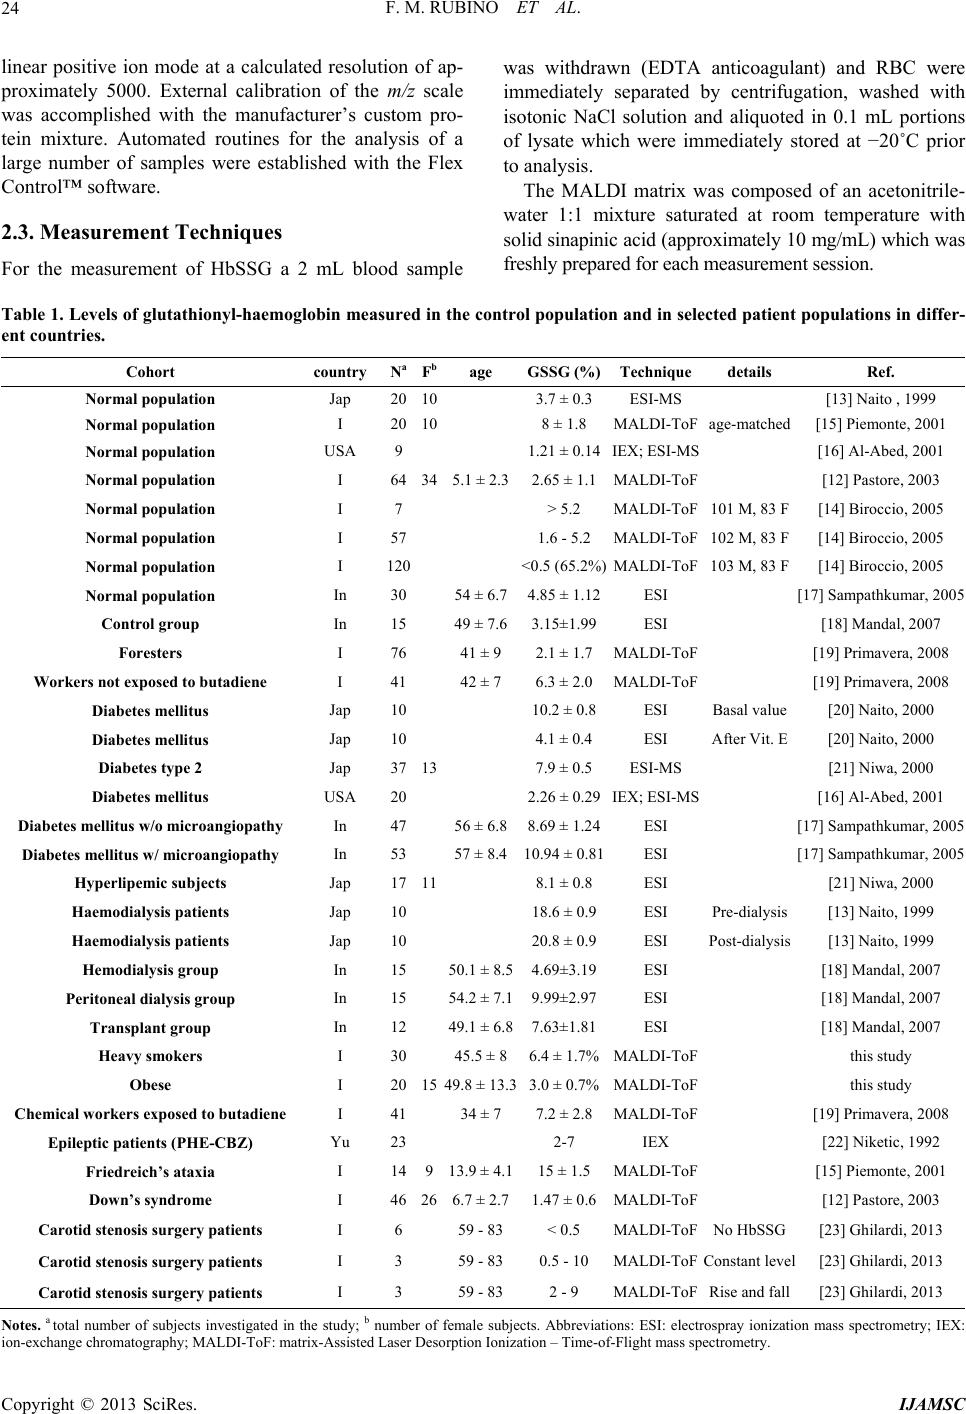 F. M. RUBINO ET AL. Copyright © 2013 SciRes. IJAMSC 24 linear positive ion mode at a calculated resolution of ap- proximately 5000. External calibration of the m/z scale was accomplished with the manufacturer’s custom pro- tein mixture. Automated routines for the analysis of a large number of samples were established with the Flex Control™ software. 2.3. Measurement Techniques For the measurement of HbSSG a 2 mL blood sample was withdrawn (EDTA anticoagulant) and RBC were immediately separated by centrifugation, washed with isotonic NaCl solution and aliquoted in 0.1 mL portions of lysate which were immediately stored at −20˚C prior to analysis. The MALDI matrix was composed of an acetonitrile- water 1:1 mixture saturated at room temperature with solid sinapinic acid (approximately 10 mg/mL) which was freshly prepared for each measurement session. Table 1. Levels of glutathionyl-haemoglobin measured in the control population and in selected patient populations in differ- ent countries. Cohort country NaFbage GSSG (%)Techniquedetails Ref. Normal population Jap 2010 3.7 ± 0.3 ESI-MS [13] Naito , 1999 Normal population I 2010 8 ± 1.8 MALDI-ToFage-matched [15] Piemonte, 2001 Normal population USA 9 1.21 ± 0.14IEX; ESI-MS [16] Al-Abed, 2001 Normal population I 64345.1 ± 2.32.65 ± 1.1MALDI-ToF [12] Pastore, 2003 Normal population I 7 > 5.2 MALDI-ToF101 M, 83 F [14] Biroccio, 2005 Normal population I 57 1.6 - 5.2 MALDI-ToF102 M, 83 F [14] Biroccio, 2005 Normal population I 120 <0.5 (65.2%)MALDI-ToF103 M, 83 F [14] Biroccio, 2005 Normal population In 3054 ± 6.74.85 ± 1.12ESI [17] Sampathkumar, 2005 Control group In 1549 ± 7.63.15±1.99ESI [18] Mandal, 2007 Foresters I 7641 ± 9 2.1 ± 1.7 MALDI-ToF [19] Primavera, 2008 Workers not exposed to butadiene I 4142 ± 7 6.3 ± 2.0 MALDI-ToF [19] Primavera, 2008 Diabetes mellitus Jap 10 10.2 ± 0.8ESI Basal value [20] Naito, 2000 Diabetes mellitus Jap 10 4.1 ± 0.4 ESI After Vit. E [20] Naito, 2000 Diabetes type 2 Jap 3713 7.9 ± 0.5 ESI-MS [21] Niwa, 2000 Diabetes mellitus USA 20 2.26 ± 0.29IEX; ESI-MS [16] Al-Abed, 2001 Diabetes mellitus w/o microangiopathy In 4756 ± 6.88.69 ± 1.24ESI [17] Sampathkumar, 2005 Diabetes mellitus w/ microangiopathy In 5357 ± 8.410.94 ± 0.81ESI [17] Sampathkumar, 2005 Hyperlipemic subjects Jap 1711 8.1 ± 0.8 ESI [21] Niwa, 2000 Haemodialysis patients Jap 10 18.6 ± 0.9ESI Pre-dialysis [13] Naito, 1999 Haemodialysis patients Jap 10 20.8 ± 0.9ESI Post-dialysis [13] Naito, 1999 Hemodialysis group In 1550.1 ± 8.54.69±3.19ESI [18] Mandal, 2007 Peritoneal dialysis group In 1554.2 ± 7.19.99±2.97ESI [18] Mandal, 2007 Transplant group In 1249.1 ± 6.87.63±1.81ESI [18] Mandal, 2007 Heavy smokers I 3045.5 ± 86.4 ± 1.7%MALDI-ToF this study Obese I 201549.8 ± 13.33.0 ± 0.7%MALDI-ToF this study Chemical workers exposed to butadiene I 4134 ± 7 7.2 ± 2.8 MALDI-ToF [19] Primavera, 2008 Epileptic patients (PHE-CBZ) Yu 23 2-7 IEX [22] Niketic, 1992 Friedreich’s ataxia I 14913.9 ± 4.115 ± 1.5 MALDI-ToF [15] Piemonte, 2001 Down’s syndrome I 46266.7 ± 2.71.47 ± 0.6MALDI-ToF [12] Pastore, 2003 Carotid stenosis surgery patients I 659 - 83 < 0.5 MALDI-ToFNo HbSSG [23] Ghilardi, 2013 Carotid stenosis surgery patients I 359 - 83 0.5 - 10 MALDI-ToFConstant level [23] Ghilardi, 2013 Carotid stenosis surgery patients I 359 - 83 2 - 9 MALDI-ToFRise and fall [23] Ghilardi, 2013 Notes. a total number of subjects investigated in the study; b number of female subjects. Abbreviations: ESI: electrospray ionization mass spectrometry; IEX: ion-exchange chromatography; MALDI-ToF: matrix-Assisted Laser Desorption Ionization – Time-of-Flight mass spectrometry. 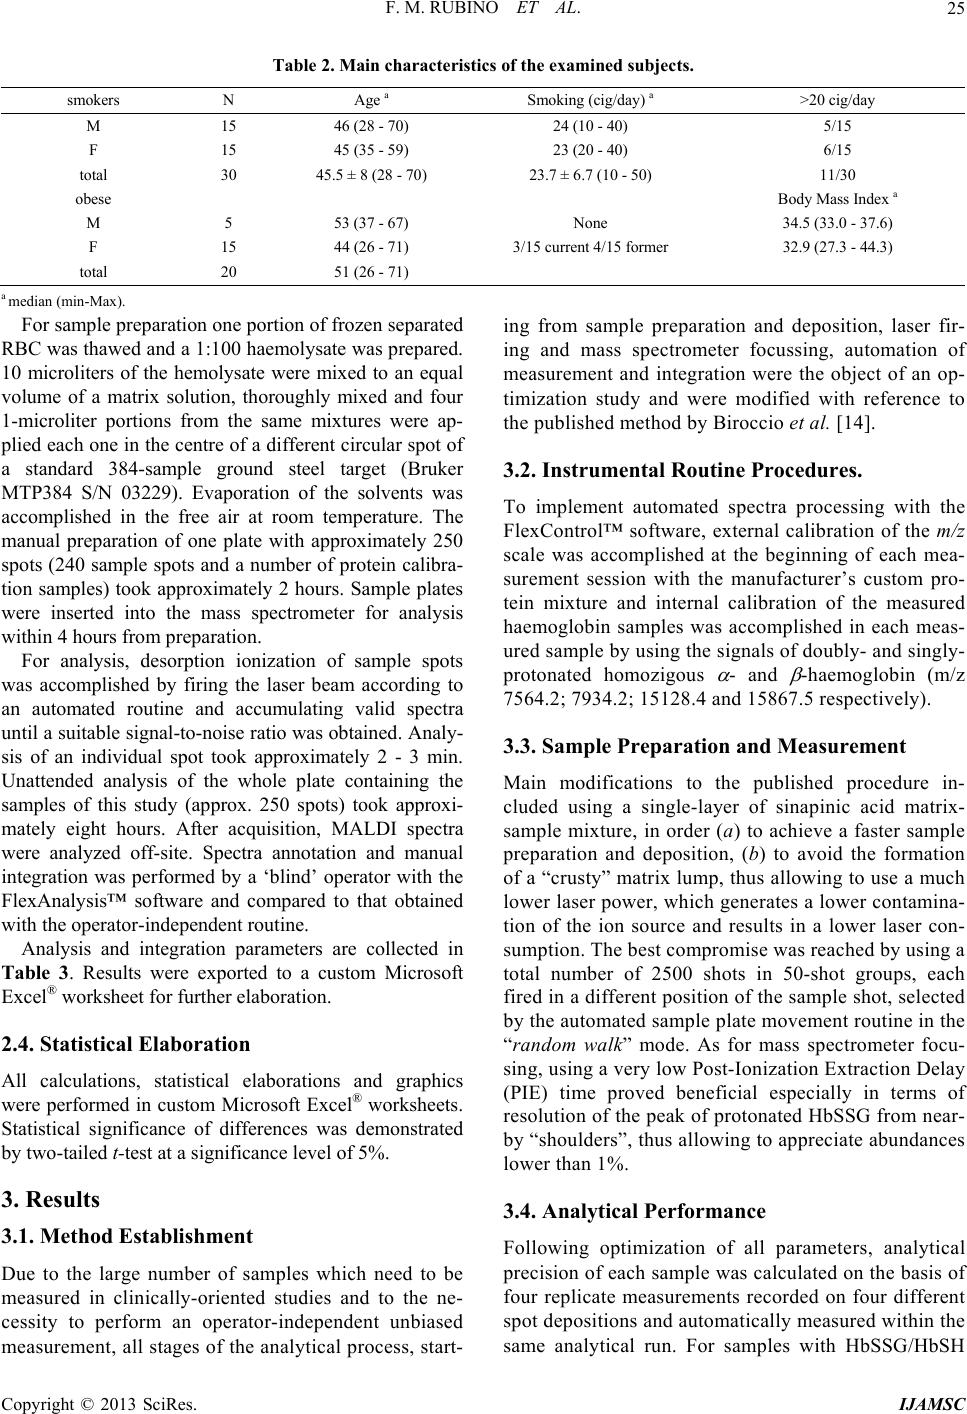 F. M. RUBINO ET AL. 25 Table 2. Main characteristics of the examined subjects. smokers N Age a Smoking (cig/day) a >20 cig/day M 15 46 (28 - 70) 24 (10 - 40) 5/15 F 15 45 (35 - 59) 23 (20 - 40) 6/15 total 30 45.5 ± 8 (28 - 70) 23.7 ± 6.7 (10 - 50) 11/30 obese Body Mass Index a M 5 53 (37 - 67) None 34.5 (33.0 - 37.6) F 15 44 (26 - 71) 3/15 current 4/15 former 32.9 (27.3 - 44.3) total 20 51 (26 - 71) a median (min-Max). For sample preparation one portion of frozen separated RBC was thawed and a 1:100 haemolysate was prepared. 10 microliters of the hemolysate were mixed to an equal volume of a matrix solution, thoroughly mixed and four 1-microliter portions from the same mixtures were ap- plied each one in the centre of a different circular spot of a standard 384-sample ground steel target (Bruker MTP384 S/N 03229). Evaporation of the solvents was accomplished in the free air at room temperature. The manual preparation of one plate with approximately 250 spots (240 sample spots and a number of protein calibra- tion samples) took approximately 2 hours. Sample plates were inserted into the mass spectrometer for analysis within 4 hours from preparation. For analysis, desorption ionization of sample spots was accomplished by firing the laser beam according to an automated routine and accumulating valid spectra until a suitable signal-to-noise ratio was obtained. Analy- sis of an individual spot took approximately 2 - 3 min. Unattended analysis of the whole plate containing the samples of this study (approx. 250 spots) took approxi- mately eight hours. After acquisition, MALDI spectra were analyzed off-site. Spectra annotation and manual integration was performed by a ‘blind’ operator with the FlexAnalysis™ software and compared to that obtained with the operator-independent routine. Analysis and integration parameters are collected in Table 3. Results were exported to a custom Microsoft Excel® worksheet for further elaboration. 2.4. Statistical Elaboration All calculations, statistical elaborations and graphics were performed in custom Microsoft Excel® worksheets. Statistical significance of differences was demonstrated by two-tailed t-test at a significance level of 5%. 3. Results 3.1. Method Establishment Due to the large number of samples which need to be measured in clinically-oriented studies and to the ne- cessity to perform an operator-independent unbiased measurement, all stages of the analytical process, start- ing from sample preparation and deposition, laser fir- ing and mass spectrometer focussing, automation of measurement and integration were the object of an op- timization study and were modified with reference to the published method by Biroccio et al. [14]. 3.2. Instrumental Routine Procedures. To implement automated spectra processing with the FlexControl™ software, external calibration of the m/z scale was accomplished at the beginning of each mea- surement session with the manufacturer’s custom pro- tein mixture and internal calibration of the measured haemoglobin samples was accomplished in each meas- ured sample by using the signals of doubly- and singly- protonated homozigous - and -haemoglobin (m/z 7564.2; 7934.2; 15128.4 and 15867.5 respectively). 3.3. Sample Preparation and Measurement Main modifications to the published procedure in- cluded using a single-layer of sinapinic acid matrix- sample mixture, in order (a) to achieve a faster sample preparation and deposition, (b) to avoid the formation of a “crusty” matrix lump, thus allowing to use a much lower laser power, which generates a lower contamina- tion of the ion source and results in a lower laser con- sumption. The best compromise was reached by using a total number of 2500 shots in 50-shot groups, each fired in a different position of the sample shot, selected by the automated sample plate movement routine in the “random walk” mode. As for mass spectrometer focu- sing, using a very low Post-Ionization Extraction Delay (PIE) time proved beneficial especially in terms of resolution of the peak of protonated HbSSG from near- by “shoulders”, thus allowing to appreciate abundances lower than 1%. 3.4. Analytical Performance Following optimization of all parameters, analytical precision of each sample was calculated on the basis of four replicate measurements recorded on four different spot depositions and automatically measured within the same analytical run. For samples with HbSSG/HbSH Copyright © 2013 SciRes. IJAMSC  F. M. RUBINO ET AL. 26 Table 3. Parameters for the measurement of glutathionyl haemoglobin with the automated technique in the bruker autoflex instrument. AutoXecute method Laser: Fuzzy control – Parent mode ON Weight 1.00 Use initial laser power on new laser spot Initial laser power 35% Max laser power 45% Evaluation: Use masses from 5000 Da to 15000 Da for evaluation and processing. Accumulation: Fuzzy control: OFF Sum up: 2000 shots in in 100-shot steps Allow only 100 satisfactory shots per raster spot Movement: Measure raster: spiral very small Maximal allowed shot number at one raster position – Parent mode 100 Processing: DEFAULT MS/MS: DEFAULT FlexAnalysis - Processing method Peak detection algorithm Centroid Signal to noise threshold 6 Relative intensity threshold 0 DEFAULT Minimum intensity threshold 0 DEFAULT Maximum number of peaks 50 Peak width 10 Height 80% DEFAULT Smoothing algorithm Savitzky-Golay Width 5 Cycles 3 Baseline subtraction TopHat DEFAULT ratios in the range of 3.5% - 11.7% was usually of 0.4% (<0.1% - 1.1%). 3.5. Reliability of Glutathionyl-Haemoglobin Measurement Two possible causes of measurement bias were evalu- ated: (a) generation of HbSSG by RBC autoxidation after blood withdrawal, especially under conditions when separation of RBCs from whole blood had to be delayed by as long as 6 hours or strict temperature control at +4˚C could not be warranted over the same time and (b) decomposition of HbSSG following sam- ple storage. To check whether HbSSG could be generated after blood sampling from the investigated subjects and prior to analysis, new aliquots of washed and packed RBCs of some control subjects coming from other similar studies, which had yielded no detectable levels of HbSSG, were re-analyzed for confirmation immedi- ately after preparation and after being kept at ambient temperature for 12 - 16 hours. None of the examined samples showed formation of HbSSG either in the first or in the second analytical run, thus out-ruling its arte- fact formation as a consequence of sample processing and storage. To check whether HbSSG may decompose upon sample storage, washed and packed RBC samples with initial HbSSG levels between 2 and 8% coming from this and from other similar studies were prepared and re-analyzed along with the samples of the current study. HbSSG levels in washed and packed RBCs do not change significantly when samples are stored at −20 to −80˚C for at least six months. These results, as a whole, demonstrate that measurement of HbSSG in RBC haemolysates by MALDI-ToF mass spectrometry is able to reliably detect event-related changes of 0.5 to 0.8% of absolute values. The MALDI mass spectra of haemoglobin samples obtained from subjects with no detectable (upper panel) and high (lower panel) levels of haemoglobin glu- tathionylation are shown in Figure 1. Copyright © 2013 SciRes. IJAMSC  F. M. RUBINO ET AL. 27 The upper spectrum, with no detectable HbSSG sig- nal (subject not included in this study), is only shown to the purpose of exemplifying the detection level of the employed analytical technique. The subject yield- ing the lower spectrum exemplifies the levels measured in the investigated population. Analytical precision (SD of four replicate measurements recorded on four different spot depositions of the same sample and automatically measured within the same analytical run) was of 0.9% (0.1% - 4.5%) for samples with HbSSG/ HbSH ratios in the range of 3.5% - 11.7%. 3.6. Glutathionyl-Haemoglobin Levels in Smokers Mean HbSSG of the entire group of the 30 investigated subjects is 6.2% ± 1.4% (3.5% - 9.1%), with no appar- ent difference between genders and no significant sta- tistical correlation with the declared number of ciga- rettes smoked in the day. However subjects who de- clared smoking up to 20 cig/day had statistically lower HbSSG levels than those smoking >20 to 40 cig/day (5.7% ± 1.1% vs. 7.0% ± 1.4%; p < 0.05; Figure 2). HbSSG levels showed no correlation with haemo- globin levels, measured either as concentration (in g/dL) or as haematocrit. 3.7. Glutathionyl-Haemoglobin Levels in Overweight-Obese Subjects Mean HbSSG of the entire group of 20 investigated subjects is 3.0% ± 0.8% (1.9% - 4.6%), with no appar- ent difference between genders and no significant sta- tistical correlation with the BMI calculated from height and weight recorded at the time of first presentation to the outpatient clinic. HbSSG levels showed no correla- tion with haemoglobin levels, measured either as con- centration (in g/dL) or as haematocrit. 4. Discussion and Conclusions To carry large studies on oxidative stress which involve the measurement of glutathionyl-haemoglobin in human red blood cells, a method that uses MALDI-ToF mass spectrometry is set up and the main factors of analytical variability are studied. By fine-tuning sample depo- Figure 1. MALDI-ToF mass spectra of 1:100 haemolysates of human subjects (for measurement conditions, see Experimen- al). t Copyright © 2013 SciRes. IJAMSC  F. M. RUBINO ET AL. 28 sition on the MALDI target and ionization and detection for human transfusion is tested by measuring HbSSG on conditions, analytical precision reached 0.9% (0.1% - 4.5%) for samples with HbSSG/HbSH ratios in the range of 3.5% - 11.7% and sensitivity allowed to detect a frac- tion of HbSSG as low as 0.5%. The stability of HbSSG in red blood cells demonstrated to be sufficiently high for all our study purposes. Neither generation of HbSSG by autoxidation of RBC content, nor its degradation oc- curred even in not-so-strict sample preparation and stor- age conditions, in order that only standard separation and washing of RBC was necessary. Further confirmation of this observation comes from a contemporary running study where the stability of red blood cell concentrates the day of blood donation and after 42 days of storage at +4˚C [27] (Carpani et al., 2011). To better frame within the body of existing data the results from our investigated population of otherwise healthy subjects, the literature data which have been col- lected in Table 1 have been used to generate the histo- gram of Figure 3. Bars show the variability (min-Max) of the levels of HbSSG measured for different examined subpopulations (healthy or control groups of clinical stu- dies; subjects with different conditions or diseases), in- cluding those of this study. The levels measured in our study of otherwise healthy cig / day 0% 2% 4% 6% 8% 10% 5 10152025303540 cig/day HbSSG (%) 45 >20 =20 5. 7 ?1.1 % 7.0 ?1.4 % 5.7 ± 1.1% 7.0 ± 1.4% Figure 2. Levels of glutathionyl haemoglobin in smoking subjects with different self-assessed mean daily cigarette consump- tion. 0 5 10 15 20 25 30 I I I I I I IInInInJapUSAI I IJapJapJapUSAInInJapJapJapInInInInYuI I control groups of clinical and population studies HbSSG Hb (%) heavy smokers (this study) obese subjects (this study) Chemical workers exposed to butadiene diabetes kidney disease hyperlipaemia others clinical conditions Figure 3. Comparison of HbSSG levels measured in the literature studies (interval as determined by the reported results o Table 1). The Country where the studies were performed are reported in the horizontal axis. f Copyright © 2013 SciRes. IJAMSC  F. M. RUBINO ET AL. 29 groups of heavy smokers and of obese subjects are best ompared with those measured in the general Italian Wesseling and E. F. M. Wouters, “Systemic Effects of Smoking,” Chest, Vol. 1 c population by Biroccio et al. [14]. The mean values measured in our subjects place in the upper 3% of the investigated group (two-thirds of the population <0.5%; 10th - 90th percentile of the remaining 1.6% - 5.2%). It is also apparent that the values measured in the Italian population are much lower than those reported as be- longing to the “control groups” of the several studies performed in Indian and Far-Eastern populations. The values measured are also lower than those meas- ured in dialyzed (5% - 20%; weighted mean 11.4%) [13, 18] and diabetic (5% - 11%; weighted mean 8.3%) [16, 17,20] subjects and, for the group of smokers, approxi- mately in the same range (7.2% ± 2.8%) of healthy sub- jects who are occupationally exposed to butadiene in chemical plants at airborne concentrations in the range 0.1 - 200 μg/m3 [19]. To the best of our knowledge, this is the first study measuring HbSSG in a group of otherwise healthy sub- jects such as heavy smokers and obese, showing that these subjects have higher levels than those reported by others in a healthy population [14]. In particular, the ef- fect of heavy tobacco smoking in generating systemic oxidative stress as measured by glutathionyl haemoglo- bin is similar to that of a health-threatening degenerative disease such as diabetes and only two-fold less than that experienced by kidney patients undergoing life-saving haemo- or peritoneal dialysis. Glutathionyl-haemoglobin thus shows the effect of oxidative stress associated to tobacco smoking, and it is likely that this innovative biomarker may be useful to assess the extent of damage caused by the harmful effects of tobacco addiction and to monitor the health improvement associated to smoke cessation interventions. As for the effect on oxidative stress of overweight and treatment-refractory obesity, a low yet fairly constant level of HbSSG may strengthen the hypothesis that atherosclerotic plaque is itself a pro- ducer of diffusible oxidant species [6] which are able to cross the erythrocyte membrane and oxidize the red blood cell thiolome [28], thus causing the production of disulfide and mixed disulfide species. 5. Acknowledgements We are grateful to the Director and Staff of the Centro [1] D. G. Yanbaeva, M. A. Dentener, E. C. Creutzberg, 31, No. 5, 2007, pp. 1557-1566. doi:10.1378/chest.06-2179 [2] L. F. Van GalE. De Block, “Me- chanisms Linkvascular Disease,” Interdipartimentale Grandi Apparecchiature (CIGA) of Università degli Studi di Milano for access to the Bruker Autoflex III MALDI mass spectrometer. The assistance of Marco Pitton, BSc, in performing measurements and data analysis is gratefully acknowledged. REFERENCES G. l, I. L. Mertens and C. ing Obesity with Cardio Nature, Vol. 444, 2006, pp. 875-880. doi:10.1038/nature05487 [3] C. Vassalle, C. Novembrino, S. Maffei, et al., “Determi- nants of Oxidative Stress Re lated to Gender: Relevance of Age and Smoking Habit,” Clinical Chemistry and Labo- ratory Medicine, Vol. 49, 2011, pp. 1509-1513. doi:10.1515/CCLM.2011.622 [4] L. Vigna, C. Novembrino, R. De Giuseppe, et al., “Nutri- tional and Oxidative Status in Occupational Obese Sub- jects,” Mediterranean Journal of Nutrition and Metabo- lism, Vol. 4, No. 1, 2010, pp. 69-74. doi:10.1007/s12349-010-0003-1 [5] C. Vassalle, L. Vigna, S. Bianchi, et al., “A Biomarker of Oxidative Stress as Non-Traditional Risk Factor in Obese Subjects,” Biomarkers in Nutrition, Vol. 7, No. 4, 2013, pp. 633-639. doi:10.2217/bmm.13.49 [6] M. J. Moller, Z. Qin and B. Toursark kers in Human Atherosclerotic issian, “Tissue Mar- Carotid Artery Plaque,” Annals of Vascular Surgery, Vol. 26, No. 8, 2012, pp. 1160-1165. doi:10.1016/j.avsg.2012.06.008 [7] S. E. Moriarty, J. H. Shah, M. Lynn, et al., “Oxidation of Glutathione and Cysteine in Human Plasma Associated with Smoking,” Free Radical Biology and Medicine, Vol. 35, No. 12, 2003, pp. 1582-1588. doi:10.1016/j.freeradbiomed.2003.09.006 [8] M. C. Garel, C. Domenget, J. Caburi-Martin, C. Prehu, F. Carini and G. Galacteros and Y. Beuzard, “Covalent Binding of Glu- tathione to Haemoglobin. I. Inhibition of Haemoglobin S Polymerization,” Journal of Biological Chemistry, Vol. 261, No. 31, 1986, pp. 14704-14709. [9] L. Regazzoni, A. Panusa, K.-J. Yeum, M. Aldini, “Haemoglobin Glutathionylation Can Occur through Cysteine Sulfenic Acid Intermediate: Electrospray Ioniza- tion LTQ-Orbitrap Hybrid Mass Spectrometry Studies,” Journal of Chromatography B, Vol. 877, No. 28, 2009, pp. 3456-3461. doi:10.1016/j.jchromb.2009.05.020 [10] S.-E. Bursell and G. L. King, “The Potential Use of Glu- tathionyl Haemoglobin as a Clinical Marker of Oxidative Stress,” Clinical Chemistry, Vol. 46, No. 2, 2000, pp. 145-146. [11] K. Murakami and S. Mawatari, “Oxidation of Haemoglo- bin to Methaemoglobin in Intact Erythrocyte by a Hy- droperoxide Induces Formation of Glutathionyl Haemo- globin and Binding of Alpha-Haemoglobin to Membrane,” Archives of Biochemistry and Biophysics, Vol. 417, No. 2, 2003, pp. 244-250. doi:10.1016/S0003-9861(03)00389-8 [12] A. Pastore, A. F. Mozzi, G. Tozzi, L. M. Gaeta, G. Fe- derici, E. Bertini, A. Lo Russo, L. Mannucci and F. Pie- monte, “Determination of Glutathionyl-Haemoglobin in Human Erythrocytes by Cation-Exchange High-Perform- ance Liquid Chromatography,” Analytical Biochemistry, Vol. 312, No. 2, 2003, pp. 85-90. doi:10.1016/S0003-2697(02)00500-6 [13] C. Naito, K. Kajita and T. Niwa, “Determination of Glu- Copyright © 2013 SciRes. IJAMSC  F. M. RUBINO ET AL. 30 tathionyl Haemoglobin in Hemodialysis Patients Using Electrospray Ionization Liquid Chromatography-Mass Spectrometry,” Journal of Chromatography B, Vol. 731, No. 1, 1999, pp. 121-124. doi:10.1016/S0378-4347(99)00139-5 C. di Ilio, P. Sac- ol. 336, No. 2, 2005, pp. 279- [14] A. Biroccio, A. Urbani, R. Massoud, chetta, S. Bernardini, C. Cortese and G. Federici, “A Quan- titative Method for the Analysis of Glycated and Gluta- thionylated Haemoglobin by Matrix-Assisted Laser De- sorption Ionization-Time of Flight Mass Spectrometry,” Analytical Biochemistry, V 288. doi:10.1016/j.ab.2004.10.002 [15] F. Piemonte, A. Pastore, G. Tozzi, D.Tagliacozzi, F. M. Santorelli, R. Carrozzo, C. Casali, M. Damiano, G. Fe- derici and E. Bertini, “Glutathione in Blood of Patients with Friedreich’s Ataxia,” European Journal of Clinical Investigation, Vol. 31, 2001, pp. 1007-1011. doi:10.1046/j.1365-2362.2001.00922.x [16] Y. Al-Abed, S. VanPatten, H. Li, J. A. Lawson, G. A. udarslal, M creased Glutathi- FitzGerald, K. R. Manogue and R. Bucala, “Characteriza- tion of a Novel Haemoglobin-Glutathione Adduct That Is Elevated in Diabetic Patients,” Molecular Medicine, Vol. 7, No. 9, 2001, pp. 619-923. [17] R. Sampathkumar, M. Balasubramanyam, S. S Rema, V. Mohan and P. Balaram, “In . onylated Haemoglobin (HbSSG) in Type 2 Diabetes Sub- jects with Microangiopathy,” Clinical Biochemistry, Vol. 38, No. 10, 2005, pp. 892-899. doi:10.1016/j.clinbiochem.2005.06.009 [18] A. K. Mandal, M. Woodi, V. Sood, P. R. Krishnaswamy, A. Rao, S. Ballal and P. Balaram, “Quantitation and Cha- racterization of Glutathionyl Haemoglobin as an Oxida- tive Stress Marker in Chronic Renal Failure by Mass Spectrometry,” Clinical Biochemistry, Vol. 40, No. 13-14, 2007, pp. 986-994. doi:10.1016/j.clinbiochem.2007.05.006 [19] A. Primavera, S. Fustinoni, A. Biroccio, S. Ballerini, A. Urbani, S. Bernardini, G. Federici, E. Capucci, M. Manno and M. Lo Bello, “Glutathione Transferases and Glutathi- onylated Haemoglobin in Workers Exposed to Low Doses of 1,3-Butadiene,” Cancer Epidemiology, Biomarkers & Prevention, Vol. 17, No. 11, 2008, pp. 3004-3012. doi:10.1158/1055-9965.EPI-08-0443 [20] C. Naito and T. Niwa, “Analysis of Glutathionyl Haemo- globin Levels in Diabetic Patients by Electrospray Ioniza- tion Liquid Chromatography-Mass Spectrometry: Effect of Vitamin E Administration,” Journal of Chromatogra- phy B: Biomedical Sciences and Applications, Vol. 746, No. 1, 2000, pp. 91-94. doi:10.1016/S0378-4347(00)00121-3 [21] T. Niwa, C. Naito, A. H. Mawjood and K. Imai, “Increas- ed Glutathionyl Haemo Hyperlipidemia Demonstrated by Li globin in Diabetes Mellitus and quid Chromatogra- ileptic phy/Electrospray Ionization-Mass Spectrometry,” Clini- cal Biochemistry, Vol. 46, No. 1, 2000, pp. 82-88. [22] V. Niketic, D. Beslo, S. Raicevic, S. Sredic and M. Sto- jkovic, “Glutathione Adduct of Haemoglobin (Hb ASSG) in Hemolysates of Patients on long-Term Antiep Therapy,” International Journal of Biochemistry, Vol. 24, No. 3, 1992, pp. 503-507. doi:10.1016/0020-711X(92)90046-4 [23] S. Ghilardi, F. M. Rubino, M. Pitton, N. Massetto, M. Bissi, P. Bianciardi, M. tathionyl-Haemoglobin Levels in Car Samaja and S. Carelli, “Glu- otid Endarterectomy: “Effects of Encapsulated Fruit and Vegetable A Pilot Study on 12 Cases Clinically Uneventful,” The Journal of Cardiovascular Surgery (Torino), 2013, in Press. [24] C. Novembrino, G. Cighetti, R. De Giuseppe, L. Vigna, F. de Liso, M. Pellegatta, D. Gregori, R. Maiavacca and F. Bamonti, Juice Powder Concentrates on Oxidative Status in Heavy Smokers,” Journal of the American College of Nutrition, Vol. 30, No. 1, 2011, pp. 49-56. doi:10.1080/07315724.2011.10719943 [25] F. Bamonti, M. Pellegatta, C. Novembrino, L. Vigna, R. De Giuseppe, F. de Liso, D. Gre Patrini, G. Schiraldi, P. Bonara, L. Ca gori, C. Della Noce, L. lvelli, R. Maiav- acca and G. Cighetti, “An Encapsulated Juice Powder Con- centrate Improves Markers of Pulmonary Function and Cardiovascular Risk Factors in Heavy Smokers,” Journal of the American College of Nutrition, Vol. 32, No. 1, 2013, pp. 18-25. doi:10.1080/07315724.2013.767652 [26] World Health Organization (WHO), “Global Database on Body Mass Index,” 1995. http://apps.who.int/bmi/index.jsp?introPage=intro_3.html Glutathionyl-Haemoglobin as ox Potential and Haemoglobin S-Glutathionyla- [27] G. Carpani, S. Ferrari, F. M. Rubino, M. Pitton, M. Pug- liano and E. Caneva, “Beta- a Biomarker of Oxidative Stress: Its Measurement in Red Cell Concentrates. Vox Sanguinis,” Abstracts of the 21st Regional Congress of the ISBT, Lisbon, 18-22 June 2011, p. 105. [28] G. Colombo, I. Dalle-Donne, D. Giustarini, N. Gagliano, N. Portinaro, R. Colombo, R. Rossi and A. Milzani, “Cel- lular Red tion in Human and Rat Erythrocytes: A Comparative Study,” Blood Cells, Molecules, and Diseases, Vol. 44, No. 3, 2010, pp. 133-139. doi:10.1016/j.bcmd.2009.11.005 Copyright © 2013 SciRes. IJAMSC
|