Paper Menu >>
Journal Menu >>
 Open Journal of Energy Efficiency, 2013, 2, 139-142 http://dx.doi.org/10.4236/ojee.2013.23018 Published Online September 2013 (http://www.scirp.org/journal/ojee) Simulation Using Sensitivity Analysis of a Product Production Rate Optimization Model of a Plastic Industry Mala Abba-Aji1, Vincent Ogwagwu2, Bukar Umar Musa3 1Department of Mechanical Engineering, University of Maiduguri, Maiduguri, Nigeria 2Federal University of Technology, Minna, Nigeria 3Department of Electrical and Electronics Engineering, University of Maiduguri, Maiduguri, Nigeria Email: birma4real2004@yahoo.com, musa_bu@yahoo.com Received January 1, 2013; revised March 5, 2013; accepted June 2, 2013 Copyright © 2013 Mala Abba-Aji et al. This is an open access article distributed under the Creative Commons Attribution License, which permits unrestricted use, distribution, and reproduction in any medium, provided the original work is properly cited. ABSTRACT This study analyzes the sensitivity analysis using shadow price of plastic products. This is based on a research carried out to study optimization problem of BOPLAS, a plastic industry in Maiduguri, North eastern Nigeria. Simplex method of Linear programming is employed to formulate the equations which were solved by using costenbol software. Sensi- tivity analysis using shadow price reveals that the price of wash hand bowls is critical to the net benefit (profit) of the company. Keywords: Sensitivity Analysis; Simplex Method; Linear Programming; Optimization 1. Introduction Shadow prices: the simplex-method provides more use- ful information than just the optimal solution to a linear programming problem. From the optimal tableau, the value of each resource in terms of its contribution to profits and overheads is determined. For the sensitivity analysis, the net benefit (or cost) of adjusting the amount of resource can also be determined. The relative value of a resource with respect to the objective function in a lin- ear programming problem is called its shadow price. It is the amount of change in the objective function per unit change in its right-hand side value. 2. Methodology 2.1. Injection Molding Process Injection molding is one of the most important plastics molding processes. It is carried out usually on horizontal hydraulic press. Granular thermoplastic materials are gravity fed from a hopper into a pressure chamber ahead of a plunger. The moving plunger causes the granular plastic to be compressed and then forced through a heating cylinder to palletize it. A torpedo shaped object in the centre of the heating cylinder, assists uniform heating. The palletized plastic is then injected through an injec- tion nozzle at great pressure into the die cavity to form the required component. The die is water-cooled; making the injected plastic to freeze almost immediately the die cavity is filled. The plunger returns, and the mould open to eject the formed material. The mold closes and the cycle is re- peated. In modern machines, as used in the company, the feed plunger is replaced with a motor driven screw plasticizer. It serves the function of both part-heating the plastic granules by internal sheer and feeding it to the mould. (Resistance heater bands are still used on the heating cylinder). The screw–plasticizer helps to ensure that the thermoplastic fed through the injector nozzle is main- tained at a constant and uniform temperature and viscos- ity. The process requires the use of expensive dies, usually called molds; thus its use has to be justified by large production runs. The process is easily automated, and cycle times of just a few seconds are common, making injection molding the most widely used process for pro- ducing plastic items. Also a wide range of shapes and plastic materials can be molded [1]. 2.2. Simplex-Method Algorithm High customer demand of kettle, water jug, wash-hand bowel, Big Bowel, medium bowel and small bowel was observed within the period of August to February of every C opyright © 2013 SciRes. OJEE 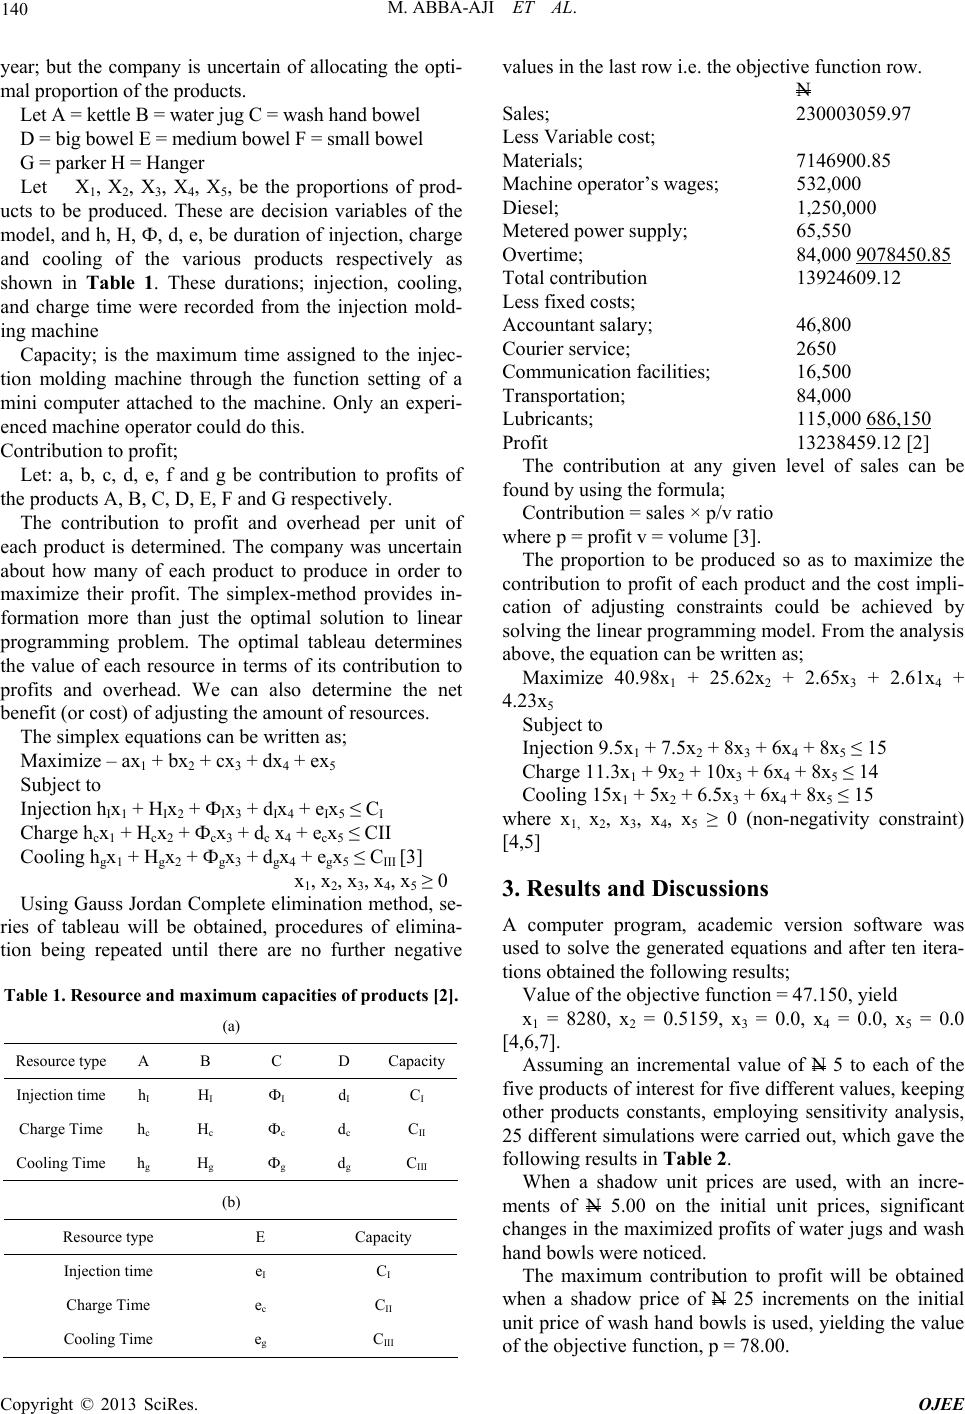 M. ABBA-AJI ET AL. 140 year; but the company is uncertain of allocating the opti- mal proportion of the products. Let A = kettle B = water jug C = wash hand bowel D = big bowel E = medium bowel F = small bowel G = parker H = Hanger Let X1, X2, X3, X4, X5, be the proportions of prod- ucts to be produced. These are decision variables of the model, and h, H, Ф, d, e, be duration of injection, charge and cooling of the various products respectively as shown in Table 1. These durations; injection, cooling, and charge time were recorded from the injection mold- ing machine Capacity; is the maximum time assigned to the injec- tion molding machine through the function setting of a mini computer attached to the machine. Only an experi- enced machine operator could do this. Contribution to profit; Let: a, b, c, d, e, f and g be contribution to profits of the products A, B, C, D, E, F and G respectively. The contribution to profit and overhead per unit of each product is determined. The company was uncertain about how many of each product to produce in order to maximize their profit. The simplex-method provides in- formation more than just the optimal solution to linear programming problem. The optimal tableau determines the value of each resource in terms of its contribution to profits and overhead. We can also determine the net benefit (or cost) of adjusting the amount of resources. The simplex equations can be written as; Maximize – ax1 + bx2 + cx3 + dx4 + ex5 Subject to Injection hIx1 + HIx2 + ФIx3 + dIx4 + eIx5 ≤ CI Charge hcx1 + Hcx2 + Фcx3 + dc x4 + еcx5 ≤ CII Cooling hgx1 + Hgx2 + Фgx3 + dgx4 + egx5 ≤ CIII [3] x1, x2, x3, x4, x5 ≥ 0 Using Gauss Jordan Complete elimination method, se- ries of tableau will be obtained, procedures of elimina- tion being repeated until there are no further negative Table 1. Resource and maximum capacities of products [2]. (a) Resource type A B C D Capacity Injection time hI H I ФI d I C I Charge Time hc H c Фc d c C II Cooling Time hg H g Фg d g C III (b) Resource type E Capacity Injection time eI C I Charge Time ec C II Cooling Time eg C III values in the last row i.e. the objective function row. N Sales; 230003059.97 Less Variable cost; Materials; 7146900.85 Machine operator’s wages; 532,000 Diesel; 1,250,000 Metered power supply; 65,550 Overtime; 84,000 9 078450.8 5 Total contribution 13924609.12 Less fixed costs; Accountant salary; 46,800 Courier service; 2650 Communication facilities; 16,500 Transportation; 84,000 Lubricants; 115,000 686,150 Profit 13238459.12 [2] The contribution at any given level of sales can be found by using the formula; Contribution = sales × p/v ratio where p = profit v = volume [3]. The proportion to be produced so as to maximize the contribution to profit of each product and the cost impli- cation of adjusting constraints could be achieved by solving the linear programming model. From the analysis above, the equation can be written as; Maximize 40.98x1 + 25.62x2 + 2.65x3 + 2.61x4 + 4.23x5 Subject to Injection 9.5x1 + 7.5x2 + 8x3 + 6x4 + 8x5 ≤ 15 Charge 11.3x1 + 9x2 + 10x3 + 6x4 + 8x5 ≤ 14 Cooling 15x1 + 5x2 + 6.5x3 + 6x4 + 8x5 ≤ 15 where x1, x 2, x3, x4, x5 ≥ 0 (non-negativity constraint) [4,5] 3. Results and Discussions A computer program, academic version software was used to solve the generated equations and after ten itera- tions obtained the following results; Value of the objective function = 47.150, yield x1 = 8280, x2 = 0.5159, x3 = 0.0, x4 = 0.0, x5 = 0.0 [4,6,7]. Assuming an incremental value of N 5 to each of the five products of interest for five different values, keeping other products constants, employing sensitivity analysis, 25 different simulations were carried out, which gave the following results in Table 2. When a shadow unit prices are used, with an incre- ments of N 5.00 on the initial unit prices, significant changes in the maximized profits of water jugs and wash hand bowls were noticed. The maximum contribution to profit will be obtained when a shadow price of N 25 increments on the initial unit price of wash hand bowls is used, yielding the value of the objective function, p = 78.00. Copyright © 2013 SciRes. OJEE 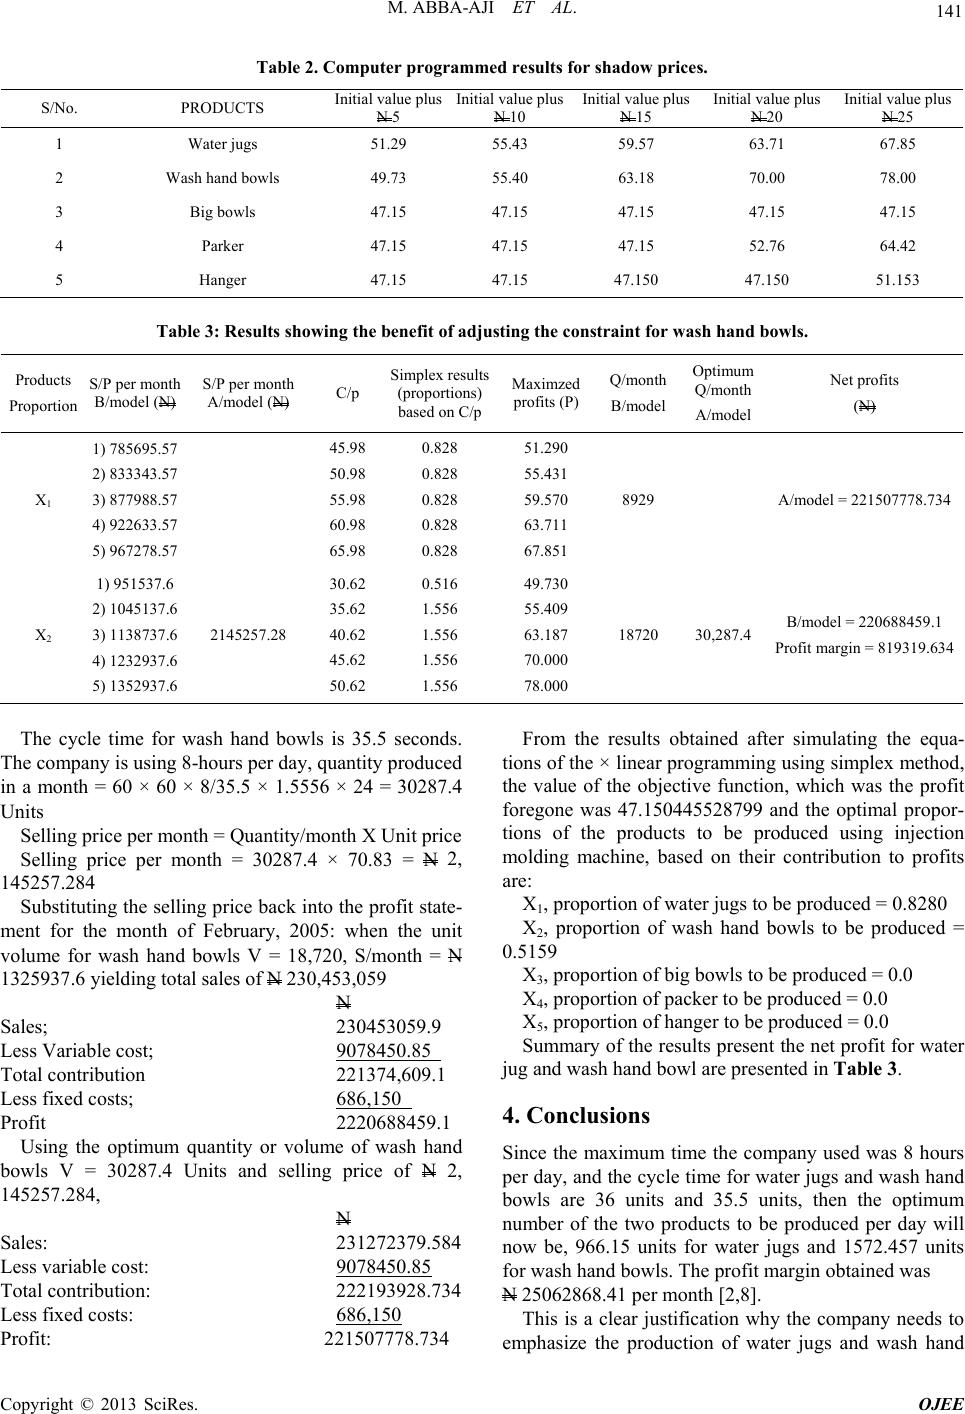 M. ABBA-AJI ET AL. Copyright © 2013 SciRes. OJEE 141 Table 2. Computer programme d results for shadow pric e s. S/No. PRODUCTS Initial value plus N 5 Initial value plus N 10 Initial value plus N 15 Initial value plus N 20 Initial value plus N 25 1 Water jugs 51.29 55.43 59.57 63.71 67.85 2 Wash hand bowls 49.73 55.40 63.18 70.00 78.00 3 Big bowls 47.15 47.15 47.15 47.15 47.15 4 Parker 47.15 47.15 47.15 52.76 64.42 5 Hanger 47.15 47.15 47.150 47.150 51.153 Table 3: Results showing the benefit of adjusting the constraint for wash hand bowls. Products Proportion S/P per month B/model (N) S/P per month A/model (N) C/p Simplex results (proportions) based on C/p Maximzed profits (P) Q/month B/model Optimum Q/month A/model Net profits (N) X1 1) 785695.57 2) 833343.57 3) 877988.57 4) 922633.57 5) 967278.57 45.98 50.98 55.98 60.98 65.98 0.828 0.828 0.828 0.828 0.828 51.290 55.431 59.570 63.711 67.851 8929 A/model = 221507778.734 X2 1) 951537.6 2) 1045137.6 3) 1138737.6 4) 1232937.6 5) 1352937.6 2145257.28 30.62 35.62 40.62 45.62 50.62 0.516 1.556 1.556 1.556 1.556 49.730 55.409 63.187 70.000 78.000 18720 30,287.4 B/model = 220688459.1 Profit margin = 819319.634 The cycle time for wash hand bowls is 35.5 seconds. The company is using 8-hours per day, quantity produced in a month = 60 × 60 × 8/35.5 × 1.5556 × 24 = 30287.4 Units Selling price per month = Quantity/month X Unit price Selling price per month = 30287.4 × 70.83 = N 2, 145257.284 Substituting the selling price back into the profit state- ment for the month of February, 2005: when the unit volume for wash hand bowls V = 18,720, S/month = N 1325937.6 yielding total sales of N 230,453,059 N Sales; 230453059.9 Less Variable cost; 9078450.85 Total contribution 221374,609.1 Less fixed costs; 686,150 Profit 2220688459.1 Using the optimum quantity or volume of wash hand bowls V = 30287.4 Units and selling price of N 2, 145257.284, N Sales: 231272379.584 Less variable cost: 9078450.8 5 Total contribution: 222193928.734 Less fixed costs: 686,150 Profit: 221507778.734 From the results obtained after simulating the equa- tions of the × linear programming using simplex method, the value of the objective function, which was the profit foregone was 47.150445528799 and the optimal propor- tions of the products to be produced using injection molding machine, based on their contribution to profits are: X1, proportion of water jugs to be produced = 0.8280 X2, proportion of wash hand bowls to be produced = 0.5159 X3, proportion of big bowls to be produced = 0.0 X4, proportion of packer to be produced = 0.0 X5, proportion of hanger to be produced = 0.0 Summary of the results present the net profit for water jug and wash hand bowl are presented in Table 3. 4. Conclusions Since the maximum time the company used was 8 hours per day, and the cycle time for water jugs and wash hand bowls are 36 units and 35.5 units, then the optimum number of the two products to be produced per day will now be, 966.15 units for water jugs and 1572.457 units for wash hand bowls. The profit margin obtained was N 25062868.41 per month [2,8]. This is a clear justification why the company needs to emphasize the production of water jugs and wash hand  M. ABBA-AJI ET AL. 142 bowls as regard to injection molding machine. Further- more, sensitivity analysis, using shadow price, revealed that the price of wash hand bowls is critical to the net benefit (profit) of the company. When the proposed unit selling price N 60.5 is used for wash hand bowls, opti- mum quantity of 30287 units will be produced yielding a maximum net benefit of N 819, 319.634 per month. The company needs reconsider the price of wash hand bowls as regard to injection molding machine, and also concen- trates on the other products being considered in this analysis in order to improve their selling prices, taking into cognizance, the quality of the products, customer requirements and customer affordability. In this paper, sophisticated cost model that requires the use of design parameters to provide design alternatives can be carried out. Apart from the time constraint considered in this work, temperature is another constraint that affects the produc- tion of plastics. Further research can then be carried out when temperature constraints from blow film molding and extrusion units of the industry were obtained. The procurement of raw materials is a major challenge facing plastic industries in Nigeria. The government should encourage petrochemical industries producing plastic raw materials, like the one in Port Harcourt, to be in full production. That will reduce cost of importing raw materials from abroad. Also the foreign raw materials have a very low melting point compared to the one pro- duced in Nigeria. This is not pleasant for molding proc- ess. Finally, it is strongly recommend that Nigerian indus- tries should adopt the modern operation research tech- niques so that they can obtain optimum results and make proper decisions. REFERENCES [1] A. Ibhadode, “Introduction to Manufacturing Technol- ogy,” AMBIK Publishers, Lagos, 2001, pp. 92-95. [2] A. Aji, et al., “Development of a Product Production Rate Optimization Model: A Case Study of BOPLAS Plastic Industry,” Continental Journal of Engineering Sciences, Vol. 4, 2009, pp. 26-31. [3] R. Hussey, “Cost and Management Accounting,” P, (app. C3-C22), 1989. [4] J. Krawjewski, “Operations Management; Strategy and Analysis,” Addison-Wesley Publishing Company, Can- ada, 1987, pp. 118-125. [5] R. Costenoble, “Simplex Method of Solving General Linear Programming Problems”. www.Zweigmedia.com/third Edsite/index.htm [6] K. Crow, “Archiving Target Cost/Design to Cost Objec- tives,”2001. www.ndp-solutions.com/dtc.htm [7] K. Crow, “Design for Manufacturability”. www.ndp-solutions.com/dfm.htm [8] C. Frederic, “Cost and Optimization Engineering,” Mc- Graw Hill Publishing Company, New York, 1985. Copyright © 2013 SciRes. OJEE |