Paper Menu >>
Journal Menu >>
 J. Biomedical Science and Engineering, 2009, 2, 117-122 Published Online April 2009 in SciRes. http://www.scirp.org/journal/jbise JBiSE Prediction of mutation position, mutated amino acid and timing in hemagglutinins from North America H1 influenza A virus Shao-Min Yan1, Guang Wu2* 1Guangxi Academy of Sciences, 98 Daling Road, Nanning, Province Guangxi 530007, China. 2DreamSciTech Consulting, 301, Building 12, Nanyou A-zone, Jiannan Road, Shenzhen, Province Guangdong 518054, China. Correspondence should be addressed to Guang Wu (hongguanglishibahao@yahoo.com) Received Jan. 8th, 2009; revised Feb. 9th; 2009; accepted Feb. 10th, 2009 ABSTRACT This study was trying to predict the mutations in H1 hemagglutinins of influenza A virus from North America including the predictions of mu- tation position, the predictions of would-be- mutated amino acids and the predictions of time of occurrence of mutations. The results paved a possible way for accurate, precise and reliable prediction of mutation in proteins from influenza A virus. Keywords: Hemagglutinin, Influenza, Mutation, Neural Network, Prediction 1. INTRODUCTION Mathematical modelling provides a promising hope to predict the mutation in proteins from influenza A virus, not only because the history shows that accurate, precise and reliable predictions are mainly based on mathemati- cal modelling, but also the prediction of mutations at protein can be classified as prediction of mutation posi- tion, prediction of mutated amino acid and timing of mu- tation [1]. All these require the use of more sophisticated mathematical tools. Perhaps, the best way to predict the mutation is to find its cause, thus a mutation could occur if the same cause appears again. However, the causes, which led to his- torical mutations, might not leave any sign to trace, and the evolved proteins from influenza A virus may no longer be sensitive to the causes, which led to mutations in the past. All these mean that the mutation causes would be poor predictors for prediction of mutations, while the preparedness for possible pandemic/epidemic of influenza would lag behind the appearance of influ- enza without prediction. On the other hand, no matter what mutation cause is, any cause would leave signs in a protein, otherwise, no mutation would be recorded. These signs can be arguably used for prediction. This is the basic consideration for prediction of mutations using modelling. Generally, the amino acids in a protein is represented as alphabet, thus a number of models use amino-acid symbols as operating units, for example, sequence align- ment, phylogenetics, and multi-sequence comparison, by which the history of proteins of interests can be traced [2,3]. Unfortunately, these symbol-based approaches cannot accurately and precisely answer the predictions proposed, because they cannot operate in sophisticated mathematical models, whose operating units are values. In this view, the protein science actually is at the his- torical phase of searching for the ways to represent a protein sequence as a numeric sequence, and it is hoped that the numeric sequence is sensitive to mutations, posi- tions of amino acids in protein sequence, composition of protein sequence, length of protein sequence, neighbour- ing amino acids. In fact, currently there are several ways to transfer a protein sequence into a numeric sequence, and the most profound one would be the use of the physicochemical property to represent a protein sequence [4] as well as related approaches [5-10]. On the other hand, other approaches are also devel- oped, for example, the approaches based on random mechanism to quantify each amino acid in a protein as well as a protein in whole [1]. This study was designed to predict the mutation posi- tions, the mutated amino acids and the time of occur- rence of mutations in the hemagglutinins from North America H1 influenza A viruses using neural network, because the hemagglutinin is the major surface antigen of influenza viruses, against which neutralizing antibod- ies are elicited during virus infection and vaccination [11- 15]. Among various types, the H1 influenza virus is the cause for several historical disasters, such as 1918 Spanish flu, 1977 Russian flu, 1950 and 1988 epidemics [16-18]. 2. MATERIALS AND METHODS The amino acid sequences and corresponding RNA se- quences of 494 hemagglutinins from North America in- fluenza A/H1 viruses isolated from 1918 to 2008 were obtained from the influenza virus resources [19]. Forty- SciRes Copyright © 2009  118 S. M. Yan et al. / J. Biomedical Science and Engineering 2 (2009) 117-122 SciRes Copyright © 2009 JBiSE six identical hemagglutinins were excluded, thus the re- maining 448 hemagglutinins were used in this study. 2.1 Amino-Acid Pair Predictability According to the permutation [1, 20, 21], for example, there are 47 asparagines “N” and 37 valines “V” in the hemagglutinin, strain A/swine/Ontario/53518/03(H1N1), accession number DQ280219, the frequency of amino- acid pair NV is 3 (47/566×37/565×565=3.072), that is, NV would appear three times in this hemagglutinin. Ac- tually 3 NVs can be found in this hemagglutinin, so NV is predictable and the difference between its predicted and actual frequency is 0. Again, there are 48 leucines “L” in DQ280219 hemagglutinin, and the frequency of random presence of LL is 4 (48/566×47/565× 565=3.986), i.e. there would be four LLs in the hemag- glutinin. But LL appears nine times in reality, so the dif- ference between its predicted and actual frequency is -5. After such calculations [22], each amino-acid pair had its difference between predicted and actual frequency. As a point mutation is relevant to a single amino acid, which connects with two neighbouring amino acids except for the terminal one and constructs two amino- acid pairs, so each amino acid has the sum of differ- ence between predicted and actual frequency in two neighbouring amino-acid pairs, which is the first quantification for each amino acid in a hemagglutinin. Nevertheless, any hemagglutinin must have a certain amount of predictable amino-acid pairs, by which the percentage of how many amino-acid pairs predictable can be found. This predictable portion is the quantifi- cation for a whole hemagglutinin. 2.2 Amino-Acid Distribution Probability According to the occupancy of subpopulations and parti- tions, the positions of any type of amino acids in hemag- glutinin can be viewed as a certain distribution [10, 23- 31], whose probability is r nn n rrr r qqq r− × ××× × ××× !...!! ! !...!! ! 2110 [32], where r is the number of amino acids, n is the num- ber of partitions, rn is the number of amino acids in the n- th partition, qn is the number of partitions with the same number of amino acids, and ! is the factorial function. For instance, there are 36 lysines “K” in DQ280219 hemagglutinin. Their predicted and actual distribution probabilities are 0.0419 and 0.0020 [33], so the ratio of predicted versus actual distribution probabilities is 20.95, whose natural logarithm is 3.0421, which is the second quantification for each amino acid in a hemagglutinin. 2.3 Future Composition of Amino Acids The relationship between 64 RNA codons and translated amino acids is governed by translation probability [1, 34-36], based on which the amino acid mutating prob- ability can be determined. For example, alanine “A” has the 12/36 chance of mutating to “A”, but cysteine “C” has no chance of mutating to “A”, then both aspartic acid “D” and glutamic acid “E” have the 2/18 chance of mutating to “A”, and so on. In total, the future composi- tion of amino acid “A” is 6.1271% in DQ280219 he- magglutinin, whereas its current composition is only 5.1146% (29/567), and the ratio is 1.1980 (6.1271% /5.1146%), thus the future composition of amino acids is got [1], and assigned the ratio of predicted versus actual compositions to each amino acid [37], which is the third quantification for each amino acid in hemagglutinin [1]. Although there are countless mutation causes impact- ing a parent protein, these causes should leave their traces in the protein, which should be measured out us- ing these three quantifications, which in fact represent the countless mutation causes. 2.4 Prediction of Mutation Position Any mutation cause can lead to occurrence or non- occurrence of mutation, which can be classified as unity and zero after comparing a parent protein with its daugh- ter protein. In this way, the occurrence or non- occurrence of mutation in a parent protein becomes a binary sequence. Thus, two datasets can be got, the mu- tation cause dataset, which are three quantifications, and the mutation consequence dataset, which is a binary se- quence. Moreover, these two datasets have the position-to- position relationship (Table 1), which is the cause- mutation relationship. Mathematically this relationship is the problem of classification, which can be solved either using the logistic regression in statistics or neural net- work. The feed forward backpropagation neural network Table 1. Inputs and target of DQ280219 hemagglutinin sequence. Quantified hemagglutinin sequence Position Amino acid I II III Mutation se- quence 1 M -2 0.0000 1.2569 0 … … … … … … 276 R -2 1.2809 1.9392 0 277 G -1 2.3790 0.7887 0 278 H 0 0.0000 1.2396 1 279 G 0 2.3790 0.7887 1 280 S 1 4.0008 1.1081 0 … … … … … … 566 I -2 1.1285 0. 9590 0  S. M. YAN et al. / J. Biomedical Science and Engineering 2 (2009) 117-122 119 Published Online April 2009 in SciRes. http://www.scirp.org/journal/jbise JBiSE would be applied to this relationship to predict the muta- tion position. 2.5 Prediction of would-be-mutated Amino Acid The prediction was made using the amino-acid mutating probability, which was based on the relationship be- tween RNA codons and translated amino acids [1]. 2.6 Timing of Mutation As each hemagglutinin is different one from another due to mutation, each hemagglutinin would be quantified differently one from another. Along the time axis, all hemagglutinins would construct their evolutionary proc- ess, and the timing of the mutation would be possible by detailed analysis of this evolutionary process. 2.7 Software and Statistics The MatLab software [38] was used for prediction. The prediction sensitivity, specificity and total correct rate were calculated according to the published method [39]. 3. RESULTS AND DISCUSSION The performance of modelling was measured using the pre- diction sensitivity (42.9%±31.4%), specificity (99.5% ±0.4%) and total correct rate (99.0%±0.4%), because the predicted mutation positions can be classified as the posi- tives, false positives, negatives and false negatives when comparing the predicted with the actual mutation positions. As seen, the prediction sensitivity was still low although the prediction specificity and total correct rate were quite high. After the prediction of possible mutation positions us- ing the neural network, the would-be-mutated amino ac- ids at predicted positions can be predicted using the amino-acid mutating probability [1]. Figure 1 illustrates the prediction of possible mutation positions and mu- tated amino acids at the predicted positions, where the solid line in the lower panel is the predicted mutation probability by the neural network with respect to each amino acid in ABX58602 hemagglutinin and the dotted line is the cut-off mutation probability of 0.5, that is, the amino acid whose mutation probability is larger than 0.5 risks mutation. For this hemagglutinin, there were two positions (98 and 507) whose mutation probability was larger than 0.5, so the amino acid E at these positions would have a larger chance of mutation. Meanwhile, the would-be-mutated amino acid can be determined using the amino-acid mutating probability (upper panel), where the amino acid “D” has the largest chance to ap- pear. So the lower panel indicates the possible mutation positions with probability, and the upper panel displays the would-be-mutated amino acids with probability. Figure 2 displays the evolution of North America H1 hemagglutinins. This predictable portion fluctuated over time, which represented the mutation process. With fast Fourier transform, which is suitable to find the periodic- ity in chaotic dataset, the mutation periodicity can be found from Figure 2, where (i) the evolutionary process of influenza A virus hemagglutinins from 1978 to 2008 contained many periodicities; (ii) each periodicity sug- gested different number of mutations along the time course; (iii) the periodicity with the biggest number of mutations was about 5.6 years, thus the time when muta- tions would occur in future can be estimated; and (iv) the hemagglutinin periodicity provides the chance to trace the possible mutation cause in nature, because each periodicity may correspond to a natural phenomenon. Figure 1. Prediction of mutation positions and would-be-mutated amino acids. On the lower panel: the x-axis represents the position of ABX58602 hemagglutinin from 1 to 565, because ABX58602 hemagglutinin is composed of 565 amino acids; the y-axis represents the mutation probability predicted using neural network model, where there are two probabilities larger than 0.5 at positions 98 and 507. On the upper panel, the centre of pie is labelled as “E” glutamic acid, which is the amino acid at positions 98 and 507 of ABX58602 hemag- glutinin. The other letters represent the would-be-mutated amino acids, and the area occupied by letter represents the probability to mu- tate to this amino acid based on the amino-acid mutating probability, for example, “E” has the largest chance to mutate to “D”. Position of ABX58602 hemagglutinin 050100150 200 250 300 350 400 450500 550 Mutation probability 0.0 .2 .4 .6 .8 1.0 Would-be-mutated amino acids with probability D A G K QV Stop E Would-be-mutated amino acids with probability Position of ABX58602 hemagglutinin Mutation probability K QV G E A D Stop  120 S. M. Yan et al. / J. Biomedical Science and Engineering 2 (2009) 117-122 SciRes Copyright © 2009 JBiSE Year 1918 1927 1936 1945 1954 1963 1973 1982 1991 2000 2009 Predictable portion of amino-acid pairs (%) 30 33 36 39 42 45 30 33 36 39 42 45 Hemagglutinin Pandemic Epidemic Pandemic scares Figure 2. Evolution of 448 hemagglutinins of North America H1 influenza viruses. The data are presented as mean±SD. The dotted lines are regressed lines 95% confidence intervals. Figure 3. Stratification of hemagglutinin evolution after finding the periodicity using fast Fourier transform. Furthermore, an attempt was made to time the muta- tion by stratifying the hemagglutinin evolution in Fig- ure. 2 according to its periodicity, and Figure 3 shows such an example, where the hemagglutinin evolution in Figure 2 is stratified according to 6-year periodicity be- cause it was the periodicity with biggest number of mu- tations. Figure 3 shows that there would be a 2-year stable period before possible more mutations would occur in 2010. At this stage of development, it is yet to verify the predictions made in this study. However, this is not un- common phenomenon in science, because the first step is to find a way to transfer the measurements into the domain, where a mathematical model can be applied, the second step is build a model, and the third step is to make the predictions. These three steps are more related to theoretical work. Thereafter the last step would be the verification experimentally, which is certainly beyond the scope of this paper. On the other hand, the science advances so much, it is impossible to verity each hy- pothesis and prediction, for example, the humans cannot create another earth without global warming to compare the effects on subjects of interests. With respect to the predictions in this study, the verifications can be done by using the same method in man-made mutations in indus- trial enzymes, where each mutation can be recorded and compared with prediction. 40 38 36 34 32 30 Predictable portion (%) From 1976 From 1981 From 1987 From 1992 From 1999 From 2005 Year 0123456 Predictable portion (%) 30 32 34 36 38 40 From 1976 From 1981 From 1987 From 1992 From 1999 From 2005 We are here in 2008. 0 1 2 3 4 5 6 Year 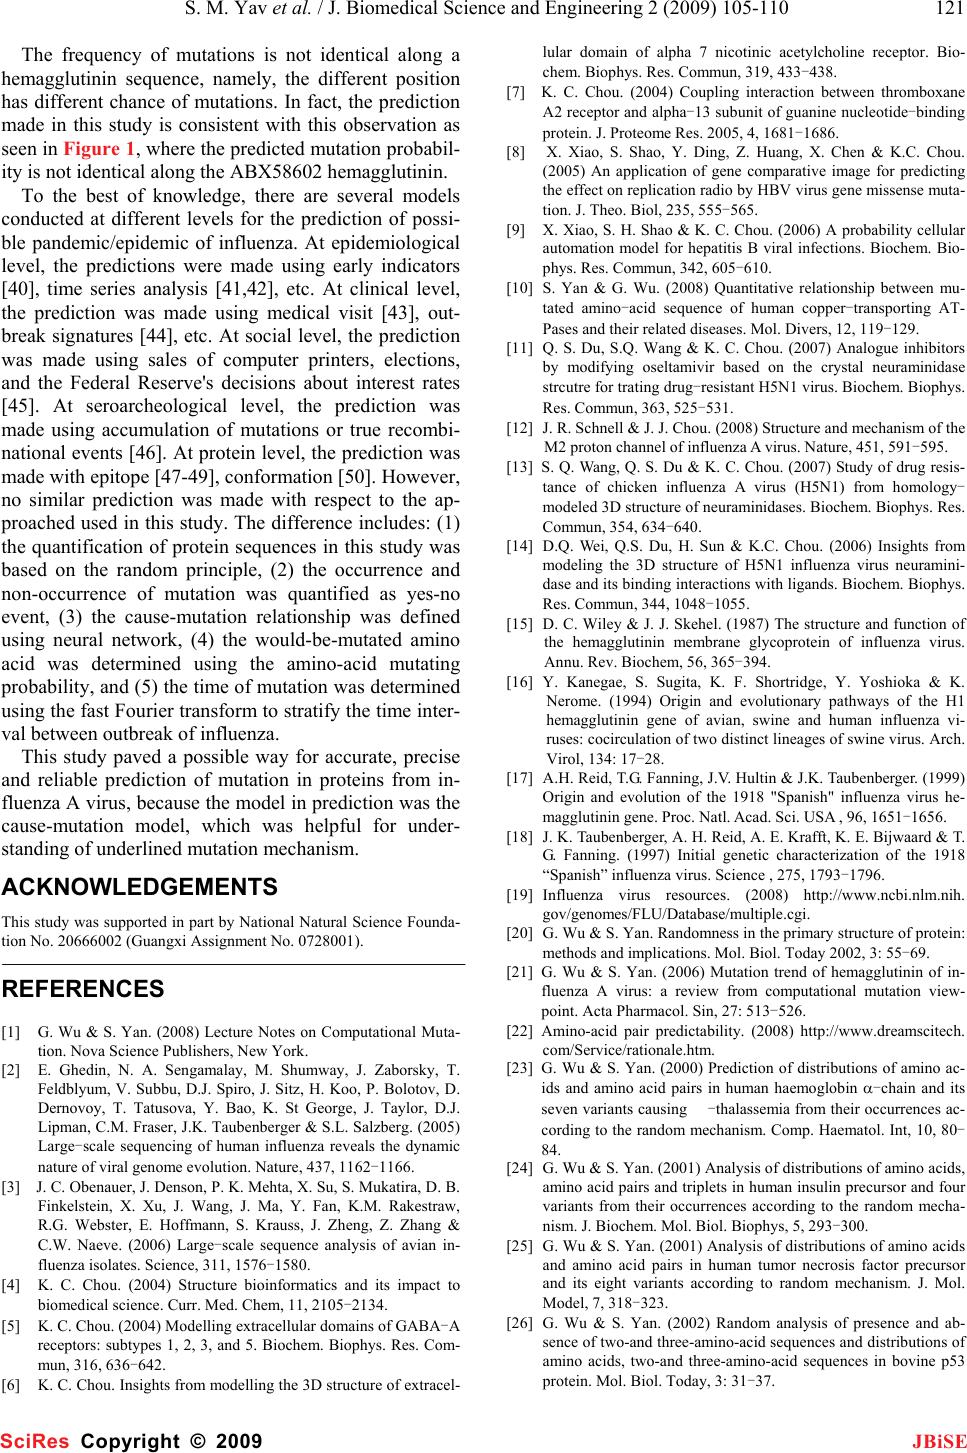 S. M. Yav et al. / J. Biomedical Science and Engineering 2 (2009) 105-110 121 SciRes Copyright © 2009 JBiSE The frequency of mutations is not identical along a hemagglutinin sequence, namely, the different position has different chance of mutations. In fact, the prediction made in this study is consistent with this observation as seen in Figure 1, where the predicted mutation probabil- ity is not identical along the ABX58602 hemagglutinin. To the best of knowledge, there are several models conducted at different levels for the prediction of possi- ble pandemic/epidemic of influenza. At epidemiological level, the predictions were made using early indicators [40], time series analysis [41,42], etc. At clinical level, the prediction was made using medical visit [43], out- break signatures [44], etc. At social level, the prediction was made using sales of computer printers, elections, and the Federal Reserve's decisions about interest rates [45]. At seroarcheological level, the prediction was made using accumulation of mutations or true recombi- national events [46]. At protein level, the prediction was made with epitope [47-49], conformation [50]. However, no similar prediction was made with respect to the ap- proached used in this study. The difference includes: (1) the quantification of protein sequences in this study was based on the random principle, (2) the occurrence and non-occurrence of mutation was quantified as yes-no event, (3) the cause-mutation relationship was defined using neural network, (4) the would-be-mutated amino acid was determined using the amino-acid mutating probability, and (5) the time of mutation was determined using the fast Fourier transform to stratify the time inter- val between outbreak of influenza. This study paved a possible way for accurate, precise and reliable prediction of mutation in proteins from in- fluenza A virus, because the model in prediction was the cause-mutation model, which was helpful for under- standing of underlined mutation mechanism. ACKNOWLEDGEMENTS This study was supported in part by National Natural Science Founda- tion No. 20666002 (Guangxi Assignment No. 0728001). REFERENCES [1] G. Wu & S. Yan. (2008) Lecture Notes on Computational Muta- tion. Nova Science Publishers, New York. [2] E. Ghedin, N. A. Sengamalay, M. Shumway, J. Zaborsky, T. Feldblyum, V. Subbu, D.J. Spiro, J. Sitz, H. Koo, P. Bolotov, D. Dernovoy, T. Tatusova, Y. Bao, K. St George, J. Taylor, D.J. Lipman, C.M. Fraser, J.K. Taubenberger & S.L. Salzberg. (2005) Large-scale sequencing of human influenza reveals the dynamic nature of viral genome evolution. Nature, 437, 1162-1166. [3] J. C. Obenauer, J. Denson, P. K. Mehta, X. Su, S. Mukatira, D. B. Finkelstein, X. Xu, J. Wang, J. Ma, Y. Fan, K.M. Rakestraw, R.G. Webster, E. Hoffmann, S. Krauss, J. Zheng, Z. Zhang & C.W. Naeve. (2006) Large-scale sequence analysis of avian in- fluenza isolates. Science, 311, 1576-1580. [4] K. C. Chou. (2004) Structure bioinformatics and its impact to biomedical science. Curr. Med. Chem, 11, 2105-2134. [5] K. C. Chou. (2004) Modelling extracellular domains of GABA-A receptors: subtypes 1, 2, 3, and 5. Biochem. Biophys. Res. Com- mun, 316, 636-642. [6] K. C. Chou. Insights from modelling the 3D structure of extracel- lular domain of alpha 7 nicotinic acetylcholine receptor. Bio- chem. Biophys. Res. Commun, 319, 433-438. [7] K. C. Chou. (2004) Coupling interaction between thromboxane A2 receptor and alpha-13 subunit of guanine nucleotide-binding protein. J. Proteome Res. 2005, 4, 1681-1686. [8] X. Xiao, S. Shao, Y. Ding, Z. Huang, X. Chen & K.C. Chou. (2005) An application of gene comparative image for predicting the effect on replication radio by HBV virus gene missense muta- tion. J. Theo. Biol, 235, 555-565. [9] X. Xiao, S. H. Shao & K. C. Chou. (2006) A probability cellular automation model for hepatitis B viral infections. Biochem. Bio- phys. Res. Commun, 342, 605-610. [10] S. Yan & G. Wu. (2008) Quantitative relationship between mu- tated amino-acid sequence of human copper-transporting AT- Pases and their related diseases. Mol. Divers, 12, 119-129. [11] Q. S. Du, S.Q. Wang & K. C. Chou. (2007) Analogue inhibitors by modifying oseltamivir based on the crystal neuraminidase strcutre for trating drug-resistant H5N1 virus. Biochem. Biophys. Res. Commun, 363, 525-531. [12] J. R. Schnell & J. J. Chou. (2008) Structure and mechanism of the M2 proton channel of influenza A virus. Nature, 451, 591-595. [13] S. Q. Wang, Q. S. Du & K. C. Chou. (2007) Study of drug resis- tance of chicken influenza A virus (H5N1) from homology- modeled 3D structure of neuraminidases. Biochem. Biophys. Res. Commun, 354, 634-640. [14] D.Q. Wei, Q.S. Du, H. Sun & K.C. Chou. (2006) Insights from modeling the 3D structure of H5N1 influenza virus neuramini- dase and its binding interactions with ligands. Biochem. Biophys. Res. Commun, 344, 1048-1055. [15] D. C. Wiley & J. J. Skehel. (1987) The structure and function of the hemagglutinin membrane glycoprotein of influenza virus. Annu. Rev. Biochem, 56, 365-394. [16] Y. Kanegae, S. Sugita, K. F. Shortridge, Y. Yoshioka & K. Nerome. (1994) Origin and evolutionary pathways of the H1 hemagglutinin gene of avian, swine and human influenza vi- ruses: cocirculation of two distinct lineages of swine virus. Arch. Virol, 134: 17-28. [17] A.H. Reid, T.G. Fanning, J.V. Hultin & J.K. Taubenberger. (1999) Origin and evolution of the 1918 "Spanish" influenza virus he- magglutinin gene. Proc. Natl. Acad. Sci. USA , 96, 1651-1656. [18] J. K. Taubenberger, A. H. Reid, A. E. Krafft, K. E. Bijwaard & T. G. Fanning. (1997) Initial genetic characterization of the 1918 “Spanish” influenza virus. Science , 275, 1793-1796. [19] Influenza virus resources. (2008) http://www.ncbi.nlm.nih. gov/genomes/FLU/Database/multiple.cgi. [20] G. Wu & S. Yan. Randomness in the primary structure of protein: methods and implications. Mol. Biol. Today 2002, 3: 55-69. [21] G. Wu & S. Yan. (2006) Mutation trend of hemagglutinin of in- fluenza A virus: a review from computational mutation view- point. Acta Pharmacol. Sin, 27: 513-526. [22] Amino-acid pair predictability. (2008) http://www.dreamscitech. com/Service/rationale.htm. [23] G. Wu & S. Yan. (2000) Prediction of distributions of amino ac- ids and amino acid pairs in human haemoglobin α-chain and its seven variants causing -thalassemia from their occurrences ac- cording to the random mechanism. Comp. Haematol. Int, 10, 80- 84. [24] G. Wu & S. Yan. (2001) Analysis of distributions of amino acids, amino acid pairs and triplets in human insulin precursor and four variants from their occurrences according to the random mecha- nism. J. Biochem. Mol. Biol. Biophys, 5, 293-300. [25] G. Wu & S. Yan. (2001) Analysis of distributions of amino acids and amino acid pairs in human tumor necrosis factor precursor and its eight variants according to random mechanism. J. Mol. Model, 7, 318-323. [26] G. Wu & S. Yan. (2002) Random analysis of presence and ab- sence of two-and three-amino-acid sequences and distributions of amino acids, two-and three-amino-acid sequences in bovine p53 protein. Mol. Biol. Today, 3: 31-37.  122 S. M. Yan et al. / J. Biomedical Science and Engineering 2 (2009) 117-122 SciRes Copyright © 2009 JBiSE [27] G. Wu & S. Yan. (2002) Analysis of distributions of amino acids in the primary structure of apoptosis regulator Bcl-2 family ac- cording to the random mechanism. J. Biochem. Mol. Biol. Bio- phys, 6, 407-414. [28] G. Wu & S. Yan. (2002) Analysis of distributions of amino acids in the primary structure of tumor suppressor p53 family according to the random mechanism. J. Mol. Model, 8, 191-198. [29] G. Wu & S. Yan. (2004) Determination of sensitive positions to mutations in human p53 protein. Biochem. Biophys. Res. Com- mun, 321, 313-319. [30] G. Wu & S. Yan. (2005) Searching of main cause leading to se- vere influenza A virus mutations and consequently to influenza pandemics/epidemics. Am. J. Infect. Dis., 1, 116-123. [31] G. Wu & S. Yan. (2005) Prediction of mutation trend in hemag- glutinins and neuraminidases from influenza A viruses by means of cross-impact analysis. Biochem. Biophys. Res. Commun., 326, 475-482. [32] W. Feller. (1968) An Introduction to Probability Theory and Its Applications. 3rd ed, Vol, I. Wiley, New York, p. 34-40. [33] Amino-acid distribution probability. (2008) http://www.dream- scitech. com/Service/timing.htm. [34] G. Wu & S. Yan. (2005) Determination of mutation trend in pro- teins by means of translation probability between RNA codes and mutated amino acids. Biochem. Biophys. Res. Commun, 337, 692-700. [35] G. Wu & S. Yan. (2006) Determination of mutation trend in he- magglutinins by means of translation probability between RNA codons and mutated amino acids. Protein Pept. Lett, 13, 601-609. [36] G. Wu & S. Yan. (2007) Translation probability between RNA codons and translated amino acids, and its applications to protein mutations. In: Leading-Edge Messenger RNA Research Commu- nications. ed. Ostrovskiy M. H. Nova Science Publishers, New York, Chapter 3, 47-65. [37] Amino-acid mutating probability. (2008). http://www.dream- scitech. com/Service/lag.htm. [38] MathWorks Inc. (2001) MatLab-The Language of Technical Computing (version 6.1.0.450, release 12.1), 1984-2001. [39] Systat Software Inc. Systat for Windows, version 11.00.01. 2004. [40] E. Andersson, S. Kühlmann-Berenzon, A. Linde, L. Schiöler, S. Rubinova & M. Frisén. (2008) Predictions by early indicators of the time and height of the peaks of yearly influenza outbreaks in Sweden. Scand. J. Public Health, 36, 475-482. [41] Y. T. Li, H. W. Zhang, H. Ren, J. Chen & Y. Wang. (2007) Appli- cation of time series analysis in the prediction of incidence trend of influenza-like illness in Shanghai. Zhonghua Yu Fang Yi Xue Za Zhi, 41, 496-498. [42] J. Saltyte Benth & D. Hofoss. (2008) Modelling and prediction of weekly incidence of influenza A specimens in England and Wales. Epidemiol. Infect, 136, 1658-1666. [43] R. Sebastian, D. M. Skowronski, M. Chong, J. Dhaliwal & J. S. Brownstein. (2008) Age-related trends in the timeliness and pre- diction of medical visits, hospitalizations and deaths due to pneumonia and influenza, British Columbia, Canada, 1998-2004. Vaccine, 4, 1397-1403. [44] P. F. Craigmile, N. Kim, S. A. Fernandez & B. K. Bonsu. (2007) Modeling and detection of respiratory-related outbreak signa- tures. BMC Med. Inform. Decis. Mak, 7: 28. [45] P. M. Polgreen, F. D. Nelson & G. R. Neumann. (2007) Use of prediction markets to forecast infectious disease activity. Clin. In- fect. Dis, 44: 272-279. [46] R. G. Webster. (1997) Predictions for future human influenza pandemics. J. Infect. Dis, 176 (Suppl 1): S14-S19.A. Suhrbier, C. Schmidt & A. Fernan. (1993) Prediction of an HLA B8-restricted influenza epitope by motif. Immunology, 79, 171-173. [47] A. Suhrbier, C. Schmidt & A. Fernan. Prediction of an HLA B8- restricted influenza epitope by motif. Immunology. 1993, 79: 171- 173. [48] P. Somvanshi, V Singh & P. K. Seth. (2008) Prediction of epi- topes in hemagglutinin and neuraminidase proteins of influenza A virus H5N1 strain: a clue for diagnostic and vaccine develop- ment. OMICS, 12, 61-69. [49] P. Gogolák, A. Simon, A. Horváth, B. Réthi, I. Simon, K. Berkics, E. Rajnavölgyi & G.K. Tóth. (2000) Mapping of a protective helper T cell epitope of human influenza A virus hemagglutinin. Biochem. Biophys. Res. Commun, 270: 190-198. [50] M. Young, K. Kirshenbaum, K. A. Dill & S. Highsmith. (1999) Predicting conformational switches in proteins. Protein Sci, 8, 1752-1764. |