Determination of Interaction between NFκB p50 and β-IFN-κB Binding Oligo Using AlphaLISA in HTP Fashion 175
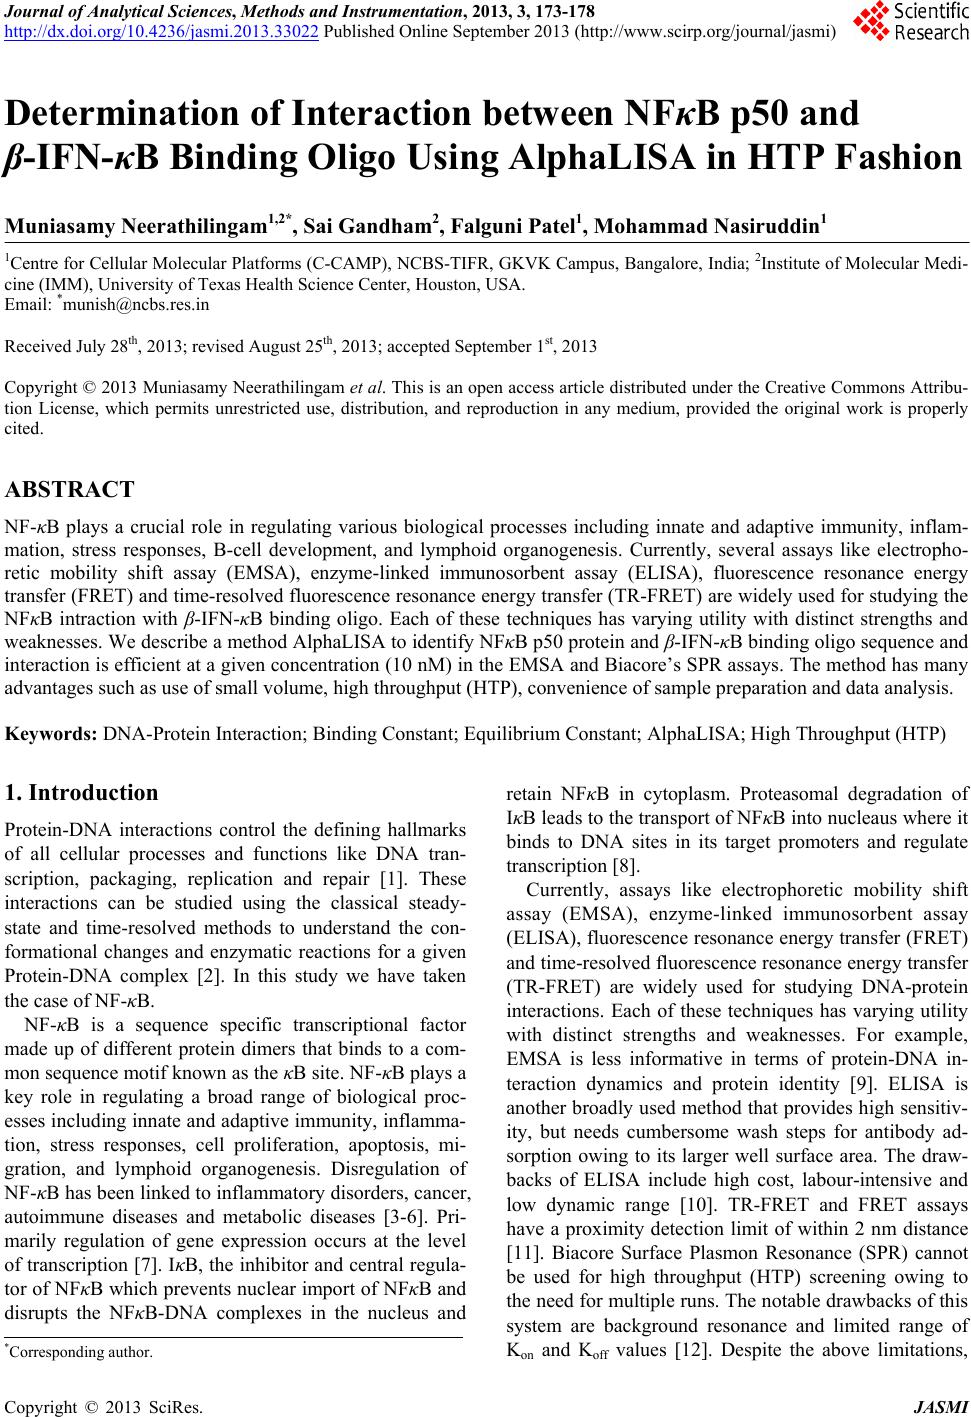
increasing concentration of both oligo and protein (Fig-
ure 1(a)) with highest intensity of signal observed at the
highest concentration (10 nM) of protein and oligo used.
Further, 384-well microplate was employed to down size
the volume and increase the throughput, as well as vali-
date the results of 96-well format and determine the
hooking point. At the hook point, the association and the
dissociation of the target molecule with either donor or
acceptor beads is equal, hence a maximum signal is de-
tected (Figure 1(b)). The amount of beads (~1015) used
is significantly less than the amount of protein/DNA used
and also in the right ratio so that all the protein and DNA
are bound to the beads and no free protein/DNA is pre-
sent in solution. This happens only when the protein/
DNA is below 10 nM concentrations and at any concen-
tration above this, we observed significant decrease in
signal because the free protein/DNA that remains in so-
lution binds to their respective bead bound partners,
causing loss of signal (acceptor and donor beads are not
brought together) and hence causing the hook effect. The
saturation curve showed a gradual decline in signal
counts after 10 nM of concentration. Hence, the binding
for NF-κB p50 protein and β-IFN-κB binding sequence
oligo occurs below 10 nM. The “hook effect” is common
in ELISA assay that refers to measured levels of antigen
displaying a significantly lower absorbance than the ac-
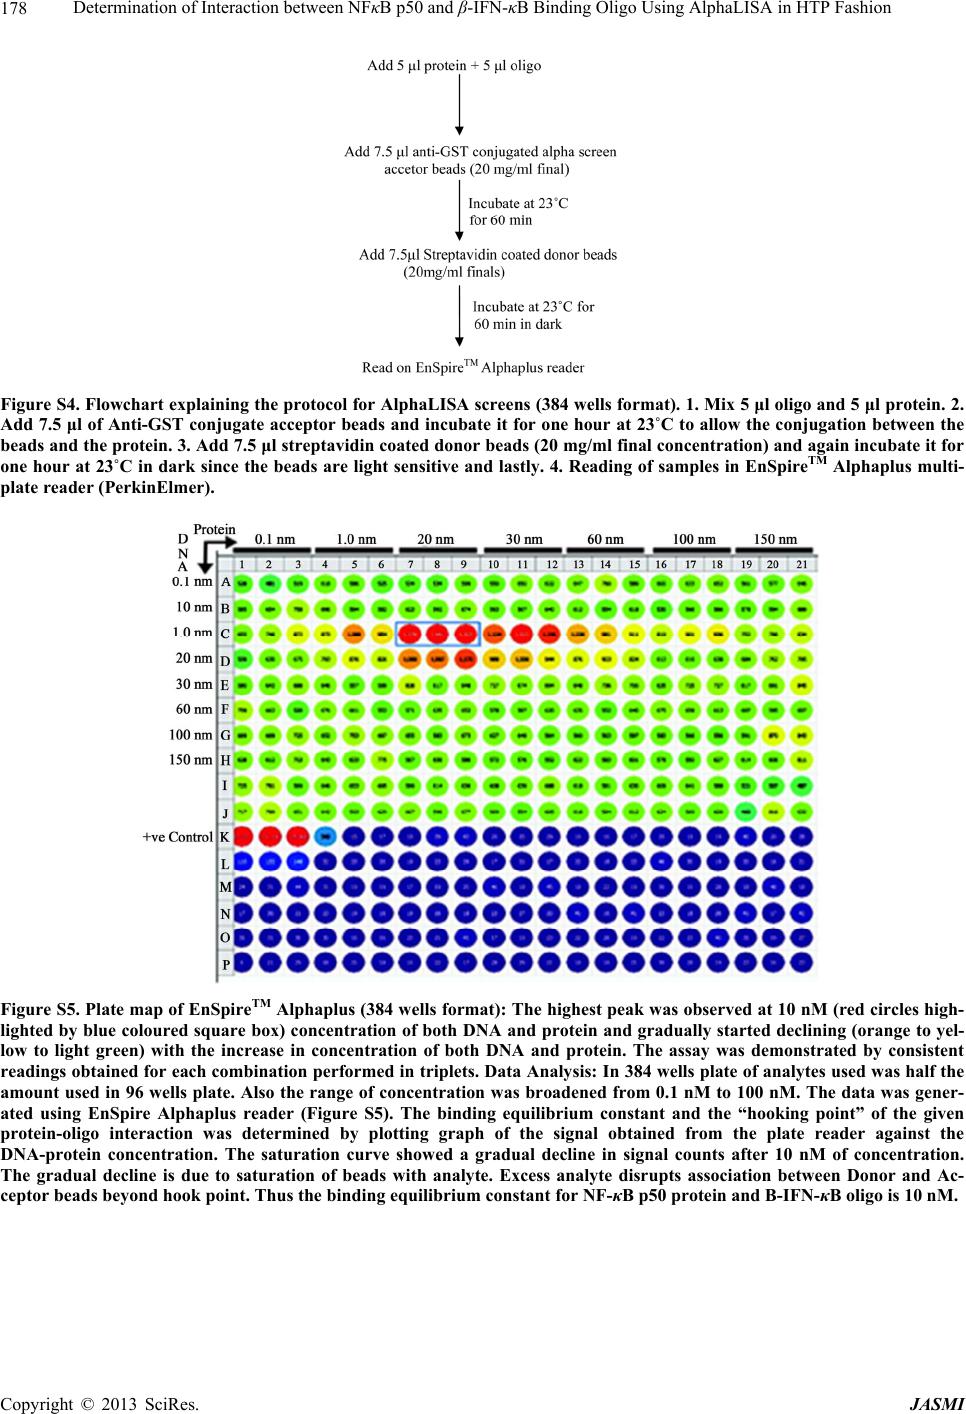
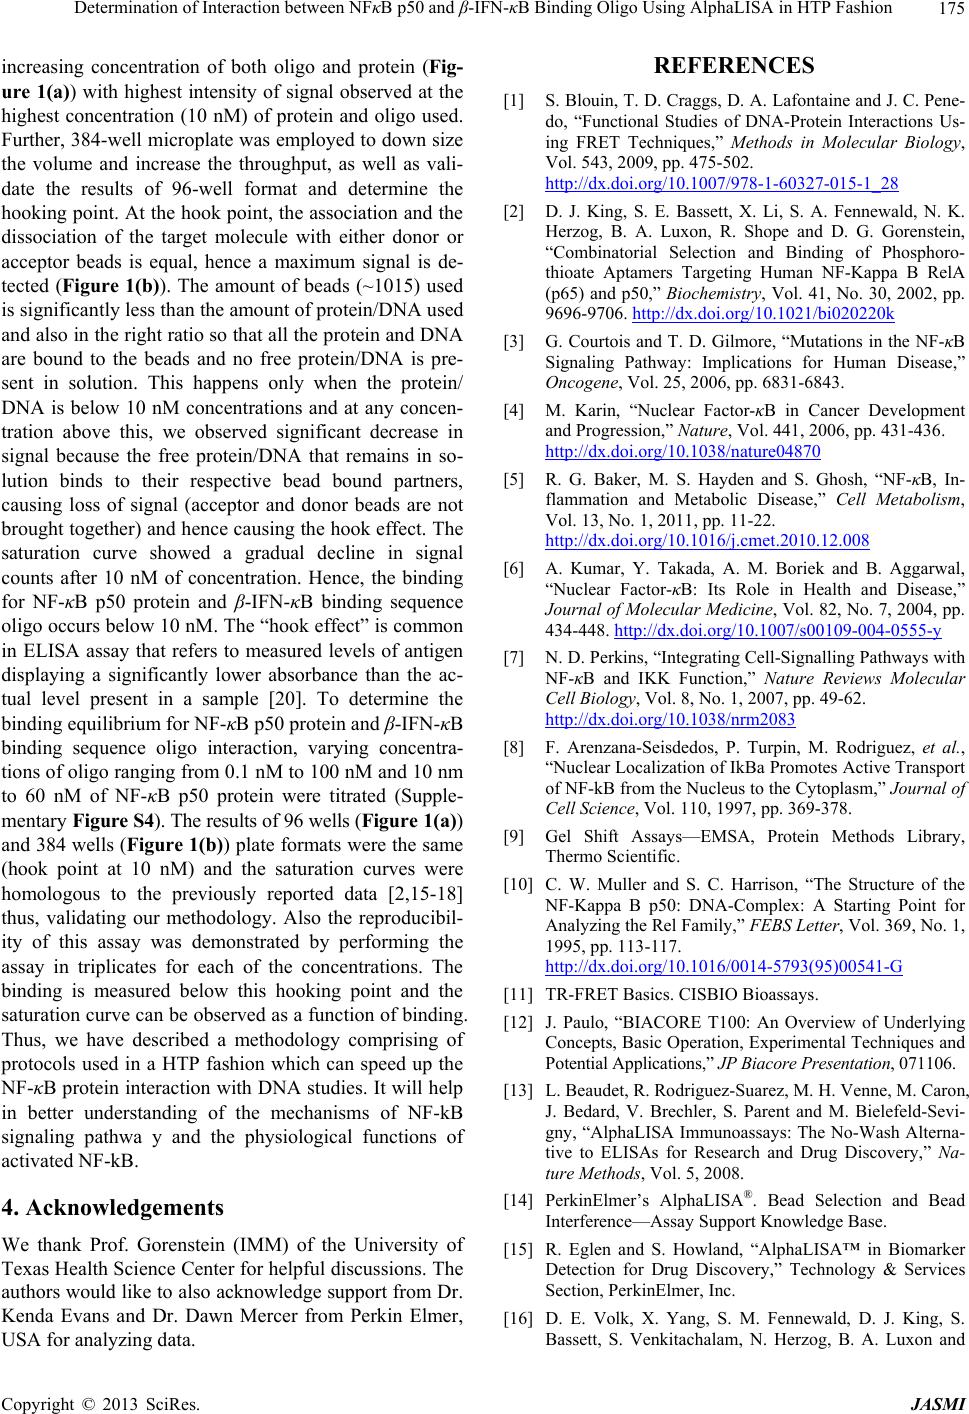
tual level present in a sample [20]. To determine the
binding equilibrium for NF-κB p50 protein and β-IFN-κB
binding sequence oligo interaction, varying concentra-
tions of oligo ranging from 0.1 nM to 100 nM and 10 nm
to 60 nM of NF-κB p50 protein were titrated (Supple-
mentary Figure S4). The results of 96 wells (Figure 1(a))
and 384 wells (Figure 1(b)) plate formats were the same
(hook point at 10 nM) and the saturation curves were
homologous to the previously reported data [2,15-18]
thus, validating our methodology. Also the reproducibil-
ity of this assay was demonstrated by performing the
assay in triplicates for each of the concentrations. The
binding is measured below this hooking point and the
saturation curve can be observed as a function of binding.
Thus, we have described a methodology comprising of
protocols used in a HTP fashion which can speed up the
NF-κB protein interaction with DNA studies. It will help
in better understanding of the mechanisms of NF-kB
signaling pathwa y and the physiological functions of
activated NF-kB.
4. Acknowledgements
We thank Prof. Gorenstein (IMM) of the University of
Texas Health Science Center for helpful discussions. The
authors would like to also acknowledge support from Dr.
Kenda Evans and Dr. Dawn Mercer from Perkin Elmer,
USA for analyzing data.
REFERENCES
[1] S. Blouin, T. D. Craggs, D. A. Lafontaine and J. C. Pene-
do, “Functional Studies of DNA-Protein Interactions Us-
ing FRET Techniques,” Methods in Molecular Biology,
Vol. 543, 2009, pp. 475-502.
http://dx.doi.org/10.1007/978-1-60327-015-1_28
[2] D. J. King, S. E. Bassett, X. Li, S. A. Fennewald, N. K.
Herzog, B. A. Luxon, R. Shope and D. G. Gorenstein,
“Combinatorial Selection and Binding of Phosphoro-
thioate Aptamers Targeting Human NF-Kappa B RelA
(p65) and p50,” Biochemistry, Vol. 41, No. 30, 2002, pp.
9696-9706. http://dx.doi.org/10.1021/bi020220k
[3] G. Courtois and T. D. Gilmore, “Mutations in the NF-κB
Signaling Pathway: Implications for Human Disease,”
Oncogene, Vol. 25, 2006, pp. 6831-6843.
[4] M. Karin, “Nuclear Factor-κB in Cancer Development
and Progression,” Nature, Vol. 441, 2006, pp. 431-436.
http://dx.doi.org/10.1038/nature04870
[5] R. G. Baker, M. S. Hayden and S. Ghosh, “NF-κB, In-
flammation and Metabolic Disease,” Cell Metabolism,
Vol. 13, No. 1, 2011, pp. 11-22.
http://dx.doi.org/10.1016/j.cmet.2010.12.008
[6] A. Kumar, Y. Takada, A. M. Boriek and B. Aggarwal,
“Nuclear Factor-κB: Its Role in Health and Disease,”
Journal of Molecular Medicine, Vol. 82, No. 7, 2004, pp.
434-448. http://dx.doi.org/10.1007/s00109-004-0555-y
[7] N. D. Perkins, “Integrating Cell-Signalling Pathways with
NF-κB and IKK Function,” Nature Reviews Molecular
Cell Biology, Vol. 8, No. 1, 2007, pp. 49-62.
http://dx.doi.org/10.1038/nrm2083
[8] F. Arenzana-Seisdedos, P. Turpin, M. Rodriguez, et al.,
“Nuclear Localization of IkBa Promotes Active Transport
of NF-kB from the Nucleus to the Cytoplasm,” Journal of
Cell Science, Vol. 110, 1997, pp. 369-378.
[9] Gel Shift Assays—EMSA, Protein Methods Library,
Thermo Scientific.
[10] C. W. Muller and S. C. Harrison, “The Structure of the
NF-Kappa B p50: DNA-Complex: A Starting Point for
Analyzing the Rel Family,” FEBS Letter, Vol. 369, No. 1,
1995, pp. 113-117.
http://dx.doi.org/10.1016/0014-5793(95)00541-G
[11] TR-FRET Basics. CISBIO Bioassays.
[12] J. Paulo, “BIACORE T100: An Overview of Underlying
Concepts, Basic Operation, Experimental Techniques and
Potential Applications,” JP Biacore Presentation, 071106.
[13] L. Beaudet, R. Rodriguez-Suarez, M. H. Venne, M. Caron,
J. Bedard, V. Brechler, S. Parent and M. Bielefeld-Sevi-
gny, “AlphaLISA Immunoassays: The No-Wash Alterna-
tive to ELISAs for Research and Drug Discovery,” Na-
ture Methods, Vol. 5, 2008.
[14] PerkinElmer’s AlphaLISA®. Bead Selection and Bead
Interference—Assay Support Knowledge Base.
[15] R. Eglen and S. Howland, “AlphaLISA™ in Biomarker
Detection for Drug Discovery,” Technology & Services
Section, PerkinElmer, Inc.
[16] D. E. Volk, X. Yang, S. M. Fennewald, D. J. King, S.
Bassett, S. Venkitachalam, N. Herzog, B. A. Luxon and
Copyright © 2013 SciRes. JASMI