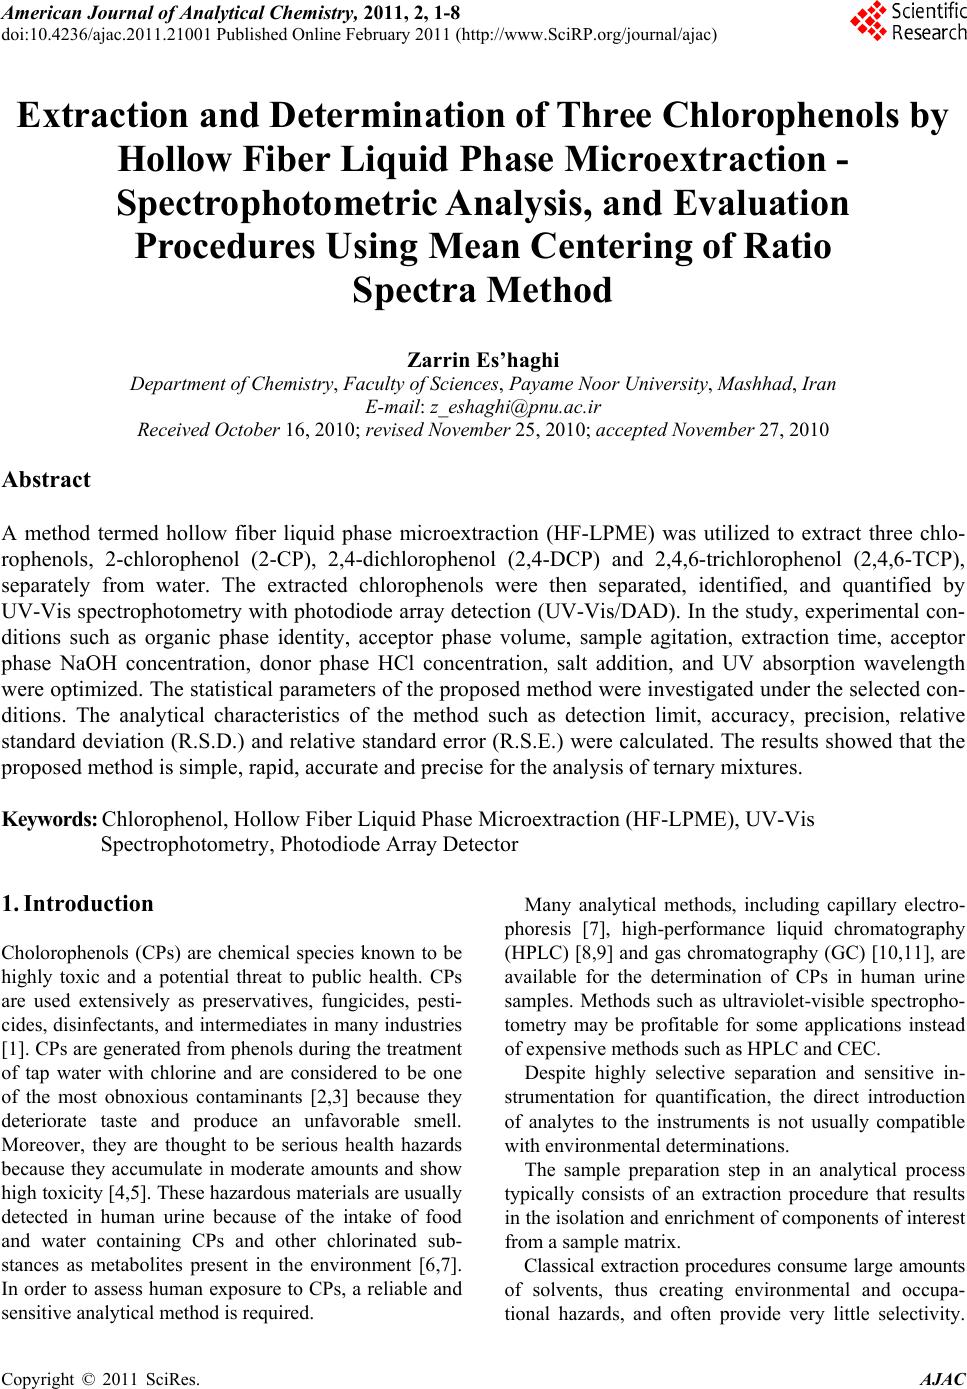
 American Journal of Analyt ical Chemistry, 2011, 2, 1-8 doi:10.4236/ajac.2011.21001 Published Online February 2011 (http://www.SciRP.org/journal/ajac) Copyright © 2011 SciRes. AJAC Extraction and Determination of Three Chlorophenols by Hollow Fiber Liquid Phase Micr oextraction - Spectrophotometric Analysis, and Evaluation Procedures Using Mean Centering of Ratio Spectra Method Zarrin Es’haghi Department of C hemi st ry , Faculty of Sciences, Payame Noor University, Mashhad, Iran E-mail: z_eshaghi@pnu.ac.ir Received October 16, 2010; revised November 25, 2010; accepted November 27, 2010 Abstract A method termed hollow fiber liquid phase microextraction (HF-LPME) was utilized to extract three chlo- rophenols, 2-chlorophenol (2-CP), 2,4-dichlorophenol (2,4-DCP) and 2,4,6-trichlorophenol (2,4,6-TCP), separately from water. The extracted chlorophenols were then separated, identified, and quantified by UV-Vis spectrophotometry with photodiode array detection (UV-Vis/DAD). In the study, experimental con- ditions such as organic phase identity, acceptor phase volume, sample agitation, extraction time, acceptor phase NaOH concentration, donor phase HCl concentration, salt addition, and UV absorption wavelength were optimized. The statistical parameters of the proposed method were investigated under the selected con- ditions. The analytical characteristics of the method such as detection limit, accuracy, precision, relative standard deviation (R.S.D.) and relative standard error (R.S.E.) were calculated. The results showed that the proposed method is simple, rapid, accurate and precise for the analysis of ternary mixtures. Keywords: Chlorophenol, Hollow Fiber Liquid Phase Microextraction (HF-LPME), UV-Vis Spectrophotometry, Photodiode Array Detector 1. Introduction Cholorophenols (CPs) are chemical species known to be highly toxic and a potential threat to public health. CPs are used extensively as preservatives, fungicides, pesti- cides, disinfectants, and intermediates in many industries [1]. CPs are generated from phenols during the treatment of tap water with chlorine and are considered to be one of the most obnoxious contaminants [2,3] because they deteriorate taste and produce an unfavorable smell. Moreover, they are thought to be serious health hazards because they accumulate in moderate amounts and show high toxicity [4,5]. These hazardous materials are usually detected in human urine because of the intake of food and water containing CPs and other chlorinated sub- stances as metabolites present in the environment [6,7]. In order to assess human exposure to CPs, a reliable and sensitive analytical method is required. Many analytical methods, including capillary electro- phoresis [7], high-performance liquid chromatography (HPLC) [8,9] and gas chromatography (GC) [10,11], are available for the determination of CPs in human urine samples. Methods such as ultraviolet-visible spectropho- tometry may be profitable for some applications instead of expensive methods such as HPLC and CEC. Despite highly selective separation and sensitive in- strumentation for quantification, the direct introduction of analytes to the instruments is not usually compatible with environmental determinations. The sample preparation step in an analytical process typically consists of an extraction procedure that results in the isolation and enrich ment of components of interest from a sample matrix. Classical extraction procedures consume large amounts of solvents, thus creating environmental and occupa- tional hazards, and often provide very little selectivity.  2 Z. ES’HAGHI These results emphasize the need for reduction of solvent use, automation, and miniaturization. Microextraction techniques are the result of looking for the miniaturization of classical extraction techniques in order to expend minimum analysis time and chemicals [12]. In recent years, efforts have been made towards the miniaturization of the traditional liqu id–liquid extraction. These techniques, based on the contact between two im- miscible liquids, fall into two main categories, namely single-drop microextraction (SDME) [13,14] and hollow fiber liquid phase microextraction (HF-LPME) [15,16]. Hollow fiber liquid-phase microextraction (HF-LPME) was introduced by Pedersen-Bjergaard and Rasmussen to improve the stability and reliability of single drop liq- uid-phase microextraction (LPME). In this microextrac- tion technique, a water-immiscible organic solvent was immobilized in the pores of a porous hollow fiber, and formed a supported liquid membrane. The lumen of the hollow fiber was filled with mi- cro-liter amounts of an acceptor phase. The analytes were extracted from the aqueous donor phase into the organic solvent, and then captured into the acceptor phase. After extraction, the extracted phase was directly introduced to the analytical instruments [15]. Three phase HF has been applied to the determinatio n of CPs in this research. 2. Experimental Section 2.1. Reagents and Samples 2-Chlorophenol (2-CP), 2,4-dichlorophenol (2,4-DCP) and 2,4,6-trichlorophenol (2,4,6-TCP) were purchased from Sigma-Aldrich GmbH (Steinheim, Germany). Me- thanol and acetone and the other solvents used for this study were of HPLC grade. 1-Octanol was purchased from Merck, Darmestadth, Germany. Stock solutions o f the chloroph enols were prepared by dissolving each chlorophenol in methanol to obtain 100 mg·mL-1 solutions. Aliquots of these stock solutions were diluted with water to prepare standard working so- lutions at a concentration of 100 ng/mL. All the other reagents and solvents used were of analytical reagent grade. A Q3/2 Accurel polypropylene hollow fiber mem- brane (600 µm i.d., 200 µm wall thickness, 0.2 µm pore size) was purchased from Membrana GmbH (Wuppertal, Germany). The hollow fiber was cut into 4.0 cm seg- ments, cleaned with acetone, and dried before use. De-ionized water was purified in a Milli-Q water puri- fication system (Millipore, Bedford, MA, USA). Field samples, a reservoir and a tap water sample, were col- lected from Mashhad, Iran. 2.2. Extraction Process and Initial Conditions A 14-mL aqueous solution (0.1 M HCl) containing all analytes at concentrations of 100 ng/mL each and a 1 cm stir bar were placed in a 16-mL sample vial previously loaded with 1 g of NaCl. The solution was stirred at 1000 rpm for 2 min to dissolve the NaCl. Acceptor solution (12.5 µL, 0.1 M NaOH) was withdrawn into the micro- syringe. The needle tip of the microsyringe was then inserted into the 5.0 cm hollow fiber, and the fiber was filled with the acceptor phase. Before that, the fiber pores were impregnated with organic solvent. After impregna- tion, excess organic solvent was carefully removed from the lumen of the fiber. Then, the fiber was moved to the aqueous sample solution. The magnetic stirrer was set at a speed of 500 rpm. The setup arrangement is illustrated in Figure 1. After extracting for 40 min, the stirrer was stopped. All acceptor phase (about 12 µL) was with- drawn back into the microsyringe. Finally, the acceptor phase was injected into a UV-Vis cell and then was di- luted to 2.0 mL with acceptor phase solution and intro- duced into the spectrophotometer for further analysis. 3. Results and Discussion In this experiment, the chlorophenols were extracted from an acidified donor phase (sample solution) into an organic phase, which impregnated the pores of a hollow fiber. The chlorophenols were then converted into chlo- rophenolate anion by extracting the chlorophenols from the organic phase into an alkaline acceptor phase (en- riched extract). The extracted analytes were then quanti- fied by UV-Vi s spectrophotometer/DAD. 3.1. Optimization of Variables The microextraction conditions for the three chlorophe- Figure 1 . Hollow fiber liquid phase microextraction appa- ratus. Copyright © 2011 SciRes. AJAC  Z. ES’HAGHI 3 nols must be optimized. In this purpose the univariant method was conducted to pursue the optimal experimen- tal conditions for the microextraction procedure. Ana- lytical parameters, including organic phase identity, ac- ceptor phase volume, stirring rate, extraction time, ac- ceptor phase NaOH concen tration, donor ph ase HCl con- centration, and salt addition were investigated and iden- tified to improve efficiency. The conditions for LLLME are as follows: 14 mL of 6.0 M HCl, 1.5 g of NaCl(s) as the donor phase, 15 µL of 0.1 M NaOH as the acceptor phase, 1,2,4-trichlorobenzene/1-octanol (70/30) as the organic phase, 900 rpm stirring speed, and 45 min ex- traction time. 3.2. Selection of Organic Solvent The selection principles for a suitable organic solvent are as follows: First, the solvent should be easily immobi- lized in the pores of the polypropylene hollow fiber. Even more important is that the solvent must be of low volatility and immiscible with water. Most important of all, the solubility’s of the analytes in the organic solvent must be higher than in the donor phase. Some proper organic solvents were examined for extracting chloro- phenols. Accordingly, o-xylene (OX), p-xylene (PX), octanol (OC), and 1,2,4-trichlorobenzene (TCB) were tested. The results shown in Figure 2 indicate how ex- traction efficiencies were achieved with these aromatic solvents. Two xylenes with non-polar functional groups showed acceptable extraction ability, presumably by forming induced dipoles by ring-electrons. Trichlorobenzene also has high extraction efficiency because the molecular structure of tri-chlorobenzene is very similar to those of the chlorophenols, except that the low polarity of tri- chloro benzene is such as to cause low extraction effi- ciencies for monochlorophenols. To improve extraction for all the chlorophenols, extractions utilizing various solvent mixtures (v/v = 1/1) were tested. As trial results indicated, the extractions of toxic polychlorophenols were more effective with trichlorobenzene, but 1-octanol was completely compatible with the polypropylene hol- low fiber and thus use of solvent mixtures achieves better reproducibility and precision. Therefore 1,2,4-trichloro- benzene/octanol (70/30) was selected as the optimal or- ganic phase. 3.3. Effect of Extraction Time LLLME is dependent on equilibrium rather than exhaus- tive extraction [17]. The results obviously indicate that adequate time must be allowed for the system to reach equilibrium in the partitioning of analytes between the donor and acceptor phases (see Figure 3). However, when considering matching the extraction time with the dura- tion of spectroscopic analysis, an extraction period of 45 min was chosen for subsequent extractions. 3.4. Effect of Acceptor Phase Volume The acceptor phase was a basic solution (0.1 M NaOH). Generally, in the three-phase LLLME systems, a smaller volume of acceptor phase involves a higher analyte con- centration (or enrichment) in the acceptor phase [18]. However, the important factor for LLLME is not con- centration, but the total mass of the analytes in the ac- ceptor phase. Accordingly, the acceptor phase should be of large volume to promote analyte transport to the ac- ceptor phase. The acceptor phase volume was examined over the range of 7 - 17 µL. As trial results indicated, 15.0 µL of acceptor phase provided superior operation and this volume was used for subsequent extractions. 3.5. Effect of the Donor Phase PH on the Extraction To extract the chlorophenol, a weak acid, into the organic Figure 2 . Effect of organic solvent on the extraction proce- dure. Figure 3. Effect of extraction time on the method efficiency. Copyright © 2011 SciRes. AJAC  4 Z. ES’HAGHI phase from the donor phase, the pH of the donor phase was acidified to convert the analytes into their molecular (i.e., uncharged) form [19]. As trial results indicated, the extraction efficiencies of the chlorophenols varied slightly with HCl(aq) concen- tration of the donor phase from 0.01 M to 0.5 M. The pKa values of the chlorophenols studied range from 6.23 to 8.49. Theoretically, a pH value of the donor phase of 4.0 would be sufficiently acidic. In order to deal with potential matrix interference in real field samples, HCl solution with pH = 3 was used. 3.6. Effect of Acceptor Phase PH on the Extraction Chlorophenols are weakly acidic in character, so the ac- ceptor solution must be sufficiently alkaline to convert them to the ionic form in order to extract them from the organic phase. On examining NaOH(aq) concentrations from 0.01 M to 1 M, the results indicate that 0.05 M NaOH(aq) is satisfactory. Nevertheless, it is not of suffi- ciently high alkalinity for the extraction of real field samples. Many contaminants could be extracted into the acceptor phase from a real field sample matrix; these contaminants could neutralize the basicity of the acceptor phase. Because of this, 0.1 M NaOH(aq) was selected as the acceptor phase. 3.7. Effect of Agitation Speed Agitation of the donor solution reduces the required ex- traction time and increases extraction efficiency. Stirring provides fresh donor solution for the organic phase to extract and reduces the effect of the stationary boundary layer zone (Nernestian layer) produced close to the or- ganic phase; these factors promote analyte transport from the donor phase to the organic phase [20]. However, agitation in excess of the optimal stirring rate may also cause lower extraction efficiency because the hollow fiber is vibrated by the surrounding turbulent flow and air bubbles reduced absorption for each analyte and a decrease in the precision of the method [21]. To evaluate the effect of stirring, donor solution was extracted at varying stirring rates (300 - 1000 rpm). It was found that the extraction efficiencies of these chloro- phenols increased at higher stirring rates and reached a maximum at 900 rpm. Consequently, 900 rpm was cho- sen for subsequent extractions. 3.8. Effect of Salt Addition Adding salt to the analytes may have contradictory ef- fects. First, one expects a positive effect from salting out when the ionic strength of the donor phase is increased. This is due to the decrease in the solubility of the ana- lytes in the aqueous phase and enhances their partition- ing into the organic phase. Secondly, a negative effect is attributed to changes in the physical properties of the Nernst diffusion film, which results in reducing the rate of diffusion of the analytes from the donor phase into the organic phase. In addition, the salting out phenomenon would also reduce the solubility of organic solvent in water, causing the organic phase to exhaustively wall off the acceptor phase from the donor phase, a quite desir- able result. Therefore, 0.0 - 2.0 g of NaCl(s) was added to 14 mL of the donor phase to determine the effect of salt addition . As the experimental results indicated, the addition of 1.5 g NaCl(s) (9.7%, w/w) of sodium chloride optimally enhanced the extraction of the chlorophenols in water. This quantity of NaCl was therefore used in subsequent experiments. 3.9. Quantitative Aspects Absorbance measurements at the band maxima of the UV spectra obey the linear Beer’s law more accurately than measurements off the band maxima. The UV spec- tra of the analytes can be utilized to identify target ana- lytes in the UV-Vis spectrophotometer. Accordingly, each extracted chlorophenol was quantified at its own maximum adsorption wavelength (as shown in Figure 4). The chlorophenols were determined under selected experimental conditions to assess repeatability, linearity, coefficient of determination, and detection limit. The results are shown in Table 1. Figure 4. UV spectra of the various analytes, obtained with Diod Array Detector (DAD) . Copyright © 2011 SciRes. AJAC  Z. ES’HAGHI Copyright © 2011 SciRes. AJAC 5 Table 1. Method perfor mance. Compound UV Wavelengh (nm) Linear range (ng/mL) R2 LODa (ng/mL) RSD(%)b RSD(%)c 2-CP 197 0.5-100 0.9978 01 7.3 3.8 2,4-DCP 201 nm 0.5-100 0.9991 0.08 3.5 2.7 2,4,6-TCP 204 nm 0.5-100 0.9986 0.09 3.9 2.7 a) LODs are calculated as three times the standard devia tion o f seven replica ted runs o f a mixtur e co ntainin g 0.5 ng · mL -1 each of the co mp oun d; b) Data are based on the absorbance of seven replica ted runs of a mixture contain ing 0.5 ng · mL -1 eac h of the compounds; c) Data is based on the absorbance of seven replicated runs of a mixtur e containi ng 5 ng · mL -1 ea ch of the co mp ound. Linearity was established o ver the concentratio n range of 0.5 - 150 ng/mL. The coefficient of determination r2 varied from 0.9978 to 0.9991. The limit of detection (LOD) values were calculated as three times the standard deviation of seven replicate runs of water spiked with analytes at 1.0 ng/mL each. The relative standard devia- tion (RSD) values were calculated for seven replicate runs, and these values were less than 7.4%. 3.10. Real Sample Analysis Two samples, waste-water (collected from an industrial center near Mashhad, Iran) and tap water (from Mashhad, Iran), were analyzed to demonstrate the practical appli- cability of this technique. These two samples were filtered with a Milli-Q filter- ing system (Millipore), and the tap water sample was overdosed with sodium thiosulfate (80 µg/mL) to neu- tralize residual chlorine or hypochlorite. The analytical results of these samples indicated that th e tap water sam- ple is free from chlorophenols, but a target analyte is present in the waste-water sample. The detected analyte, whose concentration is 0.8 ng/mL, coincides with 2,4,5- trichlorophenol. For recovery, this LLLME method depends on equi- librium rather than exhaustive extraction. Instead of absolute recoveries, relative recoveries de- termined as the ratio of the real field sample outcome to that of the deionized water sample are summarized in Table 2. These results indicate that the relative recover- ies of chloropheno ls from the spiked waste-water and tap water samples (performed in three replicates on 0.5 ng/mL of each compound spiked) were 94.1% - 101.4% and 87.8% - 99.2%, respectively. 3.11. Chemometrics Evaluation of the Method The main problem of spectrophotometric multicompo- nent analysis is the simultaneous determination of two or more compounds in the same mixtures without prelimi- nary separation. Table 2. Relative recovery (%) of practical water samples (N = 3). Compound WasteA water TapB water 2-CP 94.1 99.2 2,4-DCP 99.9 87.8 2,4,6-TCP 101.4 99.0 A) The sample was obtained from an industrial center, Mashhad, Iran; B) The tap water was from Mashhad, Iran. Several spectrophotometric determination methods have been used for resolving mixtures of compounds with overlapping spectra. When these methods are com- pared with each other, the range of application of deriva- tive spectrophotometry is more reliable with respect to utility and sensitivity than normal spectrophotometry. Other spectrophotometric methods, such as partial least squares regression (PLSR), principal component regres- sion (PCR), multi-wavelength linear regression analysis (MLRA), H-point standard addition method (HPSAM) for binary and ternary mixtures have been utilized [22- 25]. Recently, Bahram et al. proposed a new spectropho- tometric method for the simultaneous determination of ternary mixtures, without prior separation steps. This method is called the successive derivative ratio spectra [26,27]. The method is based on the successive deriva- tives of ratio spectra in two steps. The method was evaluated by model data and also by application to the simultaneous spectrophotometric determination of cobalt, nicked and zinc based on their complexes with 1-(2- pyridylazo)2-naphthol in micellar media as experimental data . In our research this new and very simple method was developed for the simultaneous determination of ternary chlorophenols mixtures, with prior separation steps. This method is based on the mean centering of ratio spectra. This method eliminates derivative steps and therefore signal-to-noise ratio is enhanced. 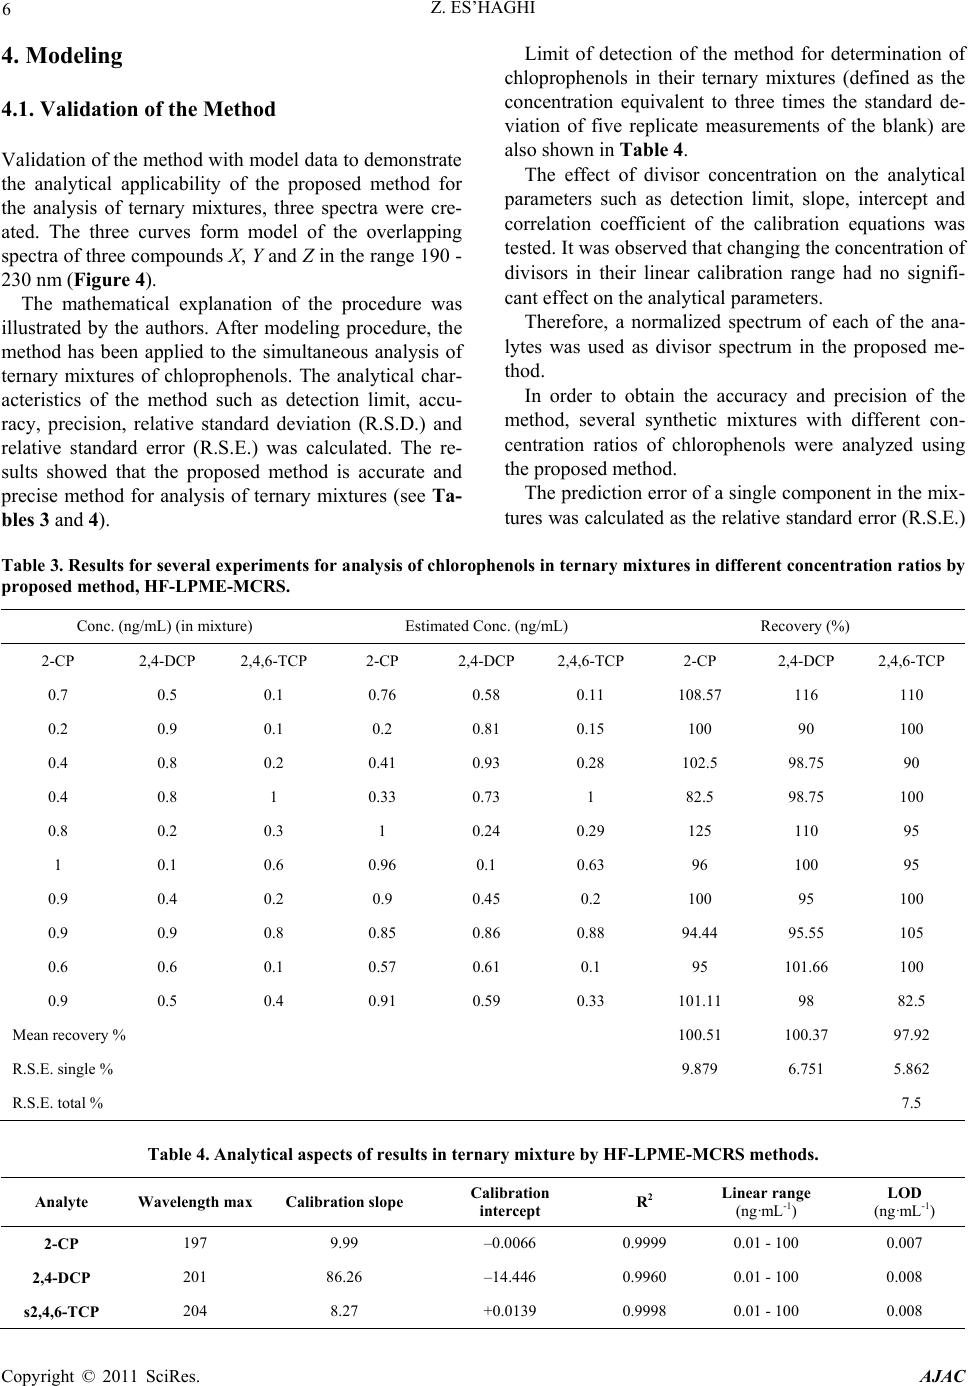 6 Z. ES’HAGHI 4. Modeling 4.1. Validation of the Method Validation of the method with model data to demonstrate the analytical applicability of the proposed method for the analysis of ternary mixtures, three spectra were cre- ated. The three curves form model of the overlapping spectra of three compounds X, Y and Z in the range 190 - 230 nm (Figure 4). The mathematical explanation of the procedure was illustrated by the authors. After modeling procedure, the method has been applied to the simultaneous analysis of ternary mixtures of chloprophenols. The analytical char- acteristics of the method such as detection limit, accu- racy, precision, relative standard deviation (R.S.D.) and relative standard error (R.S.E.) was calculated. The re- sults showed that the proposed method is accurate and precise method for analysis of ternary mixtures (see Ta- bles 3 and 4). Limit of detection of the method for determination of chloprophenols in their ternary mixtures (defined as the concentration equivalent to three times the standard de- viation of five replicate measurements of the blank) are also shown in Table 4. The effect of divisor concentration on the analytical parameters such as detection limit, slope, intercept and correlation coefficient of the calibration equations was tested. It was observed that changing the concentration of divisors in their linear calibration range had no signifi- cant effect on the analytical parameters. Therefore, a normalized spectrum of each of the ana- lytes was used as divisor spectrum in the proposed me- thod. In order to obtain the accuracy and precision of the method, several synthetic mixtures with different con- centration ratios of chlorophenols were analyzed using the proposed method. The prediction error of a single component in the mix- tures was calculated as the relative standard error (R.S.E.) Table 3 . Results for several experiments for analysis of chlorophenols in ternary mixtures in different concentration ratios by proposed method, HF-LPME-MCRS. Conc. (ng/mL) (in mixture) Estimated Conc. (ng/mL) Recovery (%) 2-CP 2,4-DCP 2,4,6-TCP 2-CP 2,4-DCP 2,4,6-TCP 2-CP 2,4-DCP 2,4,6-TCP 0.7 0.5 0.1 0.76 0.58 0.11 108.57 116 110 0.2 0.9 0.1 0.2 0.81 0.15 100 90 100 0.4 0.8 0.2 0.41 0.93 0.28 102.5 98.75 90 0.4 0.8 1 0.33 0.73 1 82.5 98.75 100 0.8 0.2 0.3 1 0.24 0.29 125 110 95 1 0.1 0.6 0.96 0.1 0.63 96 100 95 0.9 0.4 0.2 0.9 0.45 0.2 100 95 100 0.9 0.9 0.8 0.85 0.86 0.88 94.44 95.55 105 0.6 0.6 0.1 0.57 0.61 0.1 95 101.66 100 0.9 0.5 0.4 0.91 0.59 0.33 101.11 98 82.5 Mean recovery % 100.51 100.37 97.92 R.S.E. single % 9.879 6.751 5.862 R.S.E. total % 7.5 Table 4 . Analytical aspects of results in ternary mixture by HF-LPME-MCRS methods. Analyte Wavelength max Calibration slope Calibration intercept R2 Linear range (ng·mL-1) LOD (ng·mL-1) 2-CP 197 9.99 –0.0066 0.9999 0.01 - 100 0.007 2,4-DCP 201 86.26 –14.446 0.9960 0.01 - 100 0.008 s2,4,6-TCP 204 8.27 +0. 0139 0.9998 0.01 - 100 0.008 Copyright © 2011 SciRes. AJAC 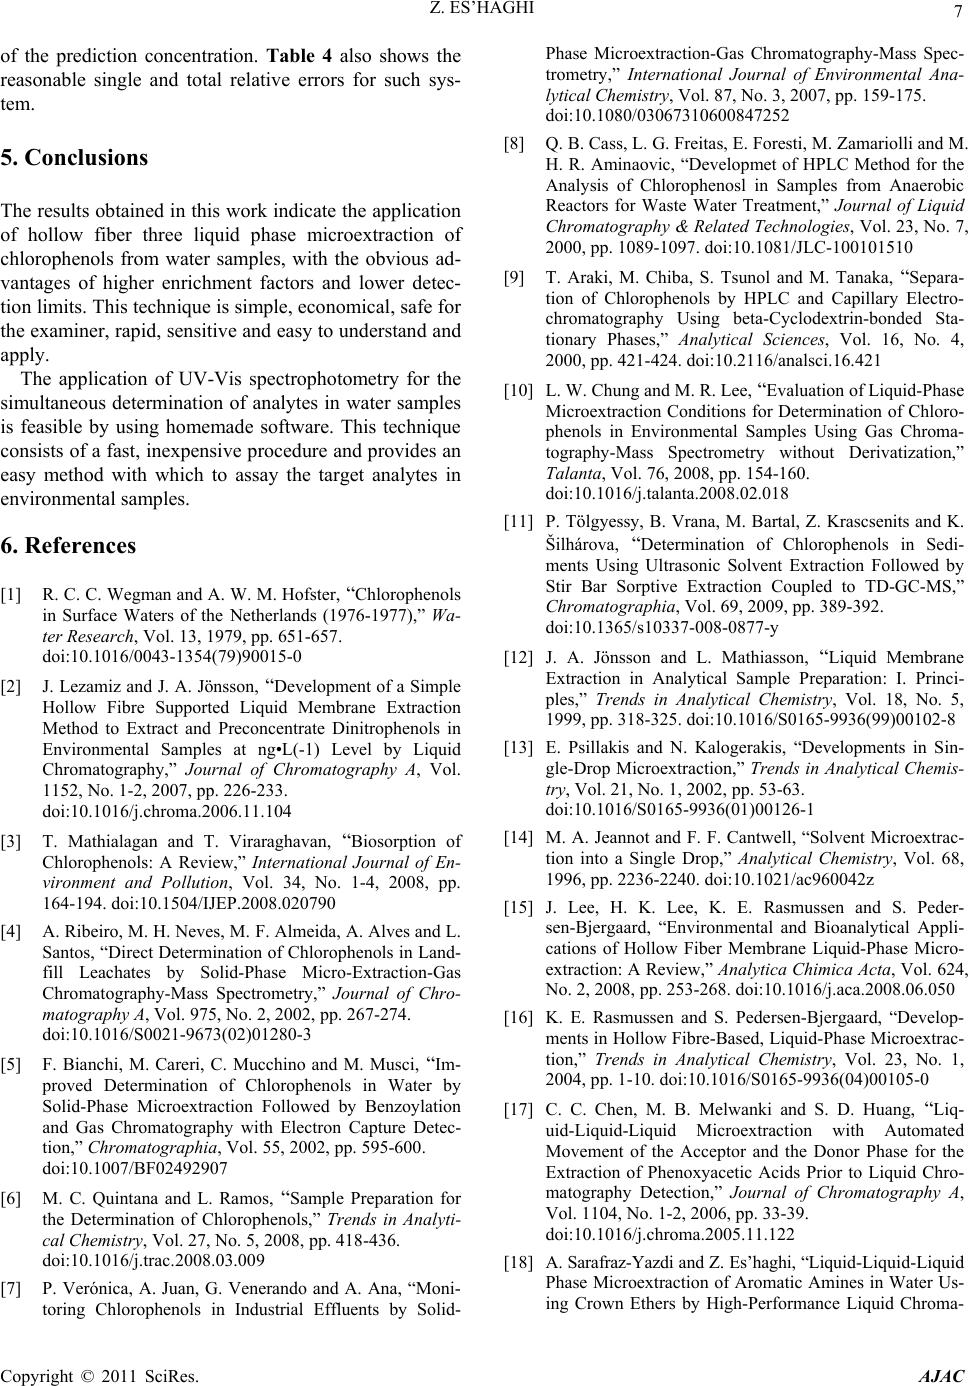 Z. ES’HAGHI Copyright © 2011 SciRes. AJAC 7 of the prediction concentration. Table 4 also shows the reasonable single and total relative errors for such sys- tem. 5. Conclusions The results obtained in this work ind icate the application of hollow fiber three liquid phase microextraction of chlorophenols from water samples, with the obvious ad- vantages of higher enrichment factors and lower detec- tion limits. This technique is simple, economical, safe fo r the examiner, rapid, sensitive and easy to understand and apply. The application of UV-Vis spectrophotometry for the simultaneous determination of analytes in water samples is feasible by using homemade software. This technique consists of a fast, inexpensive proc edure and provides an easy method with which to assay the target analytes in environmental samples. 6. References [1] R. C. C. Wegman and A. W. M. Hofster, “Chlorophenols in Surface Waters of the Netherlands (1976-1977),” Wa- ter Research, Vol. 13, 1979, pp. 651-657. doi:10.1016/0043-1354(79)90015-0 [2] J. Lezamiz and J. A. Jönsson, “Development of a Simple Hollow Fibre Supported Liquid Membrane Extraction Method to Extract and Preconcentrate Dinitrophenols in Environmental Samples at ng•L(-1) Level by Liquid Chromatography,” Journal of Chromatography A, Vol. 1152, No. 1-2, 2007, pp. 226-233. doi:10.1016/j.chroma.2006.11.104 [3] T. Mathialagan and T. Viraraghavan, “Biosorption of Chlorophenols: A Review,” International Journal of En- vironment and Pollution, Vol. 34, No. 1-4, 2008, pp. 164-194. doi:10.1504/IJEP.2008.020790 [4] A. Ribeiro, M. H. Neves, M. F. Almeida, A. Alves and L. Santos, “Direct Determination of Chlorophenols in Land- fill Leachates by Solid-Phase Micro-Extraction-Gas Chromatography-Mass Spectrometry,” Journal of Chro- matography A, Vol. 975, No. 2, 2002, pp. 267-274. doi:10.1016/S0021-9673(02)01280-3 [5] F. Bianchi, M. Careri, C. Mucchino and M. Musci, “Im- proved Determination of Chlorophenols in Water by Solid-Phase Microextraction Followed by Benzoylation and Gas Chromatography with Electron Capture Detec- tion,” Chromatographia, Vol. 55, 2002, pp. 595-600. doi:10.1007/BF02492907 [6] M. C. Quintana and L. Ramos, “Sample Preparation for the Determination of Chlorophenols,” Trends in Analyti- cal Chemistry, Vol. 27, No. 5, 2008, pp. 418-436. doi:10.1016/j.trac.2008.03.009 [7] P. Verónica, A. Juan, G. Venerando and A. Ana, “Moni- toring Chlorophenols in Industrial Effluents by Solid- Phase Microextraction-Gas Chromatography-Mass Spec- trometry,” International Journal of Environmental Ana- lytical Chemistry, Vol. 87, No. 3, 2007, pp. 159-175. doi:10.1080/03067310600847252 [8] Q. B. Cass, L. G. Freitas, E. Foresti, M. Zamariolli and M. H. R. Aminaovic, “Developmet of HPLC Method for the Analysis of Chlorophenosl in Samples from Anaerobic Reactors for Waste Water Treatment,” Journal of Liquid Chromatography & Related Technologies, Vol. 23, No. 7, 2000, pp. 1089-1097. doi:10.1081/JLC-100101510 [9] T. Araki, M. Chiba, S. Tsunol and M. Tanaka, “Separa- tion of Chlorophenols by HPLC and Capillary Electro- chromatography Using beta-Cyclodextrin-bonded Sta- tionary Phases,” Analytical Sciences, Vol. 16, No. 4, 2000, pp. 421-424. doi:10.2116/analsci.16.421 [10] L. W. Chung and M. R. Lee, “Evaluation of Liquid-Phase Microextraction Conditions for Determination of Chloro- phenols in Environmental Samples Using Gas Chroma- tography-Mass Spectrometry without Derivatization,” Talanta, Vol. 76, 2008, pp. 154-160. doi:10.1016/j.talanta.2008.02.018 [11] P. Tölgyessy, B. Vrana, M. Bartal, Z. Krascsenits and K. Šilhárova, “Determination of Chlorophenols in Sedi- ments Using Ultrasonic Solvent Extraction Followed by Stir Bar Sorptive Extraction Coupled to TD-GC-MS,” Chromatographia, Vol. 69, 2009, pp. 389-392. doi:10.1365/s10337-008-0877-y [12] J. A. Jönsson and L. Mathiasson, “Liquid Membrane Extraction in Analytical Sample Preparation: I. Princi- ples,” Trends in Analytical Chemistry, Vol. 18, No. 5, 1999, pp. 318-325. doi:10.1016/S0165-9936(99)00102-8 [13] E. Psillakis and N. Kalogerakis, “Developments in Sin- gle-Drop Microextraction,” Trends in Analytical Chemis- try, Vol. 21, No. 1, 2002, pp. 53-63. doi:10.1016/S0165-9936(01)00126-1 [14] M. A. Jeannot and F. F. Cantwell, “Solvent Microextrac- tion into a Single Drop,” Analytical Chemistry, Vol. 68, 1996, pp. 2236-2240. doi:10.1021/ac960042z [15] J. Lee, H. K. Lee, K. E. Rasmussen and S. Peder- sen-Bjergaard, “Environmental and Bioanalytical Appli- cations of Hollow Fiber Membrane Liquid-Phase Micro- extraction: A Review,” Analytica Chimica A cta, Vol. 624, No. 2, 2008, pp. 253-268. doi:10.1016/j.aca.2008.06.050 [16] K. E. Rasmussen and S. Pedersen-Bjergaard, “Develop- ments in Hollow Fibre-Based, Liquid-Phase Microextrac- tion,” Trends in Analytical Chemistry, Vol. 23, No. 1, 2004, pp. 1-10. doi:10.1016/S0165-9936(04)00105-0 [17] C. C. Chen, M. B. Melwanki and S. D. Huang, “Liq- uid-Liquid-Liquid Microextraction with Automated Movement of the Acceptor and the Donor Phase for the Extraction of Phenoxyacetic Acids Prior to Liquid Chro- matography Detection,” Journal of Chromatography A, Vol. 1104, No. 1-2, 2006, pp. 33-39. doi:10.1016/j.chroma.2005.11.122 [18] A. Sarafraz-Yazdi and Z. Es’haghi, “Liquid-Liquid-Liquid Phase Microextraction of Aromatic Amines in Water Us- ing Crown Ethers by High-Performance Liquid Chroma-  8 Z. ES’HAGHI tography with Monolithic Column,” Talanta, Vol. 66, No. 3, 2005, pp. 664-669. doi:10.1016/j.talanta.2004.12.026 [19] A. Gjelstad, T. M. Andersen, K. E. Rasmussen and S. Pedersen-Bjergaard, “Microextraction across Supported Liquid Membranes Forced by pH Gradients and Electri- cal Fields,” Journal of Chromatography A, Vol. 1157, No. 1-2, 2007, pp. 38-45. doi:10.1016/j.chroma.2007.05.007 [20] W. Xie, J. Pawliszyn, W. M. Mullett and B. K. Matus- zewski, “Comparison of Solid-Phase Microextraction and Liquid-Liquid Extraction in 96-Well Format for the De- termination of a Drug Compound in Human Plasma by Liquid Chromatography with Tandem Mass Spectromet- ric Detection,” Journal of Pharmaceutical and Biomedi- cal Analysis, Vol. 45, No. 4, 2007, pp. 599-608. doi:10.1016/j.jpba.2007.08.029 [21] A. S. Yazdi and Z. Es’haghi, “Two-step Hollow Fiber- Based, Liquid-Phase Microextraction Combined with High-Performance Liquid Chromatography: A New Ap- proach to Determination of Aromatic Amines in Water,” Journal of Chromatography A, Vol. 1082, No. 2, 2005, pp. 136-142. doi:10.1016/j.chroma.2005.05.102 [22] M. Palit, D. Pardasani, A. K. Gupta and D. K. Dubey, “Application of Single Drop Microextraction for Analy- sis of Chemical Warfare Agents and Related Compounds in Water by Gas Chromatography/Mass Spectrometry,” Analytical Chemistry, Vol. 77, 2005, pp. 711-717. doi:10.1021/ac0486948 [23] E. Dinç and F. Onur, “Application of a New Spectropho- tometric Method for the Analysis of a Ternary Mixture Containing Metamizol, Paracetamol and Caffeine in Tab- lets,” Analytica Chimic a Acta, Vol. 359, No. 1-2, 1998, pp. 93-106. doi:10.1016/S0003-2670(97)00418-2 [24] S. Wold, M. Sjostrom and L. Eriksson, “PLS-Regression: A Basic Tool of Chemometrics,” Chemometrics and In- telligent Laboratory Systems, Vol. 58, No. 2, 2001, pp. 109-130. doi:10.1016/S0169-7439(01)00155-1 [25] E. Dinc, C. Yucesoy and F. Onur, “Simultaneous Spec- trophotometric Determination of Mefenamic Acid and Paracetamol in a Pharmaceutical Preparation Using Ratio Spectra Derivative Spectrophotometry and Chemometric Methods,” Journal of Pharmaceutical and Biomedical Analysis, Vol. 28, No. 6, 2002, pp. 1091-1100. doi:10.1016/S0731-7085(02)00031-6 [26] M. Bahram, “Mean Centering of Ratio Spectra as a New Method for Determination of Rate Constants of Consecu- tive Reactions,” Analytica Chimica Acta, Vol. 603, No. 1, 2007, pp. 13-19. doi:10.1016/j.aca.2007.09.041 [27] A. Afkhami and M. Bahram, “Mean Centering of Ratio Spectra as a New Spectrophotometric Method for the Analysis of Binary and Ternary Mixtures,” Talanta, Vol. 66, 2005, pp. 712-720. doi:10.1016/j.talanta.2004.12.004 Copyright © 2011 SciRes. AJAC
|