 American Journal of Plant Sciences, 2013, 4, 1918-1923 http://dx.doi.org/10.4236/ajps.2013.410235 Published Online October 2013 (http://www.scirp.org/journal/ajps) Soil and Leaf Micronutrient Composition in Contrasting Habitats in Podzolized Sands of the Amazon Region María Antonieta Sobrado Laboratorio de Biología Ambiental de Plantas, Departamento de Biología de Organismos, Universidad Simón Bolívar, Caracas, Venezuela. Email: msobrado@usb.ve Received July 5th, 2013; revised August 5th, 2013; accepted September 1st, 2013 Copyright © 2013 María Antonieta Sobrado. This is an open access article distributed under the Creative Commons Attribution Li- cense, which permits unrestricted use, distribution, and reproduction in any medium, provided the original work is properly cited. ABSTRACT Plant macronutrient distribution in podzolized sands of the Amazon caatinga has received attention in several studies; however, the distribution of micronutrients has not been assessed. Soil micronutrient availability has been hypothesized to reflect contrasting habitat characteristics as well as fundamental differences in substrate, and leaf micronutrient composition may reflect the macronutrient content needed to maintain balance for leaf cell functions. In this study, soil and leaf samples were obtained in a toposequence (valley, slope, and mound). Available soil micro- and macronutrients as well as total leaf content were measured by inductively coupled plasma-atomic emission spectrometer and mass spectroscopy. Soil Zn (<1.41 mg·kg−1) and B (<0.31 mg·kg−1) as well as Cu (<1.33 mg·kg−1) levels were very low. Soil Mn was low in the valleys and slopes (0.62 - 0.87 mg·kg−1), but higher in the mound (6.59 mg·kg−1). Soil Fe (11.48 - 21.13 mg·kg−1) was well above the critical level in all of the habitats. Leaf micronutrients Cu, B, Zn, and Fe were below the critical levels for tropical crops of 3 - 7, 20 - 70, 15 - 20, and 72 mg·kg−1, respectively. Leaf Mn (<188 mg·kg−1) and Al (<50 mg·kg−1) were below the accumulators level. A strong relationship between leaf micro- and macronutrients suggests the maintenance of a homeostatic elemental composition, which may favour photosynthetic function. There- fore, the local distribution of species may be shaped by their abilities to maintain a balance of micronutrient collected through roots under critically low levels of available Zn, B, and Cu whilst excluding potentially deleterious ions of Mn, Fe, and Al. Keywords: Acid Soils; Amazon Caatinga; Ionome; Leaf Nutrient Homeostasis; Micronutrients; Toxic Elements 1. Introduction Micronutrient availability and cycles in tropical areas are poorly understood, even though such information is im- perative for a thorough understanding of the complexities of major element cycles in these habitats [1]. Very low micronutrient levels have been found in tropical natural areas that have severely impoverished macronutrient le- vels as well [2,3]. The micronutrient distribution is par- ticularly relevant in a situation of deficiency, when alter- native plant developmental processes and biochemical pathways may be prioritized as a function of growth, de- velopment, metabolic status, and environment [4]. Thus, the interactions among elements within plant cells tend to reflect the regulatory network involved in the homeosta- sis of the ionome [5,6]. These interactions and the bal- ance of ions in plant tissue may have an ecophysiological significance as well, which requires further investigation in order to gain insight into these processes. The upper Rio Negro in the Amazon basin experiences high yearly rainfall levels, as well as differential soil types and topographical conditions. Consequently a mo- saic of vegetation types is featured. The Amazon caatinga complex is located on lowland areas with infertile, blea- ched, sandy podzols surrounded by low rolling hills con- taining oxisol soils [7]. A clear toposequence (valley- slopes-domes) with gradual changes is found within the caatinga, which forms a complex community continuum [8]. The macronutrient concentration and fluxes in soil organic matter as well as the organic matter turnover rates have paramount importance for the maintenance of fertility across the caatinga habitats [9,10]. Historically, plant macronutrient distribution has received most atten- tion for this vegetation type [9,11,12], and the distribu- tion of micronutrients has not been assessed previously. In this study, it was hypothesized that soil micronutrient availability may reflect contrasting habitat characteristics, Copyright © 2013 SciRes. AJPS  Soil and Leaf Micronutrient Composition in Contrasting Habitats in Podzolized Sands of the Amazon Region 1919 and that the leaf micronutrient composition of species thriving in different habitats may reflect the macronutri- ent content at particular sites in order to maintain the ion balance for leaf cell functions. In this study, the micronu- trient composition of soils and leaves of dominant tree species within the toposequence of the caatinga vegeta- tion was assessed. In particular, differences in the domi- nant species thriving in each of these contrasting sites were determined. 2. Material and Methods 2.1. Study Site and Species The study site is located near the confluence of the Rio Negro and the Casiquiare River in southern Venezuela near the village of San Carlos de Rio Negro (1˚54’N, 67˚3˚W, 119 m ASL). The area features a mean annual temperature of 26˚C and mean annual rainfall of 3600 mm. Podzol soils of the caatinga have developed proba- bly from Precambrian sandstone, and the top soil con- tains medium-textured sand mixed with humus [7]. In the valleys, soils are water saturated and dominated by Epe- rua leucantha Benth (Caesalpiniaceae; “yaguacana” for- est). The slopes (ecotone) are dominated by Micranda sprucei (Müll.Arg.) R. E. Schultes (Euphorbiaceae; “cu- nuri” forest), which maintain a relatively stable water ta- ble, and the slightly higher sandy mounds suffer droughts during short rainless periods [7,8]. The species selected for this study were E. leucantha and M. sprucei from the close, high stature forests (18 - 25 m; valley and slopes). The less fertile and drought-prone tops of the sandy mounds contain tree species of low stature and open ar- rangement (“bana” forest; 5 - 7 m). At this site, Pachira sordida (R.E. Schult.) W.S. Alverson (syn. Rodognapha- lopsis discol or A. Robyns), (Malvaceae) and Remijia mo- rilloi Steyerm (Rubiaceae) are the dominant species. The use of dominant species has proven to be ecological in- dicators of typical habitats within the upper Rio Negro vegetation [13]. From the valley towards the slopes and sandy mounds, leaves become more scleromorphic, and those on sandy mounds are relatively more drought-re- sistant [14,15]. 2.2. Leaf and Soil Sampling For each species, three mature trees with a fully exposed top canopy were selected and tagged for soil and plant collection during August 2010 [13]. Four soil samples consisting of sand and humus were collected from 0 - 5 cm depth under each tree (E. leucantha and M. sprucei) or under a pair of trees (P. sordida and R. morilloi). The four samples were pooled in the field after all visible plant pieces were removed by hand. Each sample con- sisting of sand and humus was dehydrated at room tem- perature, ground, homogenized, and sieved though 2 mmmesh. A total of three pooled soil samples were ana- lyzed in each of the three habitats. Three top canopy branches were detached in each tagged tree and adult lea- ves with a healthy appearance were collected and pooled. Leaf blade samples, excluding major veins, were oven dried to a constant weight at 60˚C and ground prior to performing the analysis. A total of three pooled leaf blade samples were analyzed for each plant species. 2.3. Soil Analysis Soil subsamples were used for the following analyses: soil pH was measured in a slurry of 5 g soil in distilled water at a ratio of 1:1. Buffer pH or acidity was esti- mated in subsamples of 5 g by using Mehlich 3 as a buf- fer solution to estimate the acidity. Organic content (OM) was determined by weight loss on ignition in subsamples of approximately 5 - 7 g. Soil exchangeable micronutri- ents (Fe, Mn, Zn, B, and Cu) and macronutrients (P, Ca, K, and Mg) as well as Al were measured by using an In- ductively Coupled Plasma-Atomic Emission Spectrome- ter (ICP-AES, Varian, Model 730-ES, Palo Alto, Cali- fornia, USA). The Mehlich 3 soil test extract was used in subsamples for element extraction, except for B, which was extracted in hot water. Soil subsamples weighing 10 g were used for B extraction and a subsample measuring 2.5 cm3 was used for the other elements. Soil cation ex- change capacity (CEC) was estimated from the sum of soil acidity (see above) and the Ca, Mg, and K content and expressed as meq/100 g. The percentage of base sa- turation (BS) was calculated as the percentage of soil CEC occupied by Ca, Mg, and K. Detailed soil analysis procedures have been previously described [16]. The soil N and C composition analysis was performed at the Sta- ble Isotope Research Facility for Ecological Research (SIRFER), University of Utah (Salt Lake City, USA). 2.4. Leaf Analysis Leaf samples were analyzed for the same elements mea- sured in the soils using the ICP-AES as well. A total of 0.2 g per leaf sample was muffled and ashed, dissolved in 2 ml of 5 N HCL, and heated at 200˚C for 2 min. Sub- sequently, the samples were brought to a 10 ml volume with de-ionized water and centrifuged at 2000 rpm for 4 minutes to precipitate carbon rests prior to performing ICP measurements. The procedure followed is described elsewhere [17]. The leaf N and C compositions of these species have been previously reported [14,18]. 2.5. Statistical Analysis Measurements were performed on independent replicates taken randomly, and data are presented as mean ± stan- dard error. The normality of distributions was assessed Copyright © 2013 SciRes. AJPS 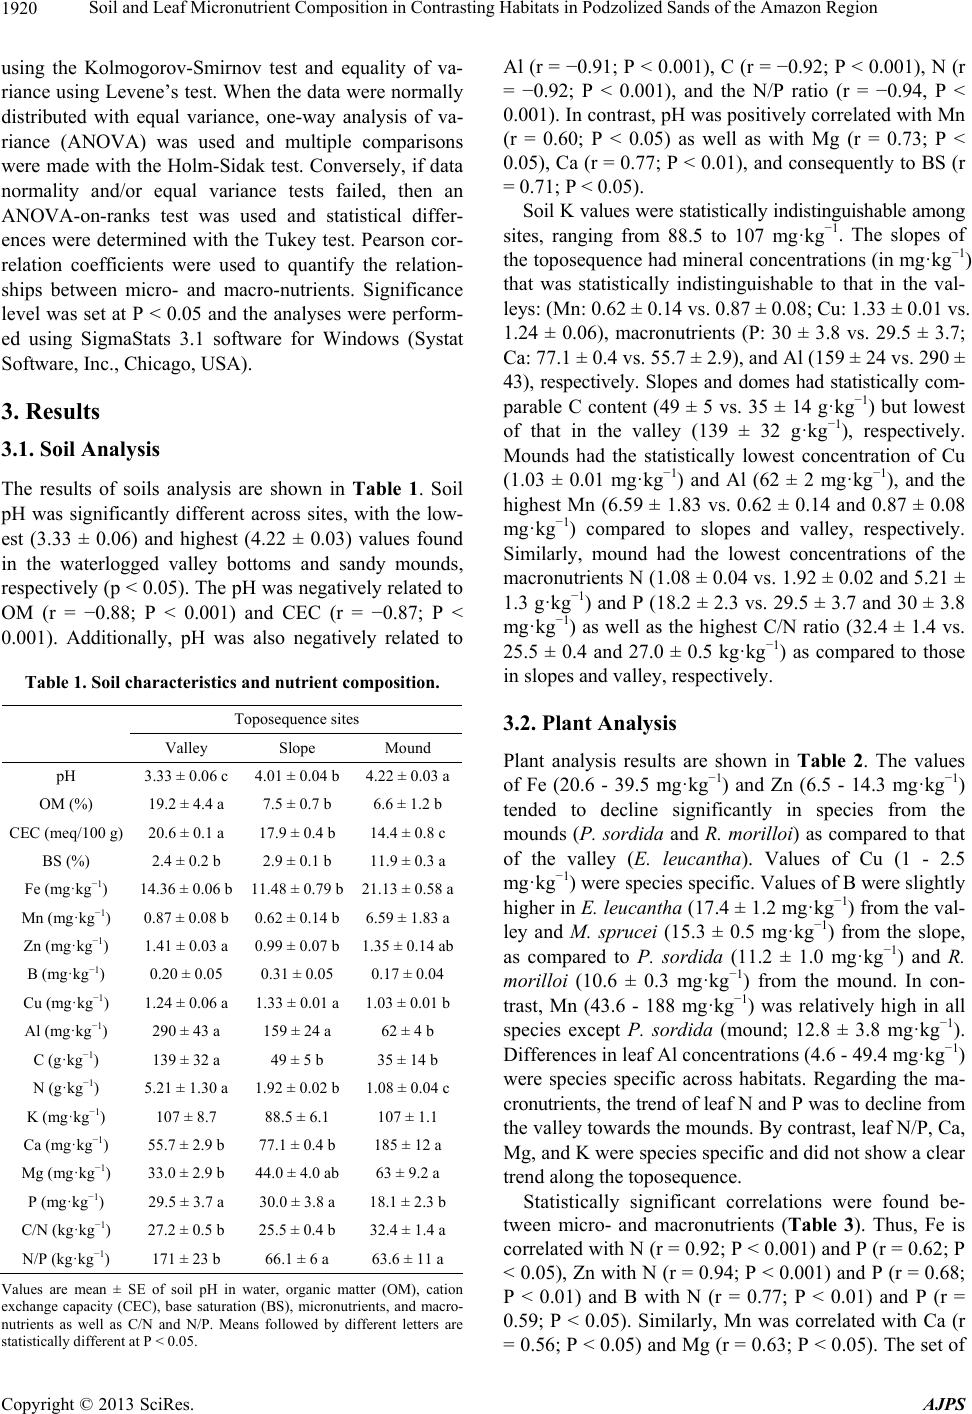 Soil and Leaf Micronutrient Composition in Contrasting Habitats in Podzolized Sands of the Amazon Region 1920 using the Kolmogorov-Smirnov test and equality of va- riance using Levene’s test. When the data were normally distributed with equal variance, one-way analysis of va- riance (ANOVA) was used and multiple comparisons were made with the Holm-Sidak test. Conversely, if data normality and/or equal variance tests failed, then an ANOVA-on-ranks test was used and statistical differ- ences were determined with the Tukey test. Pearson cor- relation coefficients were used to quantify the relation- ships between micro- and macro-nutrients. Significance level was set at P < 0.05 and the analyses were perform- ed using SigmaStats 3.1 software for Windows (Systat Software, Inc., Chicago, USA). 3. Results 3.1. Soil Analysis The results of soils analysis are shown in Table 1. Soil pH was significantly different across sites, with the low- est (3.33 ± 0.06) and highest (4.22 ± 0.03) values found in the waterlogged valley bottoms and sandy mounds, respectively (p < 0.05). The pH was negatively related to OM (r = −0.88; P < 0.001) and CEC (r = −0.87; P < 0.001). Additionally, pH was also negatively related to Table 1. Soil characteristics and nutrient composition. Toposequence sites Valley Slope Mound pH 3.33 ± 0.06 c 4.01 ± 0.04 b 4.22 ± 0.03 a OM (%) 19.2 ± 4.4 a 7.5 ± 0.7 b 6.6 ± 1.2 b CEC (meq/100 g) 20.6 ± 0.1 a 17.9 ± 0.4 b 14.4 ± 0.8 c BS (%) 2.4 ± 0.2 b 2.9 ± 0.1 b 11.9 ± 0.3 a Fe (mg·kg−1) 14.36 ± 0.06 b 11.48 ± 0.79 b 21.13 ± 0.58 a Mn (mg·kg−1) 0.87 ± 0.08 b 0.62 ± 0.14 b 6.59 ± 1.83 a Zn (mg·kg−1) 1.41 ± 0.03 a 0.99 ± 0.07 b 1.35 ± 0.14 ab B (mg·kg−1) 0.20 ± 0.05 0.31 ± 0.05 0.17 ± 0.04 Cu (mg·kg−1) 1.24 ± 0.06 a 1.33 ± 0.01 a 1.03 ± 0.01 b Al (mg·kg−1) 290 ± 43 a 159 ± 24 a 62 ± 4 b C (g·kg−1) 139 ± 32 a 49 ± 5 b 35 ± 14 b N (g·kg−1) 5.21 ± 1.30 a 1.92 ± 0.02 b 1.08 ± 0.04 c K (mg·kg−1) 107 ± 8.7 88.5 ± 6.1 107 ± 1.1 Ca (mg·kg−1) 55.7 ± 2.9 b 77.1 ± 0.4 b 185 ± 12 a Mg (mg·kg−1) 33.0 ± 2.9 b 44.0 ± 4.0 ab 63 ± 9.2 a P (mg·kg−1) 29.5 ± 3.7 a 30.0 ± 3.8 a 18.1 ± 2.3 b C/N (kg·kg−1) 27.2 ± 0.5 b 25.5 ± 0.4 b 32.4 ± 1.4 a N/P (kg·kg−1) 171 ± 23 b 66.1 ± 6 a 63.6 ± 11 a Values are mean ± SE of soil pH in water, organic matter (OM), cation exchange capacity (CEC), base saturation (BS), micronutrients, and macro- nutrients as well as C/N and N/P. Means followed by different letters are statistically different at P < 0.05. Al (r = −0.91; P < 0.001), C (r = −0.92; P < 0.001), N (r = −0.92; P < 0.001), and the N/P ratio (r = −0.94, P < 0.001). In contrast, pH was positively correlated with Mn (r = 0.60; P < 0.05) as well as with Mg (r = 0.73; P < 0.05), Ca (r = 0.77; P < 0.01), and consequently to BS (r = 0.71; P < 0.05). Soil K values were statistically indistinguishable among sites, ranging from 88.5 to 107 mg·kg−1. The slopes of the toposequence had mineral concentrations (in mg·kg−1) that was statistically indistinguishable to that in the val- leys: (Mn: 0.62 ± 0.14 vs. 0.87 ± 0.08; Cu: 1.33 ± 0.01 vs. 1.24 ± 0.06), macronutrients (P: 30 ± 3.8 vs. 29.5 ± 3.7; Ca: 77.1 ± 0.4 vs. 55.7 ± 2.9), and Al (159 ± 24 vs. 290 ± 43), respectively. Slopes and domes had statistically com- parable C content (49 ± 5 vs. 35 ± 14 g·kg−1) but lowest of that in the valley (139 ± 32 g·kg−1), respectively. Mounds had the statistically lowest concentration of Cu (1.03 ± 0.01 mg·kg−1) and Al (62 ± 2 mg·kg−1), and the highest Mn (6.59 ± 1.83 vs. 0.62 ± 0.14 and 0.87 ± 0.08 mg·kg−1) compared to slopes and valley, respectively. Similarly, mound had the lowest concentrations of the macronutrients N (1.08 ± 0.04 vs. 1.92 ± 0.02 and 5.21 ± 1.3 g·kg−1) and P (18.2 ± 2.3 vs. 29.5 ± 3.7 and 30 ± 3.8 mg·kg−1) as well as the highest C/N ratio (32.4 ± 1.4 vs. 25.5 ± 0.4 and 27.0 ± 0.5 kg·kg−1) as compared to those in slopes and valley, respectively. 3.2. Plant Analysis Plant analysis results are shown in Table 2. The values of Fe (20.6 - 39.5 mg·kg−1) and Zn (6.5 - 14.3 mg·kg−1) tended to decline significantly in species from the mounds (P. sordida and R. morilloi) as compared to that of the valley (E. leucantha). Values of Cu (1 - 2.5 mg·kg−1) were species specific. Values of B were slightly higher in E. leucantha (17.4 ± 1.2 mg·kg−1) from the val- ley and M. sprucei (15.3 ± 0.5 mg·kg−1) from the slope, as compared to P. sordida (11.2 ± 1.0 mg·kg−1) and R. morilloi (10.6 ± 0.3 mg·kg−1) from the mound. In con- trast, Mn (43.6 - 188 mg·kg−1) was relatively high in all species except P. sordida (mound; 12.8 ± 3.8 mg·kg−1). Differences in leaf Al concentrations (4.6 - 49.4 mg·kg−1) were species specific across habitats. Regarding the ma- cronutrients, the trend of leaf N and P was to decline from the valley towards the mounds. By contrast, leaf N/P, Ca, Mg, and K were species specific and did not show a clear trend along the toposequence. Statistically significant correlations were found be- tween micro- and macronutrients (Table 3). Thus, Fe is correlated with N (r = 0.92; P < 0.001) and P (r = 0.62; P < 0.05), Zn with N (r = 0.94; P < 0.001) and P (r = 0.68; P < 0.01) and B with N (r = 0.77; P < 0.01) and P (r = 0.59; P < 0.05). Similarly, Mn was correlated with Ca (r = 0.56; P < 0.05) and Mg (r = 0.63; P < 0.05). The set of Copyright © 2013 SciRes. AJPS 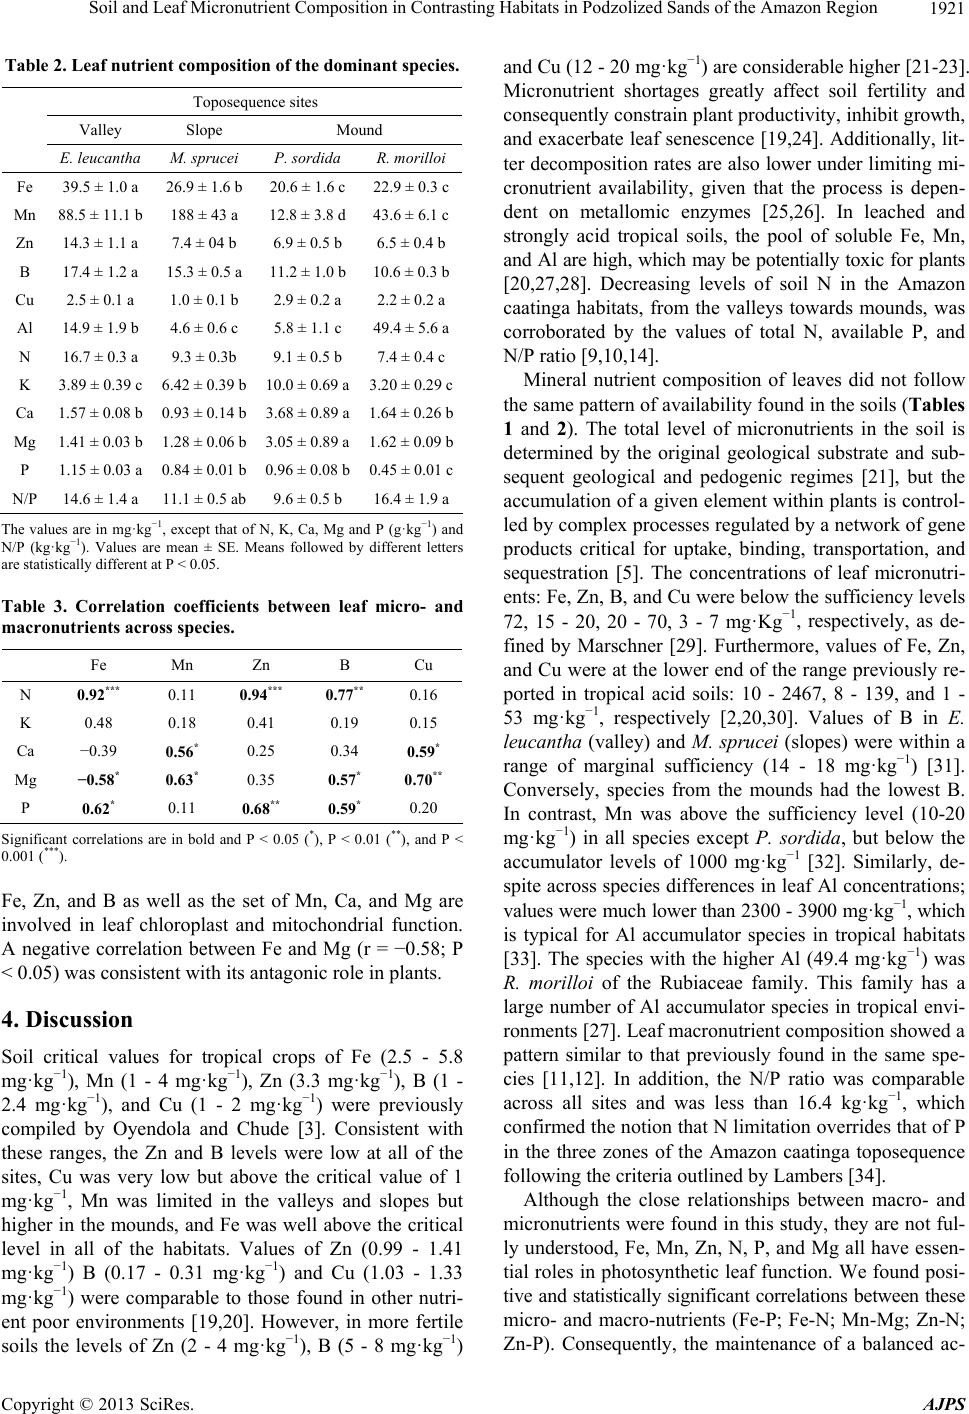 Soil and Leaf Micronutrient Composition in Contrasting Habitats in Podzolized Sands of the Amazon Region 1921 Table 2. Leaf nutrient composition of the dominant species. Toposequence sites Valley Slope Mound E. leucantha M. sprucei P. so r d i da R. morilloi Fe 39.5 ± 1.0 a 26.9 ± 1.6 b20.6 ± 1.6 c 22.9 ± 0.3 c Mn 88.5 ± 11.1 b 188 ± 43 a 12.8 ± 3.8 d 43.6 ± 6.1 c Zn 14.3 ± 1.1 a 7.4 ± 04 b 6.9 ± 0.5 b 6.5 ± 0.4 b B 17.4 ± 1.2 a 15.3 ± 0.5 a11.2 ± 1.0 b 10.6 ± 0.3 b Cu 2.5 ± 0.1 a 1.0 ± 0.1 b 2.9 ± 0.2 a 2.2 ± 0.2 a Al 14.9 ± 1.9 b 4.6 ± 0.6 c 5.8 ± 1.1 c 49.4 ± 5.6 a N 16.7 ± 0.3 a 9.3 ± 0.3b 9.1 ± 0.5 b 7.4 ± 0.4 c K 3.89 ± 0.39 c 6.42 ± 0.39 b10.0 ± 0.69 a 3.20 ± 0.29 c Ca 1.57 ± 0.08 b 0.93 ± 0.14 b3.68 ± 0.89 a 1.64 ± 0.26 b Mg 1.41 ± 0.03 b 1.28 ± 0.06 b3.05 ± 0.89 a 1.62 ± 0.09 b P 1.15 ± 0.03 a 0.84 ± 0.01 b0.96 ± 0.08 b 0.45 ± 0.01 c N/P 14.6 ± 1.4 a 11.1 ± 0.5 ab9.6 ± 0.5 b 16.4 ± 1.9 a The values are in mg·kg−1, except that of N, K, Ca, Mg and P (g·kg−1) and N/P (kg·kg−1). Values are mean ± SE. Means followed by different letters are statistically different at P < 0.05. Table 3. Correlation coefficients between leaf micro- and macronutrients across species. Fe Mn Zn B Cu N 0.92*** 0.11 0.94*** 0.77** 0.16 K 0.48 0.18 0.41 0.19 0.15 Ca −0.39 0.56* 0.25 0.34 0.59* Mg −0.58* 0.63* 0.35 0.57* 0.70** P 0.62* 0.11 0.68** 0.59* 0.20 Significant correlations are in bold and P < 0.05 (*), P < 0.01 (**), and P < 0.001 (***). Fe, Zn, and B as well as the set of Mn, Ca, and Mg are involved in leaf chloroplast and mitochondrial function. A negative correlation between Fe and Mg (r = −0.58; P < 0.05) was consistent with its antagonic role in plants. 4. Discussion Soil critical values for tropical crops of Fe (2.5 - 5.8 mg·kg−1), Mn (1 - 4 mg·kg−1), Zn (3.3 mg·kg−1), B (1 - 2.4 mg·kg−1), and Cu (1 - 2 mg·kg−1) were previously compiled by Oyendola and Chude [3]. Consistent with these ranges, the Zn and B levels were low at all of the sites, Cu was very low but above the critical value of 1 mg·kg−1, Mn was limited in the valleys and slopes but higher in the mounds, and Fe was well above the critical level in all of the habitats. Values of Zn (0.99 - 1.41 mg·kg−1) B (0.17 - 0.31 mg·kg−1) and Cu (1.03 - 1.33 mg·kg−1) were comparable to those found in other nutri- ent poor environments [19,20]. However, in more fertile soils the levels of Zn (2 - 4 mg·kg−1), B (5 - 8 mg·kg−1) and Cu (12 - 20 mg·kg−1) are considerable higher [21-23]. Micronutrient shortages greatly affect soil fertility and consequently constrain plant productivity, inhibit growth, and exacerbate leaf senescence [19,24]. Additionally, lit- ter decomposition rates are also lower under limiting mi- cronutrient availability, given that the process is depen- dent on metallomic enzymes [25,26]. In leached and strongly acid tropical soils, the pool of soluble Fe, Mn, and Al are high, which may be potentially toxic for plants [20,27,28]. Decreasing levels of soil N in the Amazon caatinga habitats, from the valleys towards mounds, was corroborated by the values of total N, available P, and N/P ratio [9,10,14]. Mineral nutrient composition of leaves did not follow the same pattern of availability found in the soils (Tables 1 and 2). The total level of micronutrients in the soil is determined by the original geological substrate and sub- sequent geological and pedogenic regimes [21], but the accumulation of a given element within plants is control- led by complex processes regulated by a network of gene products critical for uptake, binding, transportation, and sequestration [5]. The concentrations of leaf micronutri- ents: Fe, Zn, B, and Cu were below the sufficiency levels 72, 15 - 20, 20 - 70, 3 - 7 mg·Kg−1, respectively, as de- fined by Marschner [29]. Furthermore, values of Fe, Zn, and Cu were at the lower end of the range previously re- ported in tropical acid soils: 10 - 2467, 8 - 139, and 1 - 53 mg·kg−1, respectively [2,20,30]. Values of B in E. leucantha (valley) and M. sprucei (slopes) were within a range of marginal sufficiency (14 - 18 mg·kg−1) [31]. Conversely, species from the mounds had the lowest B. In contrast, Mn was above the sufficiency level (10-20 mg·kg−1) in all species except P. sordida, but below the accumulator levels of 1000 mg·kg−1 [32]. Similarly, de- spite across species differences in leaf Al concentrations; values were much lower than 2300 - 3900 mg·kg−1, which is typical for Al accumulator species in tropical habitats [33]. The species with the higher Al (49.4 mg·kg−1) was R. morilloi of the Rubiaceae family. This family has a large number of Al accumulator species in tropical envi- ronments [27]. Leaf macronutrient composition showed a pattern similar to that previously found in the same spe- cies [11,12]. In addition, the N/P ratio was comparable across all sites and was less than 16.4 kg·kg−1, which confirmed the notion that N limitation overrides that of P in the three zones of the Amazon caatinga toposequence following the criteria outlined by Lambers [34]. Although the close relationships between macro- and micronutrients were found in this study, they are not ful- ly understood, Fe, Mn, Zn, N, P, and Mg all have essen- tial roles in photosynthetic leaf function. We found posi- tive and statistically significant correlations between these micro- and macro-nutrients (Fe-P; Fe-N; Mn-Mg; Zn-N; Zn-P). Consequently, the maintenance of a balanced ac- Copyright © 2013 SciRes. AJPS  Soil and Leaf Micronutrient Composition in Contrasting Habitats in Podzolized Sands of the Amazon Region 1922 cumulation of these micro- and macronutrients in leaves may have an adaptive value for growth in habitats with limited availability. Indeed, some interrelationships have been previously identified between micro- and macronu- trients. For example, a nucleic acid-protein set has been correlated with concentrations of P, N, Cu, S, and Fe, and structural, photosynthetic, and enzymatic sets have also been correlated with concentrations of Mn, Mg, Ca, and K [35]. However, further studies including a wide variety of habitats and species are required for a complete under- standing of this issue. 5. Conclusions Based on the results of the present study, the following conclusions were drawn: 1. The soil Zn, B, and Cu levels were very low in all of the habitats of the Amazon caatinga toposequence. 2. The soil levels of Fe would be potentially toxic in all habitats, Mn levels may be toxic in the mounds, and Al may be toxic in valleys and slopes. 3. In all of the habitats, the leaf concentrations of Cu, B, Zn, and Fe were below sufficiency levels, and con- centrations of Mn and Al were within normal range found in non-accumulators. 4. A strong relationship between leaf micro- and ma- cronutrients suggested the maintenance of a homeostatic nutrient composition, which would favor photosynthetic function at the leaf level. Therefore, the local distribution of species may be shaped for their abilities to maintain a balanced collection of micronutrients through roots under critical levels of available Zn, B, and Cu as well as the ability to exclude Mn, Fe, and Al. 6. Acknowledgements Financial support for soil and plant analysis was provided partially by DID-USB-Fondo de Trabajo-2012. Helpful discussions with Dr E. Olivares (IVIC, Caracas) during the development of this study are sincerely appreciated, as well the kind bibliographical materials provided. I thank Pedro Maquirino for his invaluable help in the field work, and to Editor and anonymous referees for sugges- tions to improve the manuscript. REFERENCES [1] B. E. Davies, “Deficiencies and Toxicities of Trace Ele- ments and Micronutrients in Tropical Soils: Limitations of Knowledge and Future Research Needs,” Environ- mental Toxicology and Chemistry, Vol. 16, No. 1, 1997, pp. 75-83. http://dx.doi.org/10.1002/etc.5620160108 [2] E. Olivares, G. Colonnello, E. Peña and L. Rodriguez, “Aluminum Accumulation in Nineteen Melastomataceae Species from Three Contrasting Plant Formations in Acid Soils,” Journal of Plant Nutrition and Soil Science, Vol. 173, No. 3, 2010, pp. 453-460. http://dx.doi.org/10.1002/jpln.200900152 [3] E. Y. Oyinlola and V. O. Chude, “Status of Available Mi- cronutrients of the Basement Complex Rock-Derived Al- fisols in Northern Nigeria Savanna,” Tropical and Sub- tropical Agroecosystems, Vol. 12, No. 2, 2010, pp. 229- 237. http://www.veterinaria.uady.mx/ojs/index.php/TSA/articl e/view/226 [4] S. S. Merchant, “The Elements of Plant Micronutrients,” Plant Physiology, Vol. 154, No. 2, 2010, pp. 512-515. doi:http:/dx.doi.org/10.1104/pp.110.161810 [5] I. Baxter, “Ionomics: Studying the Social Network of Mi- neral Nutrients,” Current Opinion in Plant Biology, Vol. 12, No. 4, 2009, pp. 381-386. http://dx.doi.org/10.1016/j.pbi.2009.05.002 [6] K. Satismruti, N. Senthil, S. Vellaikumar, R. V. Ranjani and M. Raveendran, “Plant Ionomics: A Platform for Iden- tifying Novel Gene Regulating Plant Mineral Nutrition,” American Journal of Plant Sciences, Vol. 4, No. 7, 2013, pp. 1309-1315. [7] R. Herrera, “Soil and Terrain Condition in the San Carlos de Rio Negro Project (Venezuela MAB-1) Study Site; Correlation with Vegetation Types,” In: E. F. Brunig, Ed., Transactions of the Second International MAB-IUFRO Workshop on Tropical Rainforest Ecosystems Research (Jakarta), World Chair of Forestry, Hamburg-Reinbek, 1977, pp. 182-188. [8] R. F. Breimer, “Some Observations on Soils in Relation to Forest Types in San Carlos de Rio Negro, Venezuela,” In: R. F. Breimer, A. J. van Kekem and H. van Reuler, Eds., Guidelines for Soil Survey in Ecological Research, UNESCO, Paris, 1985, pp. 108-110. [9] D. A. Coomes, “Nutrient Status of Amazonian Caatinga Forests in a Seasonally Dry Area: Nutrient Fluxes in Lit- ter Fall and Analyses of Soils,” Canadian Journal of For- est Research, Vol. 27, No. 6, 1997, pp. 831-839. [10] H. Tiessen, E. Cuevas and P. Chacon, “The Role of Soil Organic Matter in Sustaining Soil Fertility,” Nature, Vol. 371, No. 7464, 1994, pp. 783-785. http://dx.doi.org/10.1038/371783a0 [11] E. Cuevas and E. Medina, “Nutrient Dynamics within Ama- zonian Forest Ecosystems,” Oecologia, Vol. 68, No. 3, 1986, pp. 466-472. http://dx.doi.org/10.1007/BF01036756 [12] M. A. Sobrado and E. Medina, “General Morphology, Ana- tomical Structure and Nutrient Content of Sclerophyllous Leaves of the ‘Bana’ Vegetation,” Oecologia, Vol. 45, No. 3, 1980, pp. 341-345. doi:http://www.jstor.org/stable/4216102 [13] M. A. Sobrado, “Leaf Pigment Composition and Fluore- scence Signatures of Top Canopy Leaves in Species of the Upper Rio Negro Forests,” Research Journal of Bot- any, Vol. 6, No. 4, 2011, pp. 141-149. http://dx.doi.org/10.3923/rjb.2011.141.149 [14] M. A. Sobrado, “Leaf Characteristics, Wood Anatomy and Hydraulic Properties in Tree Species from Contrasting Habitats within Upper Rio Negro Forests in the Amazon Region,” Journal of Tropical Ecology, Vol. 26, No. 2, Copyright © 2013 SciRes. AJPS  Soil and Leaf Micronutrient Composition in Contrasting Habitats in Podzolized Sands of the Amazon Region Copyright © 2013 SciRes. AJPS 1923 2010, pp. 215-226. http://dx.doi.org/10.1017/S0266467409990538 [15] M. A. Sobrado, “Leaf Tissue Water Relations in Tree Spe- cies from Contrasting Habitats within the Upper Rio Ne- gro Forests of the Amazon Region,” Journal of Tropical Ecology, Vol. 28, No. 5, 2012, pp. 519-522. http://dx.doi.org/10.1017/S0266467412000454 [16] T. Sims and A. Wolfe, “Recommended Soil Testing Pro- cedures for the Northeastern United States,” Northeast Regional Bulletin No 493, Agricultural Experiment Sta- tion, University of Delaware, Delaware, 1995. [17] R. O. Miller, “High-Temperature Oxidation: Dry Ashing,” In: Y. P. Kaira, Ed., Handbook of Reference Methods for Plant Analysis, CRC, Boca Raton, 1988, pp. 53-56. [18] M. A. Sobrado, “Leaf Characteristics and Diurnal Varia- tion of Chlorophyll Fluorescence in Leaves of the ‘Bana’ Vegetation of the Amazon Region,” Photosynthetica, Vol. 46, No. 2, 2008, pp. 202-207. http://dx.doi.org/10.1007/s11099-008-0033-9 [19] A. S. Lopes, “Micronutrients in Soils of the Tropics as Con- straints to Food Production in the Tropics,” The Interna- tional Rice Research Institute, Los Baños, Laguna, 1980. [20] M. Osaki, T. Watanabe, T. Ishizawa, C. Nilnond, T. Nu- yim, T. Shinano, M. Urayama and S. J. Tuah, “Nutritional Characteristics of the Leaves of Native Plants Growing in Adverse Soils of Humid Tropical Lowlands,” Plant Foods for Human Nutrition, Vol. 58, No. 2, 2003, pp. 93-115. http://dx.doi.org/10.1023/A:1024415203690 [21] Y. Jiang, Y. G. Zhang, D. Zhou, Y. Qin and W. J. Liang, “Profile Distribution of Micronutrients in an Aquatic Brown Soil as Affected by Land Use,” Plant Soil and Environ- ment, Vol. 55, No. 11, 2009, pp. 468-476. http://www.agriculturejournals.cz/publicFiles/12160.pdf [22] V. Srivasan, S. Hanza, K. S. Krishnamurthy and C. K. Thankamani, “Threshold Level of Soil Zinc for Optimum Production of Ginger (Zingiber officinale Rosc.),” Jour- nal of Spices and Aromatic Crops, Vol. 13, No. 1, pp. 55- 57. http://220.227.138.214:8080/dspace/bitstream/123456789 /129/1/Vol.+XIII+No.1+%2855-57%29.pdf [23] R. O. Nable, G. S. Bañuelos and G. Paull, “Boron Toxic- ity,” Plant and Soil, Vol. 193, No. 1-2, 1997, pp. 181-198. http://dx.doi.org/10.1023/A:1004272227886 [24] Y. L. Feng, Y. B. Lei and Z. Li, “Micronutrients Deficien- cies Accelerate Leaf Senescence in Amomum villosum,” Botanical Studies, Vol. 53, No. 3, 2012, pp. 345-352. http://ejournal.sinica.edu.tw/bbas/content/2012/3/Bot533- 07.pdf [25] M. Kaspari, M. N., Garcia, K. H. Harms, M. Santana, S. J. Wright and J. B. Yavitt, “Multiple Nutrients Limit Litter- fall and Decomposition in Tropical Forests,” Ecology Letters, Vol. 11, No. 1, 2008, pp. 35-43. http://dx.doi.org/10.1111/j.1461-0248.2007.01124.x [26] J. S. Powers and S. Salute, “Macro- and Micronutrients Effects on Decomposition of Leaf Litter from Two Tro- pical Tree Species: Inferences from a Short-Term Labo- ratory Incubation,” Plant and Soil, Vol. 346, No. 1-2, 2011, pp. 245-257. http://dx.doi.org/10.1007/s11104-011-0815-x [27] S. Jansen, M. R. Broadley, E. Robbrecht and E. Smets, “Aluminium Hyperaccumulation in Angiosperms: A Re- view of Its Phylogenetic Significance,” The Botanical Re- view, Vol. 68, No. 2, 2002, pp. 235-269. http://dx.doi.org/10.1663/0006-8101(2002)068[0235:AHI AAR]2.0.CO;2 [28] N. P. Qafoku, E. van Ranst, A. Noble and G. Baert, “Va- riable Charge Soils: Their Mineralogy, Chemistry and Ma- nagement,” Advances in Agronomy, Vol. 84, 2004, pp. 159-215. http://dx.doi.org/10.1016/S0065-2113(04)84004-5 [29] H. Marschner, “Mineral Nutrition of Higher Plants,” Aca- demic Press, London, 1995. [30] E. Olivares, M. Benítez, E. Peña and G. Colonnello, “Alu- minum Accumulation and Nutrients in Pterolepis glom- erata, Desmoscelis villosa and Rhynchanthera grandiflo- ra in Palm Swamp Communities,” Botany, Vol. 91, No. 3, 2013, pp. 202-208. [31] G. Liakopoulos and G. Karabourniotis, “Boron Deficien- cy and Concentration and Composition of Phenolic Com- pounds in Olea europaea Leaves: A Combined Growth Chamber and Field Study,” Tree Physiology, Vol. 25, No. 3, 2005, pp. 307-315. http://dx.doi.org/10.1093/treephys/25.3.307 [32] S. D. Bidwell, I. E. Woodrow, G. N. Bataianoff and J. So- mmer-Knudsen, “Hyperaccumulation of Manganese in the Rainforest Tree Austromyrtus bidwillii (Myrtaceae) from Queensland, Australia,” Functional Plant Biology, Vol. 29, No. 7, 2002, pp. 899-905. http://dx.doi.org/10.1071/PP01192 [33] F. Metali, K. A. Salim and D. F. R. P. Burslem, “Evidence of Foliar Aluminium Accumulation in Local, Regional and Global Datasets of Wild Plants,” New Phytologist, Vol. 193, No. 3, 2012, pp. 637-649. http://dx.doi.org/10.1111/j.1469-8137.2011.03965.x [34] H. Lambers, M. C. Brundrett, J. A. Raven and S. D. Hop- per, “Plant Mineral Nutrition in Ancient Landscapes: High Plant Species Diversity on Infertile Soils Is Linked to Functional Diversity for Nutritional Strategies,” Plant and Soil, Vol. 334, No. 1-2, 2010, pp. 11-31. http://dx.doi.org/10.1007/s11104-010-0444-9 [35] T. Watanabe, M. R. Broadley, S. Jansen, P. J. White, J. Ta- kada, K. Satake, T. Takamatsu, S. J. Tuah and M. Osaki, “Evolutionary Control of Leaf Elements Composition in Plants,” New Phytologist, Vol. 174, No. 3, 2007, pp. 516- 523. http://dx.doi.org/10.1111/j.1469-8137.2007.02078.x
|