Journal of Surface Engineered Materials and Advanced Technology, 2013, 3, 1-6
http://dx.doi.org/10.4236/jsemat.2013.33A001 Published Online September 2013 (http://www.scirp.org/journal/jsemat)
1
Determination of Coke, Pitch and Pores/Cracks in Green
Anode by Image Analysis
Dipankar Bhattacharyay1, Duygu Kocaefe1*, Yasar Kocaefe1, Brigitte Morais2
1University Research Center on Aluminum (CURAL), University of Quebec at Chicoutimi, Chicoutimi, Canada; 2Aluminerie Alou-
ette Inc., Sept-Îles, Canada.
Email: *Duygu_kocaefe@uqac.ca
Received July 19th, 2013; revised August 22nd, 2013; accepted August 30th, 2013
Copyright © 2013 Dipankar Bhattacharyay et al. This is an open access article distributed under the Creative Commons Attribution
License, which permits unrestricted use, distribution, and reproduction in any medium, provided the original work is properly cited.
ABSTRACT
Carbon anodes are an essential part of the primary aluminum production. They are made of coal tar pitch, calcined pe-
troleum coke, recycled anodes and butts. As pitch acts as a binder for the anode, its proper distribution in a green anode
has a great impact on the properties of the baked anode. Information on cracks in anodes is important for the quality of
the baked anode. There is presently no reliable method available to analyze and quantify the amount of coke, pitch and
pores/cracks in a green anode sample. In this article, an image analysis technique has been described, that can analyze
as well as quantify the area percentage of pores/cracks and weight percentages of pitch and coke. The novelty of the
method is its capacity to differentiate the different components of anode.
Keywords: Image Analysis; Carbon Anode; Coke; Pitch; Pore; Crack
1. Introduction
Carbon anodes for the production of primary aluminum
are manufactured using coal tar pitch as binder with filler
materials. The filler materials consist of calcined coke
(fresh coke, recycled butts, and rejected anodes), pitch
(coming from the rejected green anodes), and cokified
pitch that has undergone baking and recycled in butts and
rejected baked anodes). Thus, when the filler materials
are mixed with fresh pitch to form the anode, the amount
and the distribution of pitch change. It is a known fact
that pitch quantity and distribution in an anode are two of
the key factors defining anode properties such as density,
electrical resistivity and CO2/air reactivities [1,2]. There
is no standardized technique available for the estimation
of the pitch distribution in the anode samples.
Peterson et al. [3] showed that if the amount of pitch is
above the optimum level, the width of the anode in-
creases compared to the width of the mould. Thus meas-
urement of the width of an anode can be correlated to the
pitch content. Cracks are also studied by analyzing anode
samples either by visual inspection or using optical mi-
croscopy or scanning electron microscopy. However, the
indirect methods cannot be used to quantify the amount
of pitch, coke, and pores/cracks.
Nowadays, researchers have presented an image analy-
sis as a highly useful technique for the analysis; however,
the challenge is that, in anodes, coke, pitch, and pores all
appear black. Even with the scanning electron micros-
copy, it is hard to differentiate coke from pitch [4]. Re-
searchers have proposed various methods of image
analysis for coke (matrix and pore) and anode (coke ma-
trix, pitch, and pore) by optical microscopy using polar-
ized lights [4] or fluorescent materials [5].
Some commercial image analysis software is avail-
able for the analysis of different constituents in a material.
The software provides different filters and image analy-
sis techniques which need to be customized for identifi-
cation of different constituents in an anode material. For
example, the image analysis software developed at the
National Institute of Health in the US [4] provides a fil-
tering function (smooth, sharpen, find edges, etc.), rank
filters (median filter to reduce noise, etc.), dither (to
convert an image to a binary black and white image),
spatial convolutions (“Mexican hat” filter which does
both smoothing and edge detection in one operation),
binary (convert gray scale image to binary), arithmetic
and logical operations between two images, frequency
domain display, subtract background, look-up table func-
tion (enhance contrast, equalize, etc.). Rorvik et al. [4]
used this software to analyze coke, pitch and crack dis-
*Corresponding author.
Copyright © 2013 SciRes. JSEMAT
Determination of Coke, Pitch and Pores/Cracks in Green Anode by Image Analysis
2
tribution in a picture of a green anode sample taken using
a polarized light and two filters. In their method, they
relied on the Euclidian distance between the color of a
point in the three-dimensional space of primary colors
(red, green, and blue) with respect to the average value of
pitch. In the software, the Euclidian distance map (EDM)
is generated by replacing each foreground (black) pixel
in the binary image with a gray value equal to that pixel’s
distance from the nearest background (white) pixel.
However, the success of this method in identifying dif-
ferent constituents mainly depends on the proper selec-
tion of average values of pitch which can vary from sam-
ple to sample. Also, when a picture is binarized during
analysis, a lot of information is ignored.
Adams et al. [6] proposed a semi-automatic method
for the analysis of pitch in anodes. In the algorithm, they
first converted the image to binary (black and white).
Then they generated the dilated image filling the holes
(black) of dimension less than 50 μm by the background
color and analyzed pitch for only those particles which
have an area greater than 100,000 μm2. Thus, their
method is applicable only to big particles. It may be
noted that anodes often contain particles less than 75 μm
in size. They used the optical microscope for the image
analysis and, in the first stage, as they binarized the im-
age, there was significant information loss.
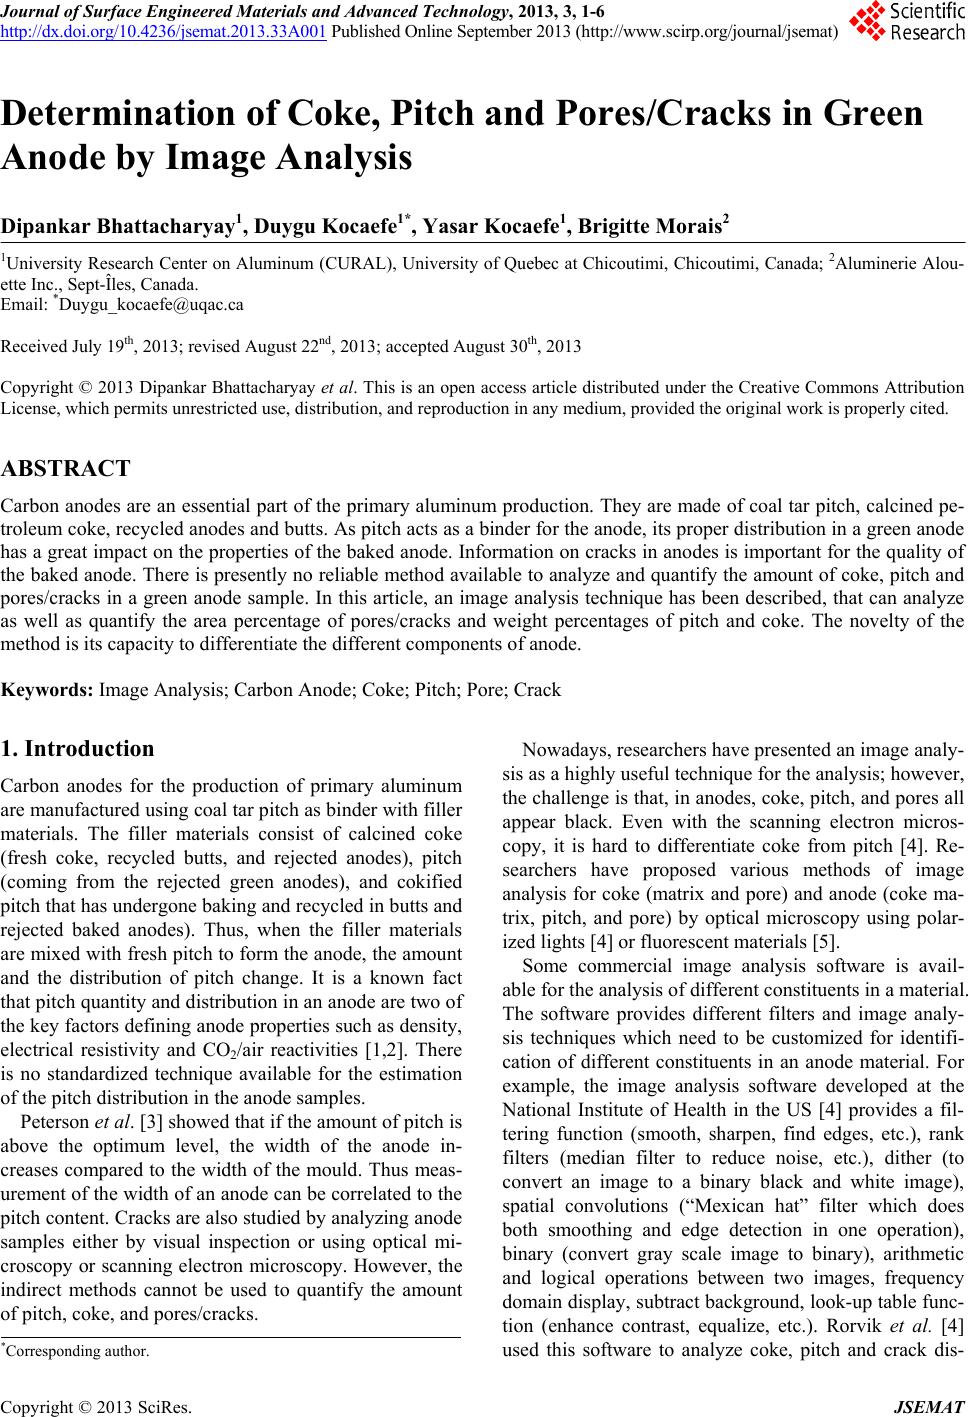
Sadler [7] has developed a method of estimating
cracks in baked anode samples using the optical micro-
scope. The principle of the analysis was that if a light is
applied at an angle of 30˚ with the surface of an anode
sample, the cracks will be clearly visible. Thus, the
cracks can be identified in a baked anode. However, coke,
pore, and pitch cannot be identified separately by this
image analysis technique.
Some researchers have applied image analysis tech-
nique to analyze pore distribution in coke samples. Ror-
vik et al. [5] proposed a method to analyze pores in coke
particles by impregnating the particles by a fluorescent
epoxy polymer. However, this method is hard to imple-
ment for anodes which contain pitch in addition to the
pores/cracks.
Qiao et al. [8] developed an image analysis technique
for analyzing pores in coke. They used Robert’s edge
detection algorithm followed by binarization and contrast
stretching to identify the pores. They used an edge detec-
tion algorithm to identify the boundaries of pores and
coke particles. As the pores appear more black compared
to the coke surface, the contrast stretching technique was
used to make the coke surfaces whiter. Then, a threshold
value was chosen below which everything was poring.
This method is hard to apply in the case of anodes as
pitch also creates edges. It is also worth mentioning that
pitch is black and its color is close to that of the pores,
which makes this technique more difficult to implement
in the case of anodes. Binarization can identify only two
constituents. Therefore, the method cannot be directly
applied for anodes.
This study focuses on the development of an image
analysis technique that can be used to analyze pitch, coke,
and pores/cracks distribution as well as to estimate the
area percentage of pores/cracks and the weight percent of
pitch and coke on the surface of a given green anode
sample. This is based on the analysis of an image of the
surface of an anode sample taken using the optical mi-
croscope and a light source from the side.
2. Materials and Methodology
2.1. Materials
A small cylindrical sample (diameter 50 mm and length
130 mm) from an industrial anode was used for the
analysis.
2.2. Methodology
Green anodes are composed of coke, pitch, and pores/
cracks. They all appear gray/black under white light.
Therefore, it is very difficult to differentiate the three
constituents. Moreover, the conventional methods rely on
the analysis of the equivalent gray image of a colored
image [4,6]. Any color can be expressed in terms of its
primary constituents, namely red (R), green (G), and blue
(B). The color scales can be expressed as integer values
in the range of 0 to 255 for red, green, and blue sepa-
rately. Thus 1.6 million (256 × 256 × 256) shades of
color can be differentiated based on their R, G, B com-
ponents. During the conversion of a color to its equiva-
lent gray tone, the converted grayscale image may lose
contrasts, sharpness, shadow, and structure of the color
image [9]. That is why, in this work, the RGB image of
the anode sample has not been converted to gray scale
for the analysis of different components present in the
anode sample.
2.3. Sample Preparation
A 1 cm × 1 cm anode sample was cut from the cylindri-
cal sample and was placed in a small mould made of
Teflon and was filled with epoxy resin mixed with an
amine hardener (15:1). After 24 hours, the sample was
taken out from the mould, and the surface containing the
sample was polished using Struers Tegrapol-35 to have a
smooth surface free from epoxy. The protocol proposed
by Stuers [4], a commercial supplier of sample prepara-
tion equipment, was used for polishing the samples.
2.4. Instrumentation
The samples were examined using a standard inverted
reflected light microscope (Nikon Eclipse ME 600 opti-
Copyright © 2013 SciRes. JSEMAT
Determination of Coke, Pitch and Pores/Cracks in Green Anode by Image Analysis 3
cal microscope), equipped with a motorized XY stage
and focus controller. The stage movement and focus
were controlled directly by commercial image analysis
software (Clemex Vision Professional Edition software).
A light source, incident at a specified angle, was used to
illuminate the surface. Digital images were acquired us-
ing Power HAD Sony (3 CCD) camera and the images
were saved using the Clemex Vision software. The zoom
was set to 50× and the exposure time was maintained at
1/65 s.
2.5. Image Analysis
The captured image was analyzed using a software de-
veloped with Visual Basic 6.0.
2.5.1. Identification of Pores/Cracks
The pores/cracks were identified based on the work of
Saddler [7]. If a light source is directed at the surface of
an anode sample in an oblique angle, the light cannot
enter significantly into the pores/cracks and creates a
shaded region. The closer the light source is to the hori-
zontal surface, the darker the pores/cracks appear com-
pared to the coke and the pitch on the sample surface.
The angle of incidence of the light on the green anode
surface was chosen as 65˚ (see Figure 1) with the nor-
mal.
For each pixel in the image of the anode surface, the R,
G, and B components were analyzed. Then, the threshold
values were chosen for the R, G and B components in
such a way that any pixel with R, G, and B components
less than the corresponding threshold values was consid-
ered a pore/crack. The R, G, B values for a black pixel
are 0, 0, 0 whereas, for a white one, they are 255, 255,
255. As the pores/cracks appear black, the threshold val-
ues should ideally be chosen close to zero. As some light
can always enter into the pores/cracks due to the oblique
incidence of the light source, the thresholds were chosen
to have higher values. The threshold was selected after
the analysis of different known anode samples.
2.5.2. Determination of the Position of Light
The angle of incidence of the light and its distance from
Figure 1. Angle of incidence of the light on a green anode
surface.
the anode sample were determined based on the differ-
ence in the average brightness indices of pitch and
pores/cracks, which is a measure of contrast. The color of
coke is significantly different from those of pitch and
pores/cracks; and the colors of pitch and pores/cracks are
close to each other. Thus, the identification of the con-
trast between pitch and pores/cracks are more critical for
the detection of pitch and pores/cracks in the anode sam-
ple. The luminescence index of a pixel is defined as
(299R + 587G + 114B)/1000 where R, G, and B denote
the red, green, and blue components of that pixel [10].
Web designers use this equation developed by the World
Wide Web Consortium (W3) to calculate the color con-
trast [11]. In order to determine the optimum position of
light source, the average values of brightness indices for
pitch and pores/cracks were determined from an image of
an anode sample where pores/cracks and pitch were
clearly distinguishable. The difference between the av-
erage brightness indices of pitch and pores/cracks as a
function of the distance as well as the angle of incidence
(with respect to the normal) of the light as a function of
the position of the anode sample under observation was
determined. The position at which the contrast was
maximum was used for the final analysis. These are dis-
cussed further below.
The angles of incidence used for the study were be-
tween 60˚ and 70˚ because the light ray was obstructed
by the lens of the microscope if a lower angle was used
whereas the light touched the base of the sample holder if
a higher angle was used. Regarding the distance, it was
not possible to get closer than 20 mm because, at that
distance, the shade of the light started to cover the lens of
the microscope.
2.5.3. Identification of Coke and Pitch
After the identification of pores/cracks, the remaining
pixels represent either coke (without pores) or pitch. By a
series of experiments, the threshold values of R, G and B
components were identified which can separate coke
from pitch from the sample image. After identifying coke,
all the remaining pixels will correspond to pitch. This
threshold is dependent on the distance, the angle of inci-
dence, color and the intensity of the light source.
For a given light source, these thresholds were calcu-
lated for known samples and later implemented for un-
known samples to identify pores/cracks, coke, and pitch.
2.5.4. Calculation of Area Percentage of Pores
If the number of pixels satisfying the criteria for pores/
cracks is NPC, for coke (without pore) NC, and for pitch
NP, then percentage of pores/cracks by area can be ex-
pressed as
100
PC
PC CP
N
NNN++ (1)
Copyright © 2013 SciRes. JSEMAT
Determination of Coke, Pitch and Pores/Cracks in Green Anode by Image Analysis
4
2.5.5. Calculation of Weight Percentage of Coke and
Pitch
The analysis of pixels gives results in area percentage of
coke, pitch or pore. However, it is more convenient to
express pitch and coke in terms of weight percentage
because it is used in the anode preparation recipe and is
better recognized by the industry. While calculating coke
and pitch, the problem with pitch is that it can be on the
coke surface or between two coke particles or within
pore or crack. This causes the under-estimation of coke
percentage since it hides the coke present just under this
pitch layer. Therefore, the following correction was used
to solve this problem. The pitch on the coke surface has
been identified as those pixels satisfying characteristics
of pitch but having at least one neighbor with properties
of coke. Though this is an approximation, it helps deter-
mine the weight percentage of pitch and coke in the sam-
ple close to their real weight percent. If the number of
this kind of pixels (yellow) is NP/C, then it can be as-
sumed that for (NC + NP/C) pixels of coke (without pores),
there are NP pixels of pitch. If ρ
C is the real density of
coke and ρ
P is the density of pitch, then the weight per-
centage of pitch (WP) can be expressed as:
()
/
100
PP
P
CPCCPP
N
WNN N
ρ
ρρ
=++ (2)
Thus, the weight percentage of coke (WP) will be
100-WP.
Though the calculation of weight percent has some
approximations, yet it gives a representative weight per-
cent of pitch in a green anode sample.
2.5.6. Software for the Identification of Coke, Pitch,
and Pores/Cracks
Identification of different components of coke was im-
plemented by developing an application software using
the Visual Basic 6.0. The point (x, y) method of the pic-
turebox object of the visual basic has been used to ana-
lyze the RGB components of each pixel from the picture
of the anode sample surfaces. After analyzing different
components based on the thresholds, pixels correspond-
ing to pores/cracks, coke and pitch were marked sepa-
rately.
3. Results and Discussions
Figure 2 shows the picture of the anode which was used
to study the effect of position of the light source.
Figures 3 and 4 show the effects of the distance and
the angle of incidence of light on the contrast, the differ-
ence in the average brightness indices of pitch and pores/
cracks, respectively. The distance was studied for a con-
stant angle of incidence of 70˚. As the highest contrast
was observed for a distance of 20 mm of the light from
400 μm
Figure 2. Sample image, taken by optical microscope, used
to study the position of light.
Figure 3. Effect of the distance of light on contrast between
pitch and pores/cracks.
Figure 4. Effect of the angle of incidence of light on contrast
between pitch and pores/cracks.
the position of the sample under observation, this dis-
tance was maintained later onto measure the angle of
incidence.
It can be observed from Figures 3 and 4 that the
maximum contrast is achievable with an angle of inci-
dence of 65˚ and at a distance of 20 mm. Thus, this posi-
tion was maintained for the light source for further
analyses of other images. Also, Table 1 shows the
thresholds used for the image analysis.
Copyright © 2013 SciRes. JSEMAT
Determination of Coke, Pitch and Pores/Cracks in Green Anode by Image Analysis 5
Table 1. The thresholds for the image analysis.
Threshold for pore Threshold for coke
R less
than
G less
than
B less
than
R greater
than
G greater
than
B less
than
15 40 90 20 10 73
Figure 5(a) shows the image of a green anode sample
taken by the optical microscope. Figures 5(b)-(d) show
the distributions of coke, pitch and pores/cracks sepa-
rately for the image given in Figure 5(a). From the im-
age analysis, the pore area was determined as 14.25%.
The weight percentages of pitch and coke were found as
13.83 and 86.17, respectively. Since the image analyses
give the area percentage which is assumed to be same as
the volume percentage, the weight percentages were cal-
culated assuming real densities of 1.32 g/ml for pitch and
2.06 g/ml for coke.
In order to compare with the percentages obtained
from the image analysis, the pores/cracks volume per-
centage was calculated for the sample. Coke at 86.23
wt% with a real density of 2.06 g/cc was mixed with
pitch at 13.77 wt% with a density of 1.32 g/cc to prepare
the anode sample.
Thus, the volume (without pores/cracks) of 100 g of
the anode sample
86.23 13.77
2.06 1.32
=+
= 59.29 ml.
And the real density of the green anode sample
100
59.29
=
= 1.91 g/ml.
The bulk density of the sample was measured as 1.64
g/ml.
Hence, the volume percentage of pores/cracks
1.64
11
1.91

=− ×


00
= 14.23.
The measured value with the current image analysis
software was 14.25, which compares favorably with the
experimental value of 14.23. The pitch weight percentage
measured with the current image analysis software was
13.83, which was very close to the experimental value
13.77. This shows that the results of the image analysis
method proposed in this article are in good agreement
with the experimental values.
The method worked successfully for the analysis of
other images taken with the optical microscope under
similar conditions. The novelty of the method is the ap-
plication of light source to distinguish pitch, coke, and
3000
μ
m
(a) (b)
3000
μ
m
(c) (d)
Figure 5. (a) Image of an anode sample taken with the opti-
cal microscope; Analysis of the sample shown in Figure 5(a):
(b) coke distribution; (c) pitch distribution; (d) pores/cracks
distribution.
pores/cracks on the surface of an anode sample. Table 2
gives the comparison of this method with other published
works.
4. Conclusion
A novel method of analyzing pitch, coke, and pores/
cracks in a green anode sample has been developed and
described. The uniqueness of the method is the use of a
light source to identify the three constituents in a green
anode sample. Though there are certain approximations,
effort has been made to calculate the weight percentage
of pitch and coke in the green anode sample. The results
are in good agreement with the actual amount of pitch
weight percentage in the anode samples. The percentage
area covered by pores/cracks has also been calculated.
The threshold values depend on the color and intensity of
light, the position of light, and the image capturing de-
vice. Thus, for a specific set of light inclined at a fixed
angle and for a specific camera, the thresholds will be-
come constant. Therefore, the system can be used to
analyze other green anode samples with the same settings
of the parameters, making the system sample-independ-
ent.
5. Acknowledgements
The technical and financial support of Aluminerie Alou-
ette Inc. as well as the financial support of the National
Copyright © 2013 SciRes. JSEMAT
Determination of Coke, Pitch and Pores/Cracks in Green Anode by Image Analysis
Copyright © 2013 SciRes. JSEMAT
6
Table 2. Comparison of current method with the published ones.
Method Identifies Application Reference
Identification of grain boundary,
contrast stretching, and binarization Pores in coke samples
Suitable for two constituents only, thus
not suitable for identification of coke,
pitch, and pores/cracks in anodes
[8]
Used fluorescent epoxy Pores in coke samples
Suitable for two constituents only, thus
not suitable for identification of coke,
pitch, and pores/cracks in anodes
[5]
Binarization Pitch in anode Suitable for large particles only using an
optical microscope [6]
Distance of color from average
color value for pitch Pitch, pore, and crack
Success depends on the choice of average
color value of pitch which can vary from
sample to sample
[4]
Light creates shadows at places of
cracks Cracks Not capable of identifying pitch and
coke, no quantitative estimation [7]
Application of light to identify pores
and cracks, threshold value to
identify coke and pitch
Pitch, coke, pore and crack
Capable of analyzing pore area
percentage and coke and pitch weight
percentage.
Present work
Science and Engineering Research Council of Canada
(NSERC), Développement économique Sept-Îles, the
University of Québec at Chicoutimi (UQAC), and the
Foundation of the University of Québec at Chicoutimi
(FUQAC) are greatly appreciated. The authors would
also like to thank Dr. Samir Sahli for his valuable sug-
gestions on the improvement of the efficiency of the
analysis.
REFERENCES
[1] E. R. McHenry, J. T. Baron and C. Krupinsci, “Develop-
ment of Anode Binder Pitch Laboratory Characterization
Methods,” Light Metals, 1998, pp. 769-774.
[2] J. Okada and Y. Takeuchi, “Dependence of the Density
and Other Properties of Bonded Carbon on the Binder,”
Fourth Conference on Carbon, 1960, pp. 657-669.
[3] R. W. Peterson and E. J. Seger, “Pitch Control of Pre-
baked Anodes by Slump Measurement,” Light Metals,
1980, pp. 443-454.
[4] S. Rorvik, A. P. Ratvik and T. Foosnaes, “Characteriza-
tion of Green Anode Materials by Image Analysis,” Light
Metals, 2006, pp. 553-558.
[5] S. Rorvik, H. A. Øye and M. Sørlie, “Characterization of
Porosity in Cokes by Image Analysis,” Light Metals,
2001, pp. 603-609.
[6] A. N. Adams, J. P. Mathews and H. H. Schobert, “The
Use of Image Analysis for the Optimization of Pre-Baked
Anode Formulation,” Light Metals, 2002, pp. 545-552.
[7] B. A. Sadler, “Diagnosing Anode Quality Problems Us-
ing Optical Microscopy,” Light Metals, 2012, pp. 1289-
1292.
[8] G. L. Qiao and S. Eser, “Digital Image Analysis of Opti-
cal Texture and Porosity of Petroleum Cokes,” 23rd Bi-
ennialConj on Carbon, University Park, Pennsylvania.
1997, pp. 933-937.
[9] C. Saravanan, “Color Image to Grayscale Image Conver-
sion,” Second International Conference on Computer En-
gineering and Applications (ICCEA), 2010, pp. 196-199.
[10] Y. M. Y. Hasan and L. J. Karam, “Morphological Text
Extraction from Images,” IEEE Transactions on Image
Process, Vol. 9, No. 11, 2000, pp. 1978-1983.
doi:10.1109/83.877220
[11] N. Vanderschantz, C. Timpany, D. Whitehead and W.
Carss, “A Small Scale Study into the Effect that Text &
Background Colour Has on Processing and Self-Correc-
tion Rates for Childrens’ On-Screen Reading,” Interna-
tional Journal of the Book, Vol. 7, No. 4, 2010, pp. 75-88.