 Intelligent Information Management, 2013, 5, 162-170 http://dx.doi.org/10.4236/iim.2013.55017 Published Online September 2013 (http://www.scirp.org/journal/iim) Bayesian and Frequentist Prediction Using Progressive Type-II Censored with Binomial Removals Ahmed A. Soliman1, Ahmed H. Abd Ellah2, Nasser A. Abou-Elheggag2, Rashad M. El-Sagheer3* 1Faculty of Science, Islamic University, Madinah, Saudi Arabia 2Mathematics Department, Faculty of Science, Sohag University, Sohag, Egypt 3Mathematics Department, Faculty of Science, Al-Azhar University, Cairo, Egypt Email: *Rashadmath@Yahoo.com Received June 30, 2013; revised July 27, 2013; accepted August 9, 2013 Copyright © 2013 Ahmed A. Soliman et al. This is an open access article distributed under the Creative Commons Attribution Li- cense, which permits unrestricted use, distribution, and reproduction in any medium, provided the original work is properly cited. ABSTRACT In this article, we study the problem of predicting future records and order statistics (two-sample prediction) based on progressive type-II censored with random removals, where the number of units removed at each failure time has a dis- crete binomial distribution. We use the Bayes procedure to derive both point and interval bounds prediction. Bayesian point prediction under symmetric and symmetric loss functions is discussed. The maximum likelihood (ML) prediction intervals using “plug-in” procedure for future records and order statistics are derived. An example is discussed to illus- trate the application of the results under this censoring scheme. Keywords: Bayesian Prediction; Burr-X Model; Progressive Censoring; Random Removals 1. Introduction In many practical problems of statistics, one wishes to use the results of previous data (past samples) to predict a future observation (a future sample) from the same population. One way to do this is to construct an interval which will contain the future observation with a specified probability. This interval is called a prediction interval. Prediction has been applied in medicine, engineering, business, and other areas as well. Hahn and Meeker [1] have recently discussed the usefulness of constructing prediction intervals. Bayesian prediction bounds for a future observation based on certain distributions have been discussed by several authors. Bayesian prediction bounds for future observations from the exponential dis- tribution are considered by Dunsmore [2], Lingappaiah [3], Evans and Nigm [4], and Al-Hussaini and Jaheen [5]. Bayesian prediction bounds for future lifetime under the Weibull model have been derived by Evans and Nigm [6,7], and Bayesian prediction bounds for observable having the Burr type-XII distribution were obtained by Nigm [8], Al-Hussaini and Jaheen [9,10], and Ali Mousa and Jaheen [11,12]. Prediction was reviewed by Patel [13], Nagraja [14], Kaminsky and Nelson [15], and Al- Hussaini [16], and for details on the history of statistical prediction, analysis, and applications, see, for example, Aitchison and Dunsmore [17], Geisser [18]. Bayesian prediction bounds for the Burr type-X model based on records have been derived from Ali Mousa [19], and Bayesian prediction bounds from the scaled Burr type X model were obtained by Jaheen and AL-Matrafi [20]. Bayesian prediction with Outliers and random sample size for the Burr-X model was obtained by Soliman [21], Bayesian prediction bounds for order statistics in the one and two-sample cases from the Burr type X model were obtained by Sartawi and Abu-Salih [22]. Recently, Ah- madi and Balakrishnan [23] discussed how one can pre- dict future usual records (order statistics) from an inde- pendent Y-sequence based on order statistics (usual re- cords) from an independent X-sequence and developed nonparametric prediction intervals. Ahmadi and Mir Mo- stafaee [24], Ahmadi et al. [25] obtained prediction in- tervals for order statistics as well as for the mean lifetime from a future sample based on observed usual records from an exponential distribution using the classical and Bayesian approaches, respectively. The rest of the paper is as follows. In Section 2, we present some preliminaries as the model, priors and the posterior distribution. In Section 3, Bayesian predictive distribution for the future lower records (two-sample pre- diction) is based on progressive type-II censored with *Corresponding author. C opyright © 2013 SciRes. IIM  A. A. SOLIMAN ET AL. 163 random removals. In Section 4, the ML prediction both point and interval prediction using “plug-in” procedure are derived. In Section 5, Bayesian predictive distribution for the future order statistics based on progressive type-II censored with random removals. In Section 6, the ML prediction both point and interval prediction using “plug- in” procedure for the future order statistics are derived. A practical example using generating data set Progressively type-II censored random sample from Burr-X distribu- tion, and a simulation study has been carried out in or- der to compare the performance of different methods of prediction are presented in Section 8. Finally we con- clude the paper in Section 8. 2. The Model, Prior and Posterior Distribution Let random variable X have an Burr-X distribution with Parameter . the probability density function and the cumulative distribution function of X are respectively 1 22 2 2exp1exp, ,0 ( )1exp,,0. fx xxxx Fxx x , (1) Suppose that denote a progressively type-II censored sample, where 12 112 2 ,,, ,,, mm xRxRx R x m Rr with pre-determined number of removals, say 112 2 the conditional likelihood function can be written as, ,,Rr, , mm R r 1 ;1 i mr ii i LxRrCfx Fx , (2) where 112 1 12,,m C nnrnr rnrr 11 0ii rnmr r 2,3,,1im i U p x 1m 1, and for , substituting (1), (2) into (3) we get 1 100 1 exp1 ln, m m r rm mi kk i Gk (3) where 112 1 1, 1ex m kk mii m r r GU kk . (4) If the parameter is unknown, from the In-likelihood function given by (3), the MLEs, MLE ˆˆ can be ob- tained by the following equations, 1 1001 lnln1 ln. m m r rm i kki mGk i U (5) The first derivative of ln with respect to is 1 1001 ln 1ln , m m r rm i kki mGk U setting ln 0 we get the maximum likelihood estimator of as the following 1 1 MLE 001 ˆ, 1ln m m r rm ii kki m Gk U (7) consider a gamma conjugate prior for in the form 1 π,exp,0,,0 . (8) From (3) and (8) the conditional posterior (pdf) of is given by 1 1 1 1 1 00 00 exp πx m m m m r rmk kk r rm k kk Gq mGq (9) where 1 1ln m ki i qk i U . 3. Bayesian Prediction for Record Value Suppose n independent items are put on a test and the lifetime distribution of each item is given by (2). Let 123 ,,,, m XX X be the ordered m-failures observed under the type-II progressively censoring plan with bi- nomial removals 1,, m RR, and that 1 12 be a second independent sample (of size m1) of future lower record observed from the same distribution (future sam- ple). Our aim is to make Bayesian prediction about the ,,, m YY Y , th then the marginal pdf of is given by see Ahmadi and Mir Mostafaee [24] is S V 1 log 1! s S V FY fY fY S (10) where 2 1 22 1exp , 2exp1 exp, s ss s FY Y fY YYY (11) 2 2 2 1exp, log, 2exp . 1exp sss ss s s UYq YY YY s U (12) Applying (11), (12) in (10) we obtain 1 exp . s S Ss Vss s q fYq Y S (13) i (6) Copyright © 2013 SciRes. IIM  A. A. SOLIMAN ET AL. 164 Combining the posterior density (9) with (13) and in- tegrating out we obtain the Bayes predictive density 1 1 1 1 0 1 00 00 d . , xx s m m m m sVs r rmS S ss ks kk r rm k kk fYf Y qY Gqq BSm Gq (14) The Bayesian prediction bounds for the future 1 , S Y 1, 2,, m are obtained by evaluating 1 Pr x S Yt for some given value of t1, It follows from (14) that 1 1 1 1 1 1 1 00 00 Prxxd , , m m m m SSs t r r ts kk r rm k kk YtfV Y GI Y BSm Gq (15) where 11 1 d. S s tss s mS tis q Y qq YY (16) The predictive bounds of a two-sided interval with cover 100% for the future lower record S, may thus obtained by solving the following two equation for the lower Y L and upper U bounds: 1 1 1 1 00 00 1, 2 , m m m m r r LS kk r rm k kk GI Y BSm Gq (17) and 1 1 1 1 00 00 1, 2 , m m m m r r US kk r rm k kk GI Y BSm Gq (18) where S Y and US Y are given by Equation (16). Now by using (14) the Bayesian point prediction of the future lower record values YS under SE (BS) and LINEX loss functions (BL) are given, respectively, as 1 1 1 1 0 1 00 00 d , , x m m m m sSs sBS r r s kk r rm k kk YYfVY GI Y BSm Gq (19) and 1 1 1 1 0 2 00 00 1Log expd 1Log , x m m m m sS s sBL r r s kk r rm k kk YcYfV c GI Y cBSm Gq Y (20) where 1 1 0 d, S ss ss mS is Yq YY qq Y (21) and 1 2 0 exp d. S ss ss mS is qcY YY qq Y (22) One can use a numerical integration technique to get the above integration, given by (21), (22). Special case: In special case it is important to predict the first unobserved lower record value . 1 When s = 1, in (17) and (18), the lower and upper Bayesian prediction bounds with cover Y of 1 Y are obtained from the numerical solution of the following equations 1 1 1 1 1 00 00 1, 2 1, m m m m r r L kk r rm k kk GI Y Bm Gq (23) and 1 1 1 1 1 00 00 1, 2 1, m m m m r r U kk r rm k kk GI Y Bm Gq (24) where 1L Y and 1U Y given by Equation (16), and solving the resulting equations numerically. 4. ML Prediction for Record Value The commonly used frequentist approaches such as the maximum likelihood estimate and the “plug-in” proce- dure, which is to substitute a point estimate of the un- known parameters into the predictive distribution are reviewed and discussed. In this section the ML prediction both point and interval using “plug-in” procedure for future lower record based on progressive type-II cen- sored sample defined by (2). By replacing in the mar- ginal pdf of S (13) by Vˆ which we can find it from the numerical solution of the Equation (7), then Copyright © 2013 SciRes. IIM  A. A. SOLIMAN ET AL. Copyright © 2013 SciRes. IIM 165 1 1 ˆˆ exp . s S Ss Vss s qOne can use a numerical integration technique to get the above integration, given by (32). YY S q (25) The ML prediction bounds for the future S are ob- tained by evaluating Y 2 Pr x S Yt 5. Bayesian Prediction for Order Statistics for some given value of t2, It follows from (25) that 1 2 2 1 PrxdIngamma; ,1 s SVss t Yt fYYtS S 2 (26) Order statistics arise in many practical situations as well as the reliability of systems. It is well-known that a sys- tem is called a k-out-of-m system if it consists of m components functioning satisfactorily provided that at least km components function. If the lifetimes of the components are independently distributed, then the lifetime of the system coincides with that of the 1thmk order statistic from the underlying distri- bution. Therefore, order statistics play a key role in stu- dying the lifetimes of such systems. See Arnold et al. [26] and David and Nagaraja [27] for more details concerning the applications of order statistics. where Ingamma is the incomplete gamma function defined by 12 ;,tt 1 12 12 2 0 Ingamma; , ˆ expd .,andlog1exp. t tt ztzztt (27) The predictive bounds of a two-sided interval with cover for the future lower record S, may thus ob- tained by solving the following two equation for the lower Y L and upper U bounds: 1 Ingamma; ,1, 2 s LS S 1 (28) and 11 Ingamma; ,1. 2 s US S (29) Suppose n independent items are put on a test and the lifetime distribution of each item is given by (2). Let 123 ,,,, m XX X be the ordered m-failures observed under the type-II progressively censoring plan with bi- nomial removals 1,, m RR , . m Y , and that 2 12 be a second independent random sample (of size m2) of fu- ture order statistics observed from the same distribution. Our aim is to obtain Bayesian prediction about some functions of ,,, m YY Y 2 12 Let ,,YY th Special case When S = 1, in (28) and (29), the lower and upper ML prediction bounds with cover of 1 are obtained from the numerical solution of the following equations: Y 1 1 Ingamma ;1,1, 2 L (30) and 1 1 Ingamma ;1,1. 2 U (31) The ML point prediction of the lower record value is given, from (25), as S Y 1 0 1 0 d ˆˆ expd . s sV ss sML SS sss s YYfYY qqYY S Y (32) Y be the ordered lifetime in the future sam- ple of m2 lifetimes. The density function of Y for given is of the form 21 1, s ms s ss hY D sFYFYfY s (33) where 2. m Ds s For the Burr-X model, substi- tuting (11) and (12) in (22), we obtain 21 22 0 12exp s ms lls sss l hY ms DsYY U l (34) Therefore, from (9) and (34), the Bayes predictive density function of Y will be (see Equation (35)). where and 22 0 1 ms ms l l l lDs Y, U 1 1 1 1 0 1 00 00 xxd log , m m m m ss r rm ks kk sr rm k kk fY hY Gqs lU lYm Gq (35) 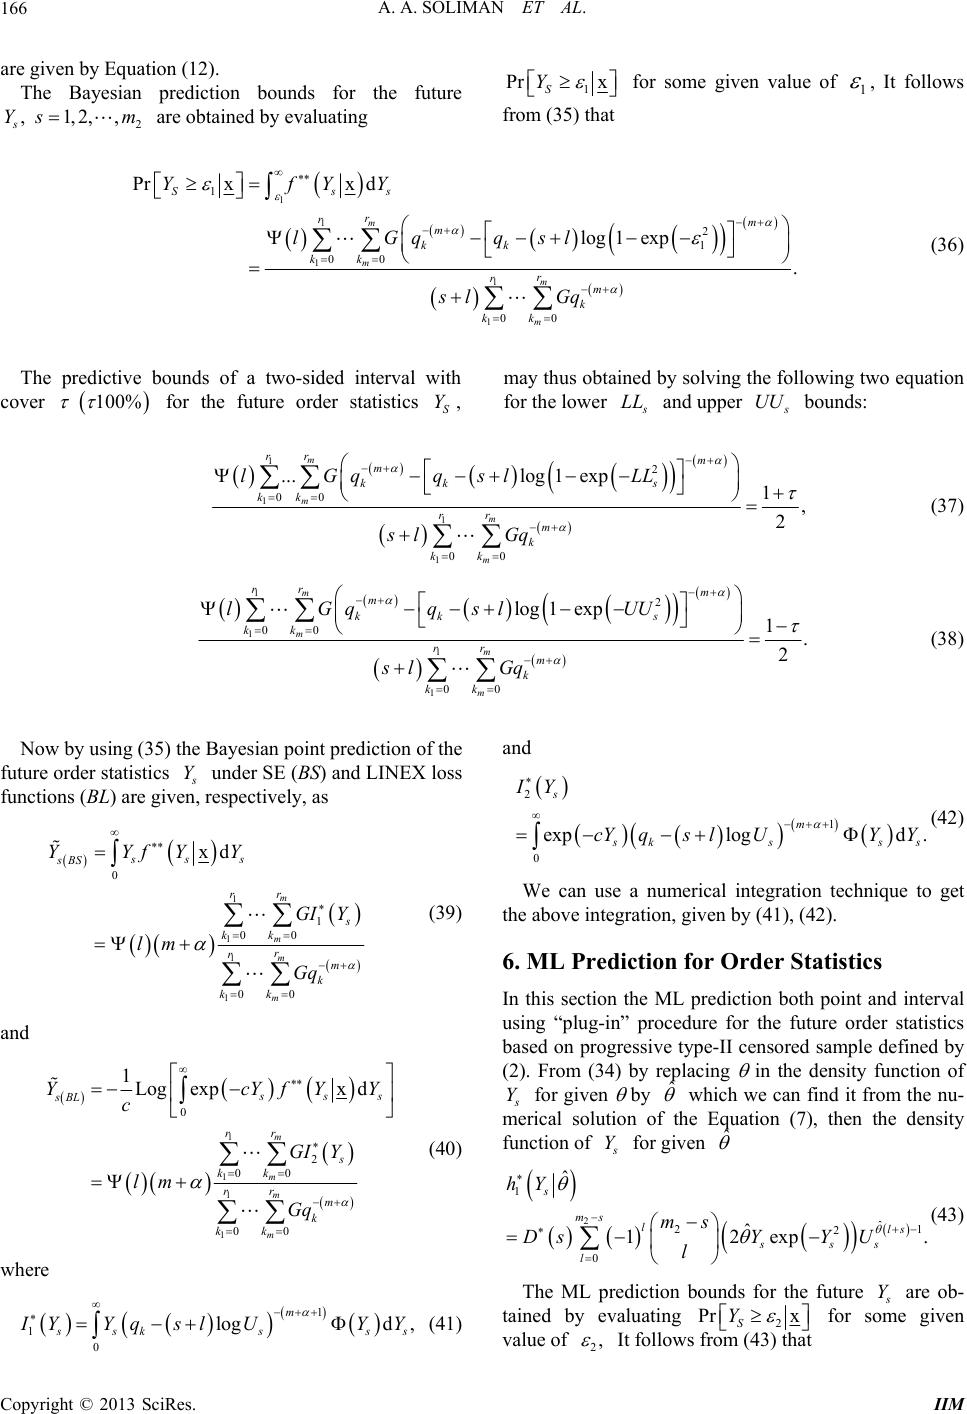 A. A. SOLIMAN ET AL. 166 are given by Equation (12). The Bayesian prediction bounds for the future are obtained by evaluating for some given value of 1 2 , 1,2,, s Ys m 1 Pr x S Y , It follows from (35) that 1 1 1 1 1 2 00 Prxx d log 1exp m m Sss r rm m kk r kk YfYY lGqqsl sl The predictive bounds of a two-sided interval with cover 100 m kk 1 . m rm k Gq (36) 100% for the future order statistics , may thus obtained by solving the following two equation for the lower S Y LL and upper UU bo unds: 1 1 1 1 2 00 00 k kk sl Gq ...log 1exp1, 2 m m m m r rm m kk s kk r rm lGqqsl LL (37) 1 1 1 1 2 00 00 log 1exp1. 2 m m m m r rm m kk s kk r rm k kk lGqqslUU sl Gq (38) Now by using (35) the Bayesian point prediction of the future order statistics Y n, res under SE (BS) and LINEX loss functions (BL) are givepectively, as 1 1 0 00 xd m m sss sBS r r 1 1 1 00 m m kk r rm k GI Y lm Gq kk YYfYY (39) and 1 1 1 1 0 2 00 00 1Logexpx d m m m m ss Y sB L r r s kk r rm k kk YcYfY c GI Y lm Gq (40) where 1 1 0 logd , m skss s IYYqslUY Y (41) and 2 0 explogd . s m 1 ks IY cYqs lUYY (42) ss We can use a numerical integration technique to get the above integration, given by (41), (42). 6. ML Prediction for Order Statistics In this section the ML prediction both point and in using “plug-in” procedure for the future order based on progressive type-II censored sample defined by (2). From (34) by replacing in the density function of terval statistics for given by ˆ h Ywhich we can find it from the nu- lution of t e Equation (7), then the density n of merical so functio foen r givˆ Y 2 1 ˆ1 22 0 ˆ ˆ 12exp s ms lls sss l hY ms .sYYU l D (43) The ML prediction bounds for the future Y are ob- tained by evaluating 2 Pr x S Y fore given value of som 2, It follows from (43) that Copyright © 2013 SciRes. IIM 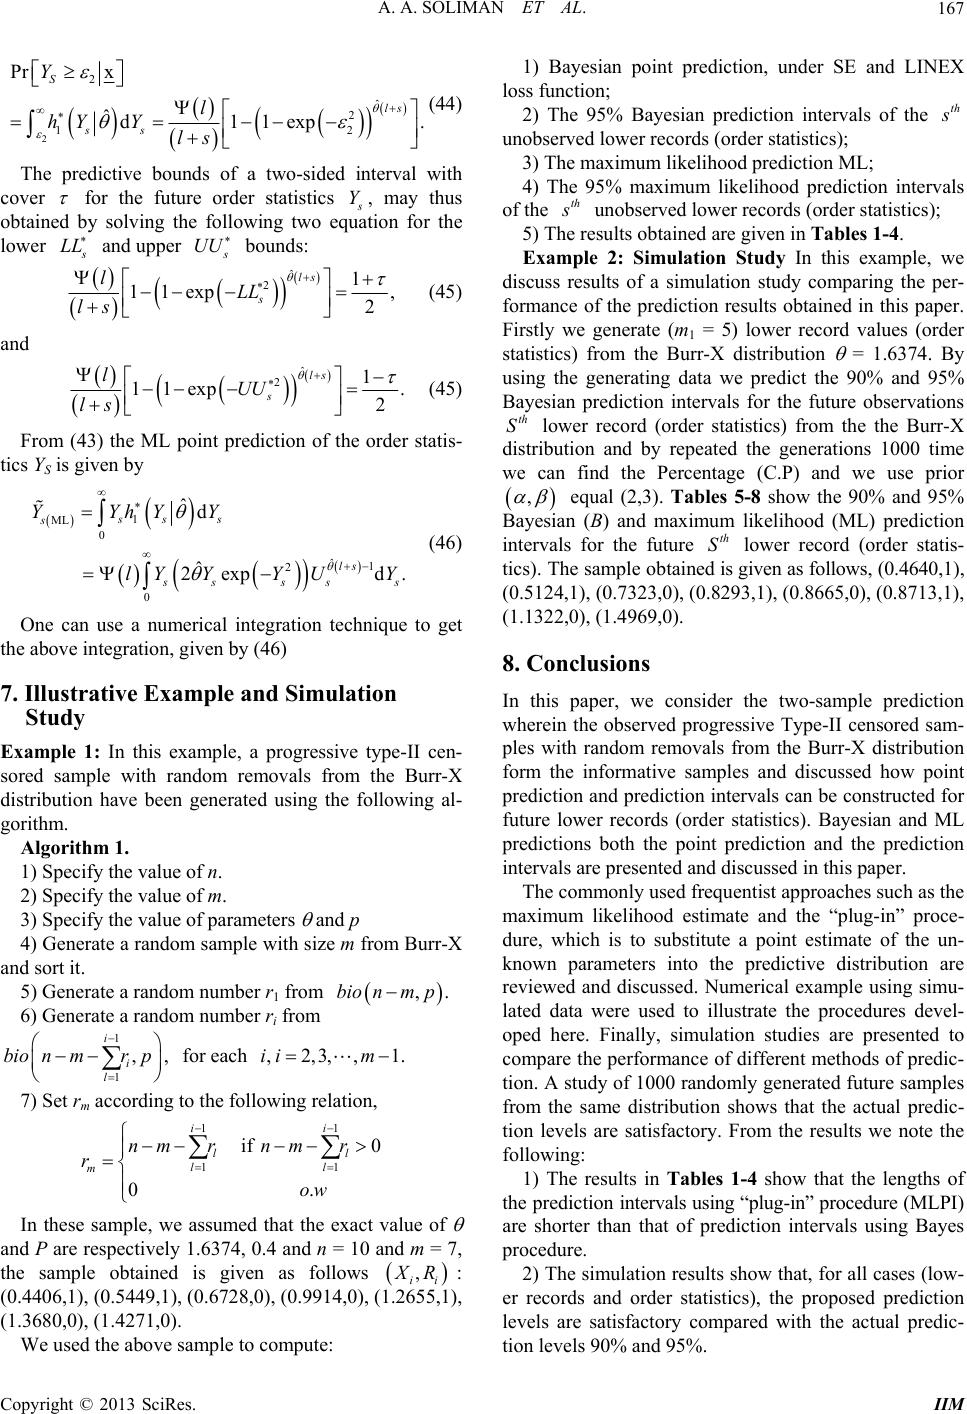 A. A. SOLIMAN ET AL. 167 2 2 ˆ 2 1 Pr x ˆd11exp S ls ss Y l hYY ls 2 . (44) The predictive bounds of a two-sided interval with cover for the future order statistics Y q , may thus obtaineby solving the following two euation for the d lower LL and upper UU bounds: ˆ 21 11exp , 2 ls s lLL ls (45) and ˆ 21 11exp . 2 ls s lUU ls (45) From (43 ML point) the prediction of the order statis- tics YS is given by ˆ1 2 0 ˆ 2exp. ls 1 ML 0 ˆd d ss s s ssss lY YY U One case a numerical integration tec YYhYY Y (46) n uhnique to get the above integration, given by (46) 7. Illustrative Example and Simulation Study E . Algorithm 1. 1) Specify the value of n. 2) Specify the value of m. Specify the value of parameters and p Generate a random sample with size m from Burr-X and sort it. 5) Generate a random number r1 from , for each . 7) Set rm according to the following relation, 1 the exact value of and P are respectively 1.6374, 0.4 and n = 10 and m = 7, xample 1: In this example, a progressive type-II cen- sored sample with random removals from the Burr-X distribution have been generated using the following al- gorithm 3) 4) ,.bio nm p 6) Generate a random number ri from 1 , i i bio nmrp 1l ,2,3,, 1ii m 1 11 if0 0. ii ll ll m nm rnm r r ow In these sample, we assumed that the sample obtained is given as follows , ii R (1.2655,1) : (0.0.5449,1), (0.6728,0), (0.9914,0), , 95% Bayesian prediction intervals of the 4406,1), ( (1.3680,0), (1.4271,0). We used the above sample to compute: 1) Bayesian point prediction, under SE and LINEX loss function; 2) The th unecords (order statistics); d prediction ML; elihood prediction intervals of observed lower r 3) The maximum likelihoo 4) The 95% maximum lik the th unobserved lower records (order statistics); Simulation Study In this example, we diparing the pe fo d in this paper. Firstly we generate (wer record values (order statistics) from the Burr-X distribution = 1.63. By usingenend 95% Bervations lower record (order statistics) from the the Burr-X ution and by repeated the generations 100 time we can find the Percentage (C.P) and we use prior 5) The results obtained are given in Tables 1-4. Example 2: scuss results of a simulation study comr- rmance of the prediction results obtaine m1 = 5) lo 74 g the rating data we predict the 90% a ayesian prediction intervals for the future obs th S distrib 0 , equal (2,3). Tables 5-8 show the 90% and 95% Bayesian (B) and maximum likelihood (ML) prediction intervals for the future th S lower record (order statis- tics). The sample obtained is given as follows, (0.4640,1), (0.5124,1), (0.7323,0), (0.8293,1), (0.8665,0), (0.8713,1), (1.1322,0), (1.4969,0). 8. In on ensored sam- stribution fo pr ate i n y. using “plug-in” procedure (MLPI) ediction intervals using Bayes results show that, for all cases (low- Conclusions this paper, we consider the two-sample predicti wherein the observed progressive Type-II c ples with random removals from the Burr-X di rm the informative samples and discussed how point prediction and prediction intervals can be constructed for fud MLture lower records (order statistics). Bayesian an edictions both the point prediction and the prediction intervals are presented and discussed in this paper. The commonly used frequentist approaches such as the maximum likelihood estimate and the “plug-in” proce- dure, which is to substitute a point estimate of the un- known parameters into the predictive distribution are reviewed and discussed. Numerical example using simu- ld data were used to illustrate the procedures devel- oped here. Finally, simulation studies are presented to compare the performance of different methods of predic- t o. A study of 1000 randomly generated future samples from the same distribution shows that the actual predic- tion levels are satisfactorFrom the results we note the following: 1) The results in Tables 1-4 show that the lengths of the prediction intervals are shorter than that of pr procedure. 2) The simulation er records and order statistics), the proposed prediction levels are satisfactory compared with the actual predic- tion levels 90% and 95%. Copyright © 2013 SciRes. IIM 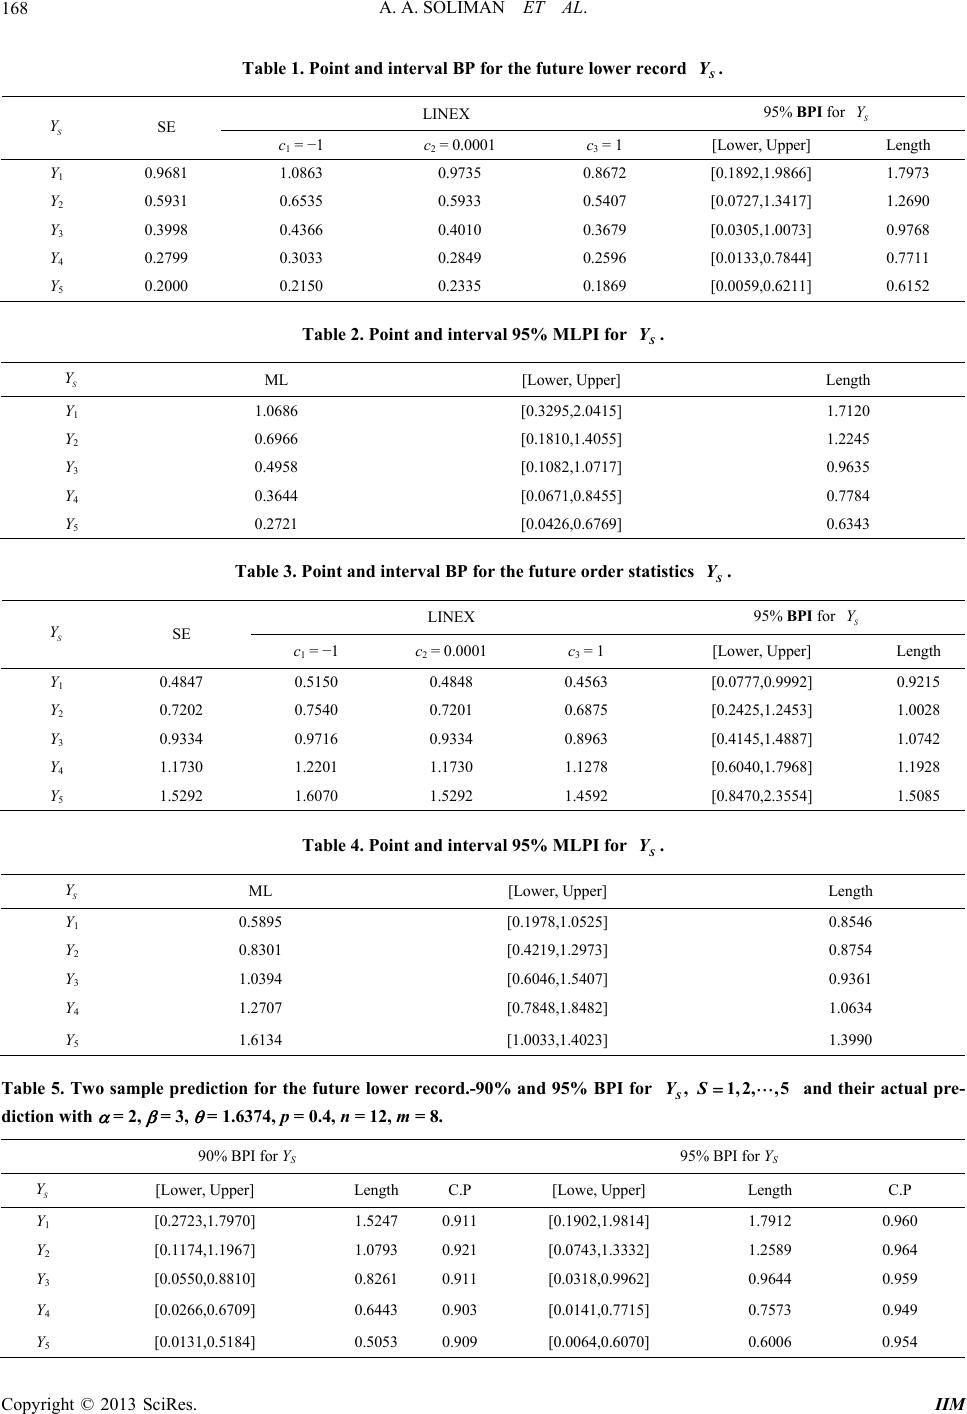 A. A. SOLIMAN ET AL. Copyright © 2013 SciRes. IIM 168 for Table 1. Point and interval BP LINEX the future lower record S Y. 95% BPI for S Y S Y SE c1 = −1 c2 = 0.00c01 3 = 1 [Lower, Upper] Length Y1 0.9681 1.0863 0.9735 0.8672 [0.1892,1.9866] 1.7973 Y2 0.5931 0.6535 0.5933 Y3 0.3998 0.4366 0.4010 Y4 0.2799 0.3033 0.2849 Y5 0.2000 0.2150 0.233 [0.0305,1.0073] 0.9768 5 0.5407 [0.0727,1.3417] 1.2690 0.3679 0.2596 [0.0133,0.7844] 0.7711 0.1869 [0.0059,0.6211] 0.6152 Table 2. Point and interva Length l 95% MLPI for S Y. S Y ML [Lower, Upper] Y1 1.0686 [0.3295,2.0415] 201.71 Y2 0.6966 [0.1810,1.1.2245 3 0.4958 [0.1082,1.0.9635 4 0.3644 [0.0671,0.0.7784 5 0.2721 [0.0426,0.0.6343 4055] Y0717] Y8455] Y6769] Tablet and intervae futuretatistics LINEX 95% BPI for S Y 3. Poinl BP for th order s. S Y S Y SE c[Lower, Upper] Length 1 = −1 c2 = 0.0001 c3 = 1 Y1 0.4847 0.5150 0.4848 [0.0777,0.9992] 0.9215 0.4563 Y0.7202 7540 0.7201 [0.2425,1.2453] 1.0028 Y0.9334 9716 0.9334 [0.4145,1.4887] 1.0742 Y1.1730 2201 1.1730 [0.6040,1.7968] 1.1928 Y1.5292 6070 1.5292 [0.8470,2.3554] 1.5085 2 0.0.6875 3 0.0.8963 4 1.1.1278 5 1.1.4592 Table 4. Point and interval 95 Length S Y. % MLPI for S Y ML [Lower, Upper] Y1 0.5895 [0.1978,1.0525] 0.8546 Y2 0.8301 [0.4219,1.0.8754 3 1.0394 [0.6046,1.0.9361 4 1.2707 [0.7848,1.0634 5 1.6134 [1.0033,1.3990 2973] Y5407] Y1.8482] Y1.4023] Table 5. Two sample pion for thre lower reco and 95% for d their actue- tion with = 2, = 3, 374, p = 0.4 = 12, m = 8. 90% BPI for YS 95% BPI for YS ,1,2,, S YS 5 anal prredicte futurd.-90% BPI = 1.6, n dic S Y [Lower, UppeLength C.P per] Length C.P r] [Lowe, Up Y1 [0.2723,1.791.5247 0.911 1.7912 0.960 70] [0.1902,1.9814] Y2 [0.1174,1.191.0793 0.921 1.2589 0.964 Y3 [0.0550,0.880.8261 0.911 0.9644 0.959 Y4 [0.0266,0.670.6443 0.903 0.7573 0.949 Y5 [0.0131,0.5184] 0.5053 0.909[0.0064,0.6070] 0.6006 0.954 67] [0.0743,1.3332] 10] [0.0318,0.9962] 09] [0.0141,0.7715] 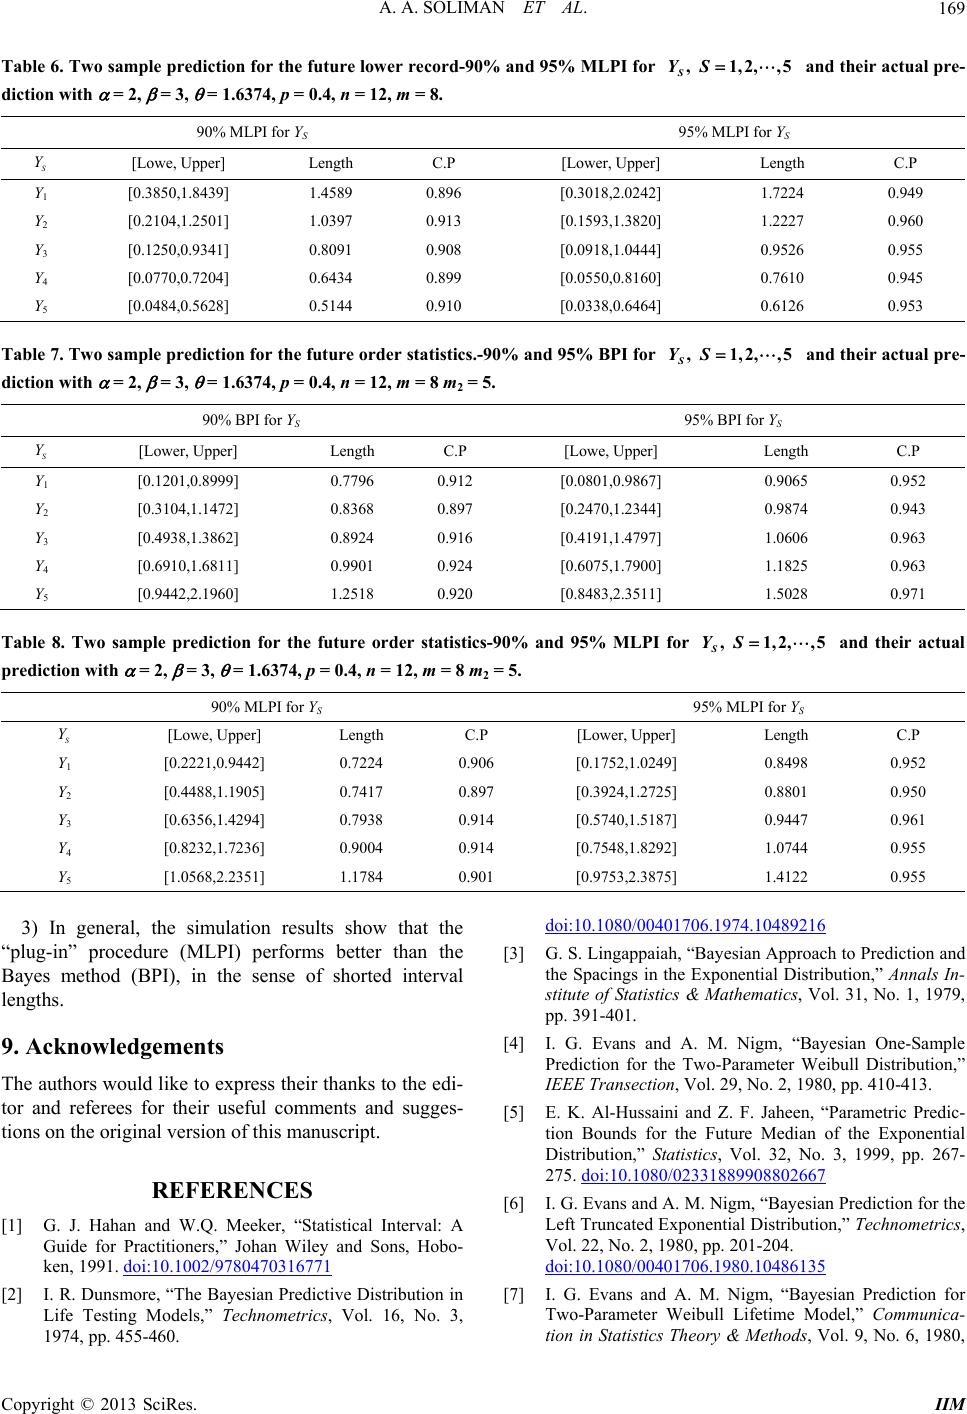 A. A. SOLIMAN ET AL. 169 Table 6. To sample predictioe future lower record-90%I for 5wn for th and 95% MLP ,1,2,, S YS anactual pre- iction with = 2, = 3, = 1.6374, p = 0.4, n = 12, m = 8. 95% MLPI for YS d their d 90% MLPI for YS S Y [L] Length C.owe, UpperP [Lower, Upper] Length C.P Y1 [0.3850,1.1.4589 0.896 [0.3018,2.0242] 24 0.949 8439] 1.72 Y221.0397 0.913 ] [0.10.8091 0.] [0.00.6434 0.] [0.00.5144 0.] [0.104,1.2501] [0.1593,1.38201.22270.960 Y3 250,0.9341] 908 [0.0918,1.04440.95260.955 Y4 770,0.7204] 899 [0.0550,0.81600.76100.945 Y5 484,0.5628] 910 [0.0338,0.64640.61260.953 Tab Two sample pe future tatis-90% andle 7.rediction for thorder stics. 95% BPI for ,1,2,, S YS 5 and their are- dictwith = 2, 4, p = 0.4, n = 8 5. 95% BPI for YS ctual p ion = 3, = 1.637 = 12, mm = 2 90% BPI for YS S Y [Lower, Upper] Length C.P [Lowe, Upper] LC.P ength Y11201,0.0.7796 0.912 [0.0801,0.9867] 0.952 [0.8999] 0.9065 Y2] 8 7 4 1 8 [0.3104,1.14720.8360.89[0.2470,1.2344] 0.9874 0.943 Y3 [0.4938,1.3862]0.8920.916[0.4191,1.4797] 1.0606 0.963 Y4 [0.6910,1.6811]0.9900.924[0.6075,1.7900] 1.1825 0.963 Y5 [0.9442,2.1960]1.2510.920[0.8483,2.3511] 1.5028 0.971 Table 8. Two san for thrder statistics-90% anor 5and their actual rediction with = 2, = 3, = 1.6374, p = 0.4, n = 12, m = 8 m = 5. 95% MLPI for YS mple predictioe future od 95% MLPI f , S YS 1,2,, p2 90% MLPI for YS S Y [Lowe, Upper] Length C.P [Lower, Upper] Length C.P Y1 [0.220.7224 0.906 [0.1752,1.0249] 98 0.952 2 5] 97 ] Y3 4] 4 ] Y4 6] 4 ] Y5 1] 1 ] 21,0.9442] 0.84 Y[0.4488,1.1900.74170.8[0.3924,1.2725 0.8801 0.950 [0.6356,1.4290.79380.91[0.5740,1.5187 0.9447 0.961 [0.8232,1.7230.90040.91[0.7548,1.8292 1.0744 0.955 [1.0568,2.2351.17840.90[0.9753,2.3875 1.4122 0.955 3) In generalon results show that plug-in” procedure (MLPI) performs better than the 9. Acknowledgemen The auwould like to eheir thanks to the edi- tor and referees foments and sugges tions oe originas manus RES ] G. J. Hahan an, “Statiserval: A , the simulatithe “ Bayes method (BPI), in the sense of shorted interval lengths. ts thors xpress t r their useful com- n thl version of thicript. EFERENC [1 d W.Q. Meekertical Int Guide for Practitioners,” Johan Wiley and Sons, Hobo- ken, 1991. doi:10.1002/9780470316771 [2] I. R. Dunsmore, “The Bayesian Predictive Distribution in Life Testing Models,” Technometrics, Vol. 16, No. 3, 1974, pp. 455-460. d1706.1974.16oi:10.1080/0040048921 [3] G. S. Lingappaiah, “Bayesian Approach to Prediction and xponential Distri stitute of Statistics & Mathematics, Vol. 31, No. 1, 1979, pp. 391-401. [4] I. G. Evans and Aayesian One-Sample PredTwo-Parameibull Dision,” IEEE Transectio, No. 2, pp. 410- [5] E. K.Z. F. J “Parametricedic- tione Future Median of the Ential Dis stics, Vol.. 3, 1999267- 275 33188990 7 the Spacings in the Ebution,” Annals In- . M. Nigm, “B iction for the eter Wtribut n, Vol. 29, 1980413. Al-Hussaini and Bounds for th aheen, Pr xpone tribution,” Stati 32, No, pp. . doi:10.1080/02880266 [6] I. G Nigm, an Predicr the Left Truncated Exponential Distribution,” Tech rics, Vol. 22, No. 2, 1980, pp. 201-204. 86135 . Evans and A. M.“Bayesition fo nomet doi:10.1080/00401706.1980.104 igm, “Bayesian Prediction for [7] I. G. Evans and A. M. N Two-Parameter Weibull Lifetime Model,” Communica- tion in Statistics Theory & Methods, Vol. 9, No. 6, 1980, Copyright © 2013 SciRes. IIM  A. A. SOLIMAN ET AL. 170 pp. 649-658. doi:10.1080/03610928008827909 [8] A. M. Nigm, “Prediction Bounds for the Burr Model,” Communicatio Methods, Vol. No. 1, 1988, p n in Statistics Theory & p. 287-297. 17, doi:10.1080/03610928808829622 [9] E. K. Al-Hussaini and Z. F. Jaheen, “Bayesian Prediction Bounds for Burr Type XI Model,” Communication in d Z. F. Jaheen, “Bayesian Prediction in the Presence of Sta- tistics Theory & Methods, Vol. 24, No. 7, 1995, pp. 1829- 1842. [10] E. K. Al-Hussaini an Bounds for Burr Type XII Distribution Outliers,” S tati stic al Planning and Infe rence, Vol. 55, No. 1, 1996, pp. 23-37. doi:10.1016/0378-3758(95)00184-0 [11] M. A. M. Ali Mousa and Z. F. Jaheen, “Bayesian Predic- tion Bounds for Burr Type XII Model Based on Doubly ic- eview,” Commu- tial Distribution of Mathematics and Censored Data,” Statistics, Vol. 48, No. 2, 1997, pp. 337- 344. [12] M. A. M. Ali Mousa and Z. F. Jaheen, “Bayesian Pred tion for the Two Parameter Burr Type XII Model Based on Doubly Censored Data,” Applied Statistics of Science, Vol. 7, No. 2-3, 1998, pp. 103-111. [13] J. K. Patel, “Prediction Intervals—A R nication in Statistics Theory & Methods, Vol. 18, No. 7, 1989, pp. 2393-2465. [14] H. N. Nagaraja, “Prediction Problems,” In: N. Balakrish- nan and A. P. Basu, Eds., The Exponen: Theory and Applications, Gordon and Breach, New York, 1995, pp. 139-163. [15] K. S. Kaminsky and P. I. Nelson, “Prediction on Order Statistics,” In: N. Balakrishnan and C. R. Rao, Eds., Handbook of Statistics, Elsevier Science, Amsterdam, 1998, pp. 431-450. [16] E. K. Al-Hussaini, “Prediction: Advances and New Re- search,” International Conference 21st Century, Cairo, 15-22 January 2000, pp. 25-33. [17] J. Aitchison and I. R. Dunsmore, “Statistical Prediction Analysis,” Cambridge University Press, Cambridge, 1975. doi:10.1017/CBO9780511569647 [18] S. Geisser, “Predictive Inference: An Introduction,” 15-425. Chapman and Hall, 1993. [19] M. A. M. Ali Mousa, “Inference and Prediction for the Burr Type X Model Based on Records,” Statistics, Vol. 35, No. 4, 2001, pp. 4 doi:10.1080/02331880108802745 [20] Z. F. Jaheen and B. N. AL-Matrafi, “Bayesian Prediction Bounds from the Scaled Burr Type X Model,” Computers and Mathematics, Vol. 44, No. 5, 2002, pp. 587-594. [21] A. A. Soliman, “Bayesian Prediction with Outliers and Random Sampel Size for the Burr Type X Model,” Mathematics & Physics Socity, Vol. 73, No. 1, 1998, pp. 1-12. [22] H. A. Sartawi and M. S. Abu-Salih, “Bayesian Prediction Applied Statistics, tics Bounds for Burr Type X Model,” Communication in Sta- tistics Theory & Methods, Vol. 20, No. 7, 1991, pp. 2307- 2330. [23] J. Ahmadi and N. Balakrishnan, “Prediction of Order Statistics and Record Values from Two Independent Se- quences,” Journal of Theoretical and Vol. 44, No. 4, 2010, pp. 417-430. [24] J. Ahmadi and S. M. T. K. Mir Mostafaee, “Prediction Intervals for Future Records and Order Statistics Coming from Two Parameter Exponential Distribution,” Statis Probability Letters, Vol. 79, No. 7, 2009, pp. 977-983. doi:10.1016/j.spl.2008.12.002 [25] J. Ahmadi, S. M. T. K. Mir Mostafaee and N. Balakrish- nanb, “Bayesian Prediction of Order Statistics Based on ourse in Order Statistics,” Wiley, New York, 1992. k-Record Values from Exponential Distribution,” Statis- tics, Vol. 45, No. 4, 2011, pp. 375-387. [26] B .C. Arnold, N. Balakrishnan and H. N. Nagaraja, “A First C [27] H. A. David and H. N. Nagaraja, “Order Statistics,” Wi- ley, New York, 2003. Copyright © 2013 SciRes. IIM
|