 Intelligent Information Management, 2013, 5, 150-161 http://dx.doi.org/10.4236/iim.2013.55016 Published Online September 2013 (http://www.scirp.org/journal/iim) Sensing Attributes of an Agile Information System Pankaj*, Micki Hyde, Arkalgud Ramaprasad Management Information Systems and Decision Sciences, Eberly College of Business & IT, Indiana University of Pennsylvania, Indiana, USA Email: *pankaj@iup.edu Received June 26, 2013; revised July 28, 2013; accepted August 9, 2013 Copyright © 2013 Pankaj et al. This is an open access article distributed under the Creative Commons Attribution License, which permits unrestricted use, distribution, and reproduction in any medium, provided the original work is properly cited. ABSTRACT Information Systems (IS) agility is a current topic of interest in the IS industry. The study follows up on the work on the definition of the construct of IS agility wh ich is defined as the ability of IS to sense a ch ange in real time; diagn ose it in real time; and select and execute an action in real time. It explores the attributes for sensing in an Agile Information System. A set of attributes was initially derived using the practitioner literature and then refined using interviews with practitioners. Their importance and validity were estab lished using a survey of the indu stry. All attributes derived from this study were deemed pertinent for sensing in an agile information system. Dimensions underlying these attributes were identified using Exp loratory Factor Analysis. This list of attributes can form the basis for assessing and establish- ing sensing mechanisms to increase IS agility. Keywords: Information Systems Agility; Agile Information Systems; Sensing; Sensing Attributes 1. Introduction Change is the rule of the game in the current business environment. The rate of change has been continuously increasing due to factors like globalization and opportu- nities presented by the development and evolution of technologies. Not only are the changes occurring at an increasing rate, but they are becoming increasingly un- predictable. This unpredictability can involve when a known change will occur, what an unknown change will look like, or the combination of these. The rapid rate of change implies that an organization needs to become an expert at changing and morphing itself rapidly in re- sponse to a change. Retention of leadership positions re- quires that an organization should be able to change at will in any direction, without significan t cost and time, to counter a threat or capitalize on an opportunity. Such an organization may be characterized as an agile organiza- tion. For most organizations the survival and/or retention of market share demands that the organization should be able to change faster than, or as fast as, new entrants and rivals. Information Systems (IS) pervade all aspects of mod- ern organizational functioning and play an integral role in information processing activities of an organization. Information Systems are needed for organizational agil- ity on account of their ability to provide shared, distrib- uted and integ rated, current, and fast flowing info rmation [1-7]. Modern business processes in organizations use IS as a core resource or component. In many cases (like ecom- merce), IS may completely embed a business process (e.g., Internet banking). The pivotal role of IS in modern organizational business processes means that an agile organization cannot change its business processes unless the IS changes as well. Thus an agile organization would need an agile IS. What Brandt and Boynton [8] indicated in 1993 still holds true—that current IS are not easy to change. Markets change but IS do not. Though many more organizations are experimenting with Agile Devel- opment methods, most IS have been developed and are still being made to cover a closed set of requirements using the waterfall development methodology. The per- formance of an IS is also optimized for these require- ments. The result of this optimization is that IS changes are often arduous and complicated, especially in cases where the requirements were not explicitly foreseen by the designers. But such requirements are frequent in to- day’s environment. Problems in changing an IS are fur- ther aggravated by other factors such as outsourcing, where the knowledge of the IS primarily resides outside the organization. The inability of IS to change fast im- pedes organizationa l agility. Th e challenge for an organi- zation is to structure its IS to meet a variety of changing *Corresponding author. C opyright © 2013 SciRes. IIM  PANKAJ ET AL. 151 requirements, many of which are not even known when the information systems are built. 2. The Construct of Information Systems Agility Agility in general is defined [9,10] as a formative con- struct comprised of the ability of an information to sense a change, diagnose a change, select a response, and exe- cute the response in real-time: 1) Sense: Ability to sense the stimuli for change (as they occur) in real-time; 2) Diagnose: Ability to interpret or analyze stimuli in real-time to determine the nature, cause, and impact of change; 3) Respond: Ability to respond to a change in real- time, further disaggregated into select and execute: a) Select: Ability to select a response in real-time (very short planning time) needed to capitalize on the opportunity or coun ter the threat. b) Execute: Ability to Execute the response in real- time. Real-time is defined as the span of time in which the correctness of the task performed not only depends upon the logical correctness of the task performed but also upon the time at which the result is produ ced. If the tim- ing constraints of the system are not met, system failure is said to have occurred [11]. Thus an Agile IS may be defined as one that has the ability to sense a change in real-time, diagnose the change in real-time, select a re- sp on se in r e al -ti me , and execute the response in real-time. Due to the formative nature of the construct several, or some, of these abilities might exist. 3. Sources of Change in Information Systems IS needs to change continuously. There are several mo- tivators for an IS change. IS may change on account of internal changes, organizational changes, and/or environ- mental changes. IS forms the core of information proc- essing in modern organizations. IS has to continuously improve its performance to improve organizational per- formance, thus requiring continuous changes. Such chan- ges to the IS are termed as internal changes in this study. In modern organizations, IS and business processes are tightly coupled [12]. Business processes have to change in response to changes in the environment or change in organizational strategy. A change in the business-process will require a change in the IS. Conversely, an IS’s abil- ity to change may permit or prohibit changes in busi- nessprocesses. An IS has to change to enable changes in business processes. Such changes are termed as organ- izational changes. Environmental changes may impact an IS directly and warrant change. Issues such as techni- cal compatibility with suppliers, customers, and other partners; termination of support for obsolete technolo- gies; upgrade of the hardware and software products; increase in viruses and cyber-attacks; changes in licens- ing terms; etc. pose a requirement for changes in IS. Such changes are termed as e nvironmental changes. 4. Information Systems IS in this study are restricted to computer-based informa- tion systems and we categorize IS components into hu- man and IT components [13] operating within an organ- izational context (refer to Figure 1). This is a simplistic definition of an IS and is used in this research to put a boundary around the domain of interest, since IS in their holistic view can be all encompassing. Several alterna- tive ways of classifying components like having a data- base component and/or including storage in hardware is possible. Each has its own merits and advantages. The organizational context for an IS may be described in different ways depending upon the purpose of the re- search question. This research borrows from the work of Ein-Dor and Segev [14] to further elaborate on the issue of organizational context. Organizational context may be viewed as a combination of uncontrollable, partially con- trollable, and controllable factors. Controllable factors are those whose status is given with respect to IS and include organizational size, organizational structure, or- ganizational time-frames, and extra-organizational situa- tions. The partially controllable factors are those whose change can be affected by the IS in many situations like organizational resources, organizational maturity, and the psychological climate in the organization. Controllable factors are those for which changes can be affected by the IS like rank and location of the top IS execu tives, an d existence of a steering committee. Organizational poli- cies and rules also play an important part as they control and guide all organizatio nal actions and imperatives. The human component of IS consists of the IS staff responsible for planning, development, operation, and maintenance of the IS. The human IS component should have four types of knowledge and skills. These are tech- nology management knowledge and skills; business and functional knowledge and skills; interpersonal and man- agement skills; and technical knowledge and skills [15]. The IT component consists of the computing, storage, Information Technology Component Hardware Networking Storage Software Human Component IS Personnel Figure 1. A model of information systems. Copyright © 2013 SciRes. IIM  PANKAJ ET AL. 152 and networking equipment, and software that runs on this equipment. The absence of data as an explicit component may be seen as an issue. The rationale for not providing data as an explicit component is that data is a contextual component rather than an independent component and can be subsumed in software and storage. The logic of the business processes is embedded into the configura- tion of IT components. The human component of the IS is responsible for embedding or programming this logic and associated data into the IT components. 5. Research Approach and Objectives Though there is a lot of discussion of agility in the cur- rent practitioner literature, theories in the area o f IS agil- ity are in early formative stages (see [16] for theory building). IS agility is also an area where practitioners have taken the lead. In the practitioner literatu re, IS agil- ity is equated to a set of technologies that enable seam- less interconnection and collaboration between the IT components to achieve rapid configuration changes. The conceptualization of IS agility as proposed in this study is much broader and more comprehensive in scope. This study therefore aims to fulfill the following objectives: 1) Arrival at a conceptualized set of attributes for sensing in an agile IS. (Similar work for diagnosis and execution will be presented in subsequent manuscripts due to considerations of length). 2) Refine the conceptualized set of attributes for sens- ing in an agile IS based on the feedback from practitio- ners. 3) Verify if the attributes for sensing in an agile IS as conceptualized in this study provide a comprehensive set of attributes for sensing for IS agility through a survey. 6. Sensing in an Agile Information System The human and IT components of an agile IS have sev- eral attributes which allows the IS to sense, diagnose, and respond to internal, organizational, and environmental changes in real time. These changes may be in either of two components of an IS. A comprehensive list of attrib- utes of an agile IS will include attributes relevant to sensing, diagnosing, and implementing a change in the human and IT components of IS due to organizational, external, and internal changes. We use sensing in the same meaning as understood in control theory. Sensing means that relevant signals are received and the information on the level/measure of parameter(s) with which the signal is concerned, is re- corded. Signals come from everywhere [17]. The ability to receive signals is contingent upon several factors. Phy- sical limitations of the receiver may limit what signals are received [18]. Also, the perceptual limitations of the living and social entities [17,19] may pose various limi- tations. As such, an IS should employ a wide variety of sensors that include machines, living entities, and social entities to sense the stimuli. Sensing a change is an im- portant ability. Ability to correctly sense the relevant parameters is a prerequisite to recognizing a shift in them. Accurate and timely sensing is especially important in cases where the state/position of the IS has to shift con- stantly to meet the stated perfor mance goals. Sensing requires a plan for measurement/monitoring of relevant parameters to avoid information overload and a waste of resources. This set of relevant parameters will be different for different organizations. Objective meas- urement of the parameters is highly desirable, e.g., the percentage of fragmentation for a disk, etc. However, in many instances, subjective sensing by humans is helpful and should be used. Though sensing by humans and oth- er social entities may be subject to various biases [20], it has its benefits. The sensing in social entities can be ex- panded (hypothetically in an infinite fashion) through addition of members with different and additional capa- bilities [20]. Stimuli in subjective sensing may be user- reported problems, observations by experts in the various organizational functions, customers, suppliers, and/or other external parties. Some signals may be sensed both objectively and subjectively. Sensing may happen in a proactive mode or in a reactive mode. In the proactive mode stimuli that precede the change are sought so that a change can be anticipated, while in the reactive mode, stimuli that result from the change are sensed. An agile IS may have both objective and subjective mechanisms for proactive and reactive sensing. 7. Attributes for Sensing in an Agile IS Due to paucity of the peer reviewed academic literature in the area of sensing for IS agility, most attributes have been derived from a survey of practitioner literature (about 250 in number) and the consulting experiences of the authors. Some academic articles in the area of IS flexibility (e.g. [21,22 ]) were also referenced. Since stimuli may come from various sources, the IS staff needs to be cognizant of the possible sources of stimuli to set up sensing mechanisms to sense change s in IT and human (themselves) components. Since the IS function has limited resources and cannot possibly moni- tor all sources of stimuli, only some sources may be monitored continuously while others may be monitored on an as-needed basis and/or based on the judgment of the IS staff, and rules, and policies of the organization. To sense a change in the business processes, good in- terfaces between IS and the different business units are needed. These interfaces allow the IS to sense the stimuli from anticipated and currently occurring changes in business processes, and rules and policies. Select IS staff should have an in-depth knowledge of the business and Copyright © 2013 SciRes. IIM  PANKAJ ET AL. 153 its operations. All IS staff should have a basic level of kno wl ed ge of the business and its operations. Thi s k no wl - edge can enable the IS staff to sense a change in the business as a matter of routine observation. While some changes may be sensed through observation, other chan- ges may need more detailed information of the business operations and may be sensed by the IS staff only when they are up to date on the current state of affairs in the various business units. This may be achieved through open and regular communication between the IS function and the business units. Open communication and busi- ness knowledge enables the IS staff to sense change on a continuing basis. Communication and work with other business units requires an adequate lev el of interpersonal skills in the IS staff and their ability to work in cross- functional teams. All business process changes occur in the context of the overall business plan and strategic di- rection of business units and the organization. Knowl- edge of this context and how it is evolving is an impor- tant input to sensing. The IS staff should therefore be involved in the business planning at some level, at least as observers. The stimuli for changes are also provided through di- rect input from end users, buyers, suppliers, and other partners that may use the IS. All these sources are outside the IS function and hence can provide signals on aspects of IS functioning that may not be discernible from within the IS function. There are three sources of these inputs. They are change-requests for applications, queries to the helpdesk for support, and requests for ad-hoc reports. The business-process logic is implemented through IT components like software programs and applications. Requests to alter application functionality, add function- ality, and fix bugs in the application software are made on a regular basis. A formal change-management proce- dure logs these requ ests. This log of the requests captur es the stimuli that may be employed for further analysis. Users of an IS need support o n the use of IS. These su p- port queries are answered by a helpdesk. These helpdesk queries may indicate a need for change in the IS. A for- mal log of these he lpdesk queries captures the stimuli for further analyses. The final direct input from users that may serve as stimuli is requests for ad-hoc reports. Ad- hoc reports provide users with information that is not produced by the IS on a regular basis. The number and pattern of such reports may indicate a need for change in the IS. A formal log of these requests may serve as a sti- mulus for change. Data warehouses and data marts allow users to pose ad-hoc queries to retrieve information which may not be obtain ed from the regular transaction al reports. These queries akin to the ad-hoc report requests may contain signals of possible changes that are needed. A formal log of these queries may be maintained. Various IS, like the online transaction processing sys- tems (OLTP), enterprise resource planning systems (ERP), and business intelligence systems (BI), produce reports on the operations conducted by the organization. These reports provide a detailed picture of the operations of the organization, using moving averages, past summa- ries, thresholds, variances and other figures that may in- dicate changes in the business operations. The applica- tion portfolio in an IS should provide such management reports that serve as stimuli for changes in business that would trickle down to the IS. The IT components in an IS should be continuously monitored and appropriate logs generated. These logs may point to possible changes occurring in the IT com- ponents. Most IT components have a predefined set of parameters that are recommended to be monitored and logged. At a minimum, an IS should log these parame- ters. Most IT components in an organization are sourced from vendors. A good liaison and open communication with the vendors ensures that detailed information on possible changes to the IT components and associated services is passed on to the IS staff. In complex modern IS this information may constitute the primary stimuli indicating major and complex changes in the IT compo- nents not attributable to internal changes. For the human component of IS, a periodic as well as ad-hoc assessment of technology management knowl- edge and skills; business and functional knowledge and skills; interpersonal and management skills; and techni- cal knowledge and skills, may be undertaken either in- formally or formally to sense a change. Such an assess- ment may be undertaken internally or externally. Peri- odic internal assessment may be done as part of the for- mal annual IS strategic planning process. Environmental developments may directly impact the IS. IS staff should actively scan the environment for new technical developments in IS products and processes; the use of existing and new technologies to solve business problems; and ways in which IS are being used in peer organizations. These environmental developments pro- vide signals for changes in business processes and IT, leading to changes in IS. The attributes relevant to sens- ing changes in IS are described in Table 1. Refining Attributes for Sensing in an Agile IS Attribute refinement was done through interviews with ten IS executives. Interviews were conducted to obtain their opinion on, and validation of, various aspects of IS agility including sensing. The IS executives targeted were involved with both business and technological as- pects of IS and could give a balanced perspective on dif- ferent aspects of an agile IS ranging from organizational rules and policies to IT components. As per Bonoma’s verification guidelines [23], multiple interviews were proposed fo r purposes of literal replication. The selectio n Copyright © 2013 SciRes. IIM 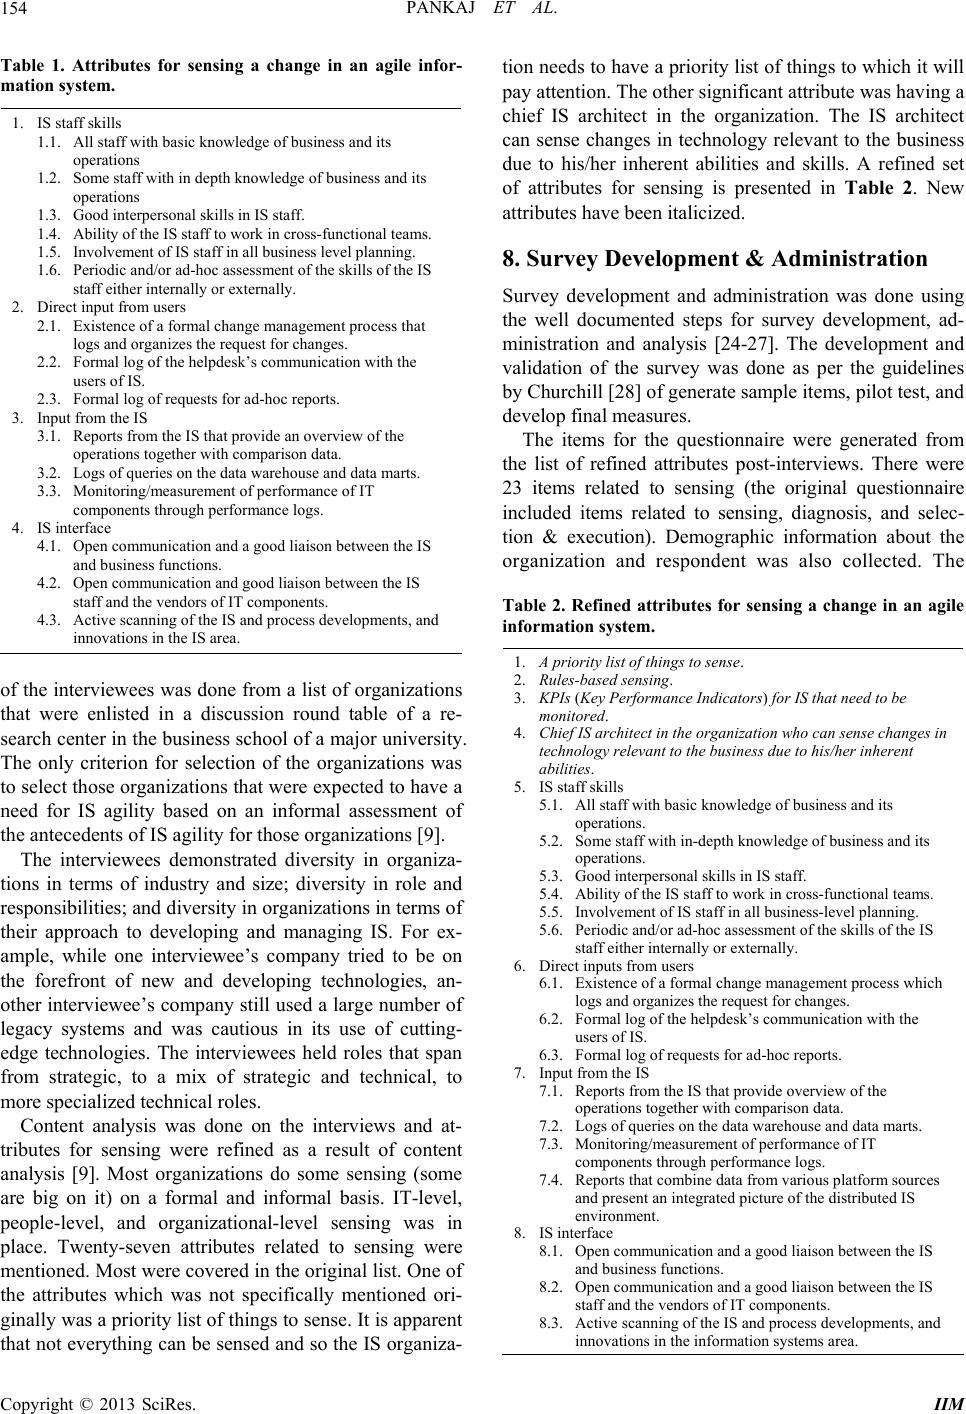 PANKAJ ET AL. 154 Table 1. Attributes for sensing a change in an agile infor- mation system. 1. IS staff skills 1.1. All staff with basic k n o w l edge of business and its operations 1.2. Some staff with in depth knowled ge of b usi nes s a nd its operations 1.3. Good interpersonal skills in IS staff. 1.4. Ability of the IS staff to work in cross-functional teams. 1.5. Involvement of IS staff in all bu s i n e ss level planning. 1.6. Periodic and/or ad-hoc assessment of the skills of the IS staff either internally or externally. 2. Direct input from users 2.1. Existence of a formal change management process that logs and organizes the request for chang es. 2.2. Formal log of the helpdes k’s communication with the users of IS. 2.3. Formal log of re quests for ad-hoc reports. 3. Input from the IS 3.1. Reports from the I S t hat provide an overview of the operations together with comparison data. 3.2. Logs of queries on the data warehouse and data marts. 3.3. Monitoring/measureme nt of performance of IT components through performance logs. 4. IS interface 4.1. Open communication a nd a go od l iai son between the IS and business functions. 4.2. Open communication a nd g ood liaison between the IS staff and the vendors of IT components. 4.3. Active scanning of the IS and proce ss d evel opments, and innovations in the IS are a . of the interviewees was done from a list of organizations that were enlisted in a discussion round table of a re- search center in the business school of a major university. The only criterion for selection of the organizations was to select those organizations that were expected to have a need for IS agility based on an informal assessment of the antecedents of IS agility for those organizations [9]. The interviewees demonstrated diversity in organiza- tions in terms of industry and size; diversity in role and responsibilities; and diversity in organizations in terms of their approach to developing and managing IS. For ex- ample, while one interviewee’s company tried to be on the forefront of new and developing technologies, an- other interviewee’s company still used a large number of legacy systems and was cautious in its use of cutting- edge technologies. The interviewees held roles that span from strategic, to a mix of strategic and technical, to more specialized technical roles. Content analysis was done on the interviews and at- tributes for sensing were refined as a result of content analysis [9]. Most organizations do some sensing (some are big on it) on a formal and informal basis. IT-level, people-level, and organizational-level sensing was in place. Twenty-seven attributes related to sensing were mentioned. Most were cov ered in the or iginal list. One of the attributes which was not specifically mentioned ori- ginally was a priority list of things to sense. It is app arent that not everything can be sensed and so the IS organiza- tion needs to have a priority list of things to which it will pay attention. The other significant attribute was having a chief IS architect in the organization. The IS architect can sense changes in technology relevant to the business due to his/her inherent abilities and skills. A refined set of attributes for sensing is presented in Table 2. New attributes have been italicized. 8. Survey Development & Administration Survey development and administration was done using the well documented steps for survey development, ad- ministration and analysis [24-27]. The development and validation of the survey was done as per the guidelines by Churchill [28] of generate sample items, pilo t test, and develop final measures. The items for the questionnaire were generated from the list of refined attributes post-interviews. There were 23 items related to sensing (the original questionnaire included items related to sensing, diagnosis, and selec- tion & execution). Demographic information about the organization and respondent was also collected. The Table 2. Refined attributes for sensing a change in an agile information system. 1. A priority list of things to sense. 2. Rules-based sensin g. 3. KPIs (Key Performance Indicators) for IS that need to be monitored. 4. Chief IS architect in the organiz ation who can sense changes in technology relevant to the bu si nes s d ue to his/her inherent abilities. 5. IS staff skills 5.1. All staff with basic k n o w l edge of business and its operations. 5.2. Some staff with in-depth knowledg e of business and its operations. 5.3. Good interpersonal skills in IS staff. 5.4. Ability of the IS staff to work in cross-functional teams. 5.5. Involvement of IS staff in all bu s i n e ss-level planning. 5.6. Periodic and/or ad-hoc assessment of the skills of the IS staff either internally or externally. 6. Direct inputs from users 6.1. Existence of a formal change management process which logs and organizes the request for chang es. 6.2. Formal log of the helpdes k’s communication with the users of IS. 6.3. Formal log of re quests for ad-hoc reports. 7. Input from the IS 7.1. Reports from the I S t hat provide overview of the operations together with comparison data. 7.2. Logs of queries on the data warehouse and data marts. 7.3. Monitoring/measureme nt of performance of IT components through performance logs. 7.4. Reports that combine data from various platform sources and present an integrated picture of the distributed IS environment. 8. IS interface 8.1. Open communication a nd a go od l iai son between the IS and business functions. 8.2. Open communication a nd a go od l iai son between the IS staff and the vendors of IT components. 8.3. Active scanning of the IS and proce ss d evel opments, and innovations in the inform ation systems area. Copyright © 2013 SciRes. IIM 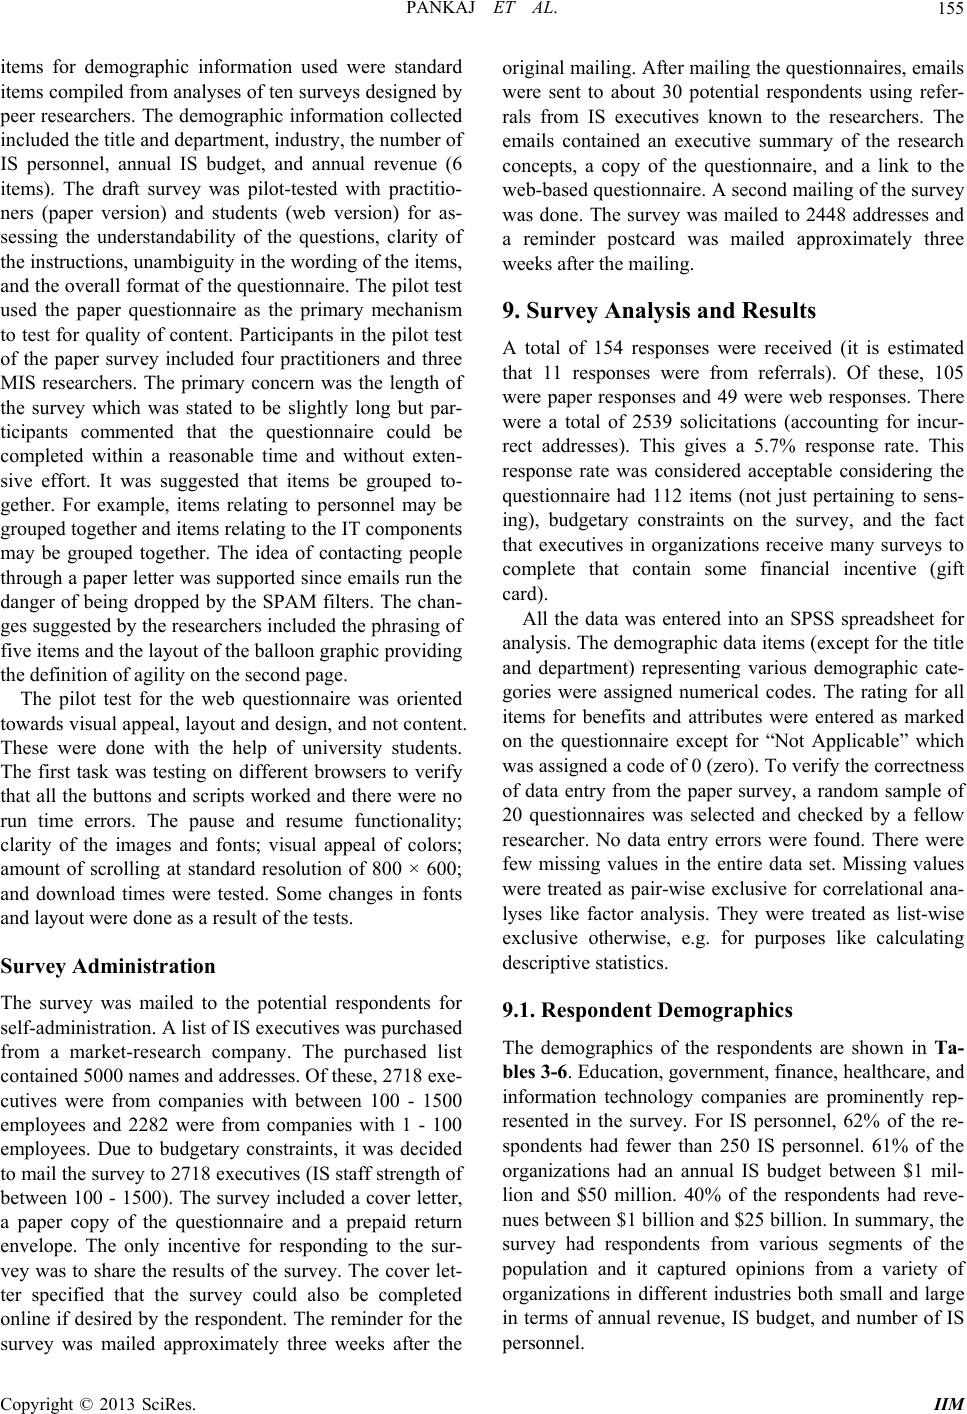 PANKAJ ET AL. 155 items for demographic information used were standard items compiled from analyses of ten surveys designed by peer researchers. The demographic information collected included the title and dep artment, industry, th e number of IS personnel, annual IS budget, and annual revenue (6 items). The draft survey was pilot-tested with practitio- ners (paper version) and students (web version) for as- sessing the understandability of the questions, clarity of the instructions, unambigu ity in the wo rding of th e items, and the overall format of the questionnaire. The pilot test used the paper questionnaire as the primary mechanism to test for quality of content. Participants in the pilot test of the paper survey included four practitioners and three MIS researchers. The primary concern was the length of the survey which was stated to be slightly long but par- ticipants commented that the questionnaire could be completed within a reasonable time and without exten- sive effort. It was suggested that items be grouped to- gether. For example, items relating to personnel may be grouped together and items relating to the IT components may be grouped together. The idea of contacting people through a paper letter was supported since emails ru n the danger of b eing dropped by the SPAM filters. Th e chan- ges suggested by the researchers included the phrasing of five items and the layout of the balloon graphic providing the definition of agility on the second page. The pilot test for the web questionnaire was oriented towards visual appeal, layout and design, and not content. These were done with the help of university students. The first task was testing on different browsers to verify that all the buttons and scripts worked and there were no run time errors. The pause and resume functionality; clarity of the images and fonts; visual appeal of colors; amount of scrolling at standard resolution of 800 × 600; and download times were tested. Some changes in fonts and layout were done as a result of the tests. Survey Administration The survey was mailed to the potential respondents for self-administration. A list of IS executives was purchased from a market-research company. The purchased list contained 5000 names and addr esses. Of these, 2718 exe- cutives were from companies with between 100 - 1500 employees and 2282 were from companies with 1 - 100 employees. Due to budgetary constraints, it was decided to mail the survey to 2718 executives (IS staff stren gth of between 100 - 1500). The su rvey included a cover letter, a paper copy of the questionnaire and a prepaid return envelope. The only incentive for responding to the sur- vey was to share the results of the survey. The cover let- ter specified that the survey could also be completed online if desired by the respondent. The reminder for the survey was mailed approximately three weeks after the original mailing. After mailing the questionnaires, emails were sent to about 30 potential respondents using refer- rals from IS executives known to the researchers. The emails contained an executive summary of the research concepts, a copy of the questionnaire, and a link to the web-based questionnaire. A second mailing of the survey was done. The survey was mailed to 2448 addresses and a reminder postcard was mailed approximately three weeks after the mailing. 9. Survey Analysis and Results A total of 154 responses were received (it is estimated that 11 responses were from referrals). Of these, 105 were paper responses and 49 were web responses. There were a total of 2539 solicitations (accounting for incur- rect addresses). This gives a 5.7% response rate. This response rate was considered acceptable considering the questionnaire had 112 items (not just pertaining to sens- ing), budgetary constraints on the survey, and the fact that executives in organizations receive many surveys to complete that contain some financial incentive (gift card). All the data was entered into an SPSS spreadsheet for analysis. The demograph ic data items (except for the title and department) representing various demographic cate- gories were assigned numerical codes. The rating for all items for benefits and attributes were entered as marked on the questionnaire except for “Not Applicable” which was assigned a code of 0 (zero). To verify the correctness of data entry from the paper survey, a random sample of 20 questionnaires was selected and checked by a fellow researcher. No data entry errors were found. There were few missing values in the entire data set. Missing values were treated as pair-wise exclusive for correlational ana- lyses like factor analysis. They were treated as list-wise exclusive otherwise, e.g. for purposes like calculating descriptive statistics. 9.1. Respondent Demographics The demographics of the respondents are shown in Ta- bles 3-6. Education, government, finance, healthcare, and information technology companies are prominently rep- resented in the survey. For IS personnel, 62% of the re- spondents had fewer than 250 IS personnel. 61% of the organizations had an annual IS budget between $1 mil- lion and $50 million. 40% of the respondents had reve- nues between $1 billion an d $25 billio n. In summary, the survey had respondents from various segments of the population and it captured opinions from a variety of organizations in different industries both small and large in terms of annual revenue, IS budget, and number of IS personnel. Copyright © 2013 SciRes. IIM 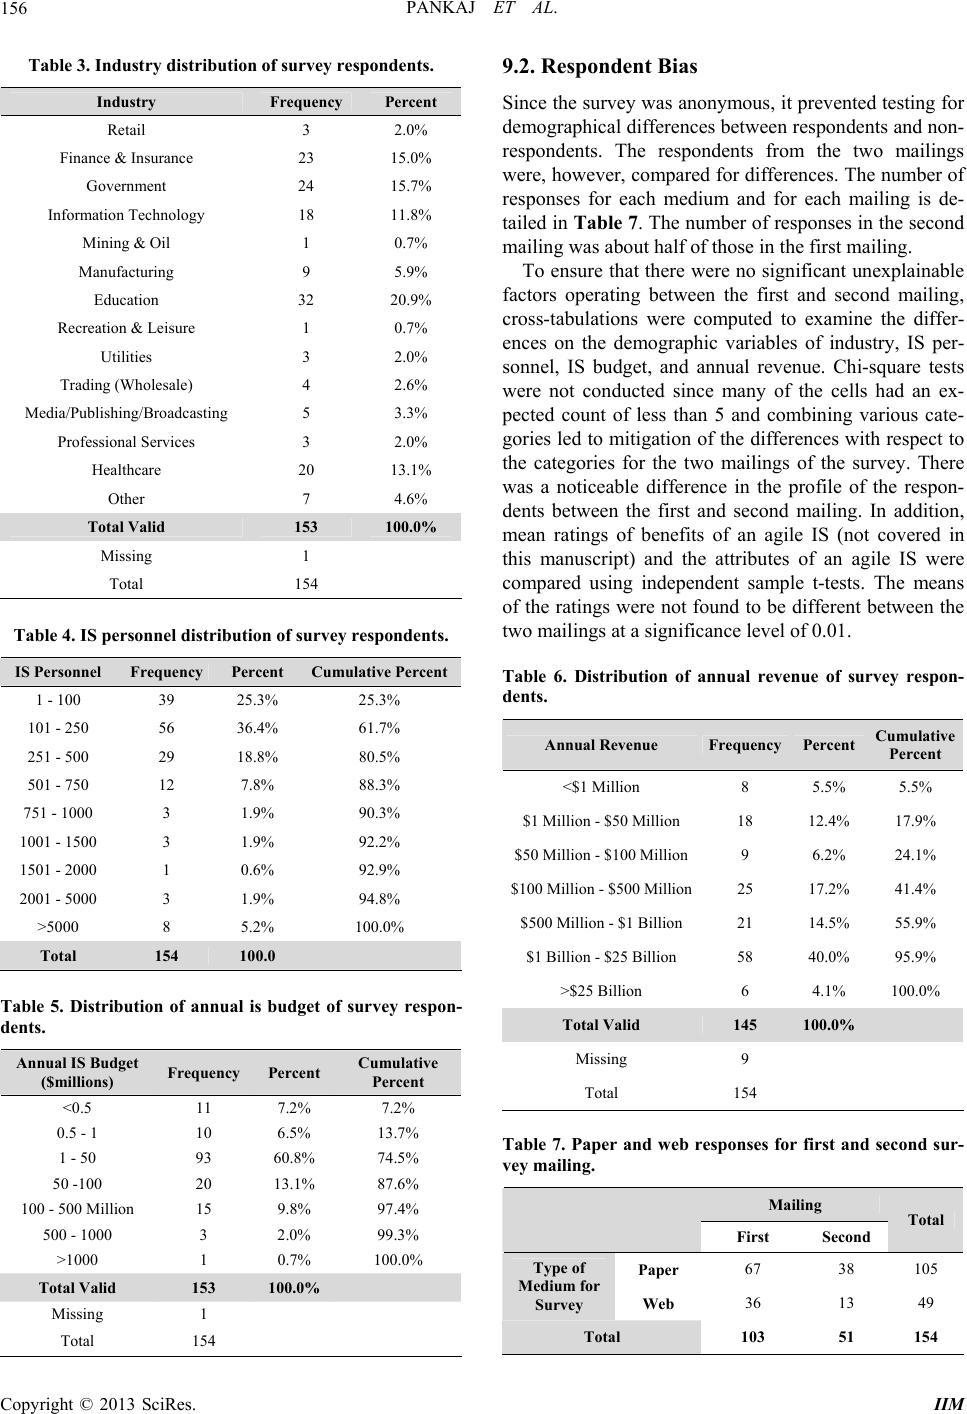 PANKAJ ET AL. 156 Table 3. Industry distribution of survey respondents. Industry Frequency Percent Retail 3 2.0% Finance & Insurance 23 15.0% Government 24 15.7% Information Technology 18 11.8% Mining & Oil 1 0.7% Manufacturing 9 5.9% Education 32 20.9% Recreation & Leisure 1 0.7% Utilities 3 2.0% Trading (Wholesale) 4 2.6% Media/Publishing/Broadcasting 5 3.3% Professional Services 3 2.0% Healthcare 20 13.1% Other 7 4.6% Total Valid 153 100.0% Missing 1 Total 154 Table 4. IS personnel distribution of survey respondents. IS Personnel Frequency Percent Cumulative Percent 1 - 100 39 25.3% 25.3% 101 - 250 56 36.4% 61.7% 251 - 500 29 18.8% 80.5% 501 - 750 12 7.8% 88.3% 751 - 1000 3 1.9% 90.3% 1001 - 1500 3 1.9% 92.2% 1501 - 2000 1 0.6% 92.9% 2001 - 5000 3 1.9% 94.8% >5000 8 5.2% 100.0% Total 154 100.0 Table 5. Distribution of annual is budget of survey respon- dents. Annual IS Budget ($millions) Frequency Percent Cumulative Percent <0.5 11 7.2% 7.2% 0.5 - 1 10 6.5% 13.7% 1 - 50 93 60.8% 74.5% 50 -100 20 13.1% 87.6% 100 - 500 Million 15 9.8% 97.4% 500 - 1000 3 2.0% 99.3% >1000 1 0.7% 100.0% Total Valid 153 100.0% Missing 1 Total 154 9.2. Respondent Bias Since the survey was anonymous, it prevented testing for demographical differences between respondents and non- respondents. The respondents from the two mailings were, however, compared for differences. The number of responses for each medium and for each mailing is de- tailed in Tab le 7. The number of responses in the second mailing was about half of tho se in the first mailing. To ensure that there were no significant unexplainable factors operating between the first and second mailing, cross-tabulations were computed to examine the differ- ences on the demographic variables of industry, IS per- sonnel, IS budget, and annual revenue. Chi-square tests were not conducted since many of the cells had an ex- pected count of less than 5 and combining various cate- gories led to mitigation of the differences with respect to the categories for the two mailings of the survey. There was a noticeable difference in the profile of the respon- dents between the first and second mailing. In addition, mean ratings of benefits of an agile IS (not covered in this manuscript) and the attributes of an agile IS were compared using independent sample t-tests. The means of the ratings were not found to be different between the two mailings at a significance level of 0.01 . Table 6. Distribution of annual revenue of survey respon- dents. Annual Revenue Frequency Percent Cumulative Percent <$1 Million 8 5.5% 5.5% $1 Million - $50 Million 18 12.4% 17.9% $50 Million - $100 Million9 6.2% 24.1% $100 Million - $500 Million25 17.2% 41.4% $500 Million - $1 Billion 21 14.5% 55.9% $1 Billion - $25 Billion 58 40.0% 95.9% >$25 Billion 6 4.1% 100.0% Total Valid 145 100.0% Missing 9 Total 154 Table 7. Paper and web responses for first and second sur- vey mailing. Mailing First Second Total Paper 67 38 105 Type of Medium for Survey Web 36 13 49 Total 103 51 154 Copyright © 2013 SciRes. IIM 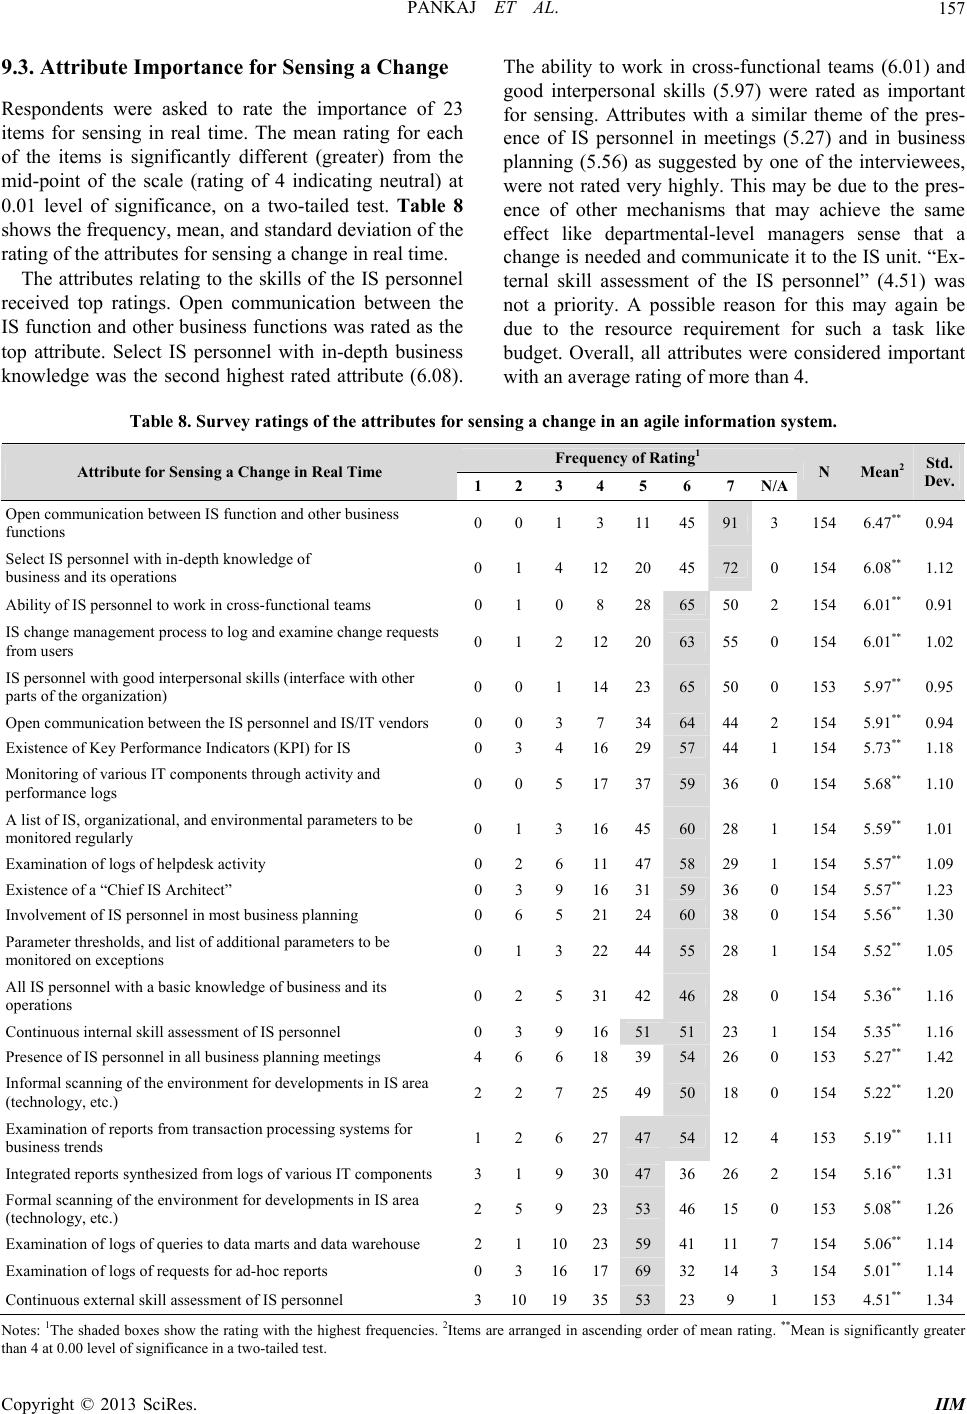 PANKAJ ET AL. Copyright © 2013 SciRes. IIM 157 9.3. Attribute Importance for Sensing a Change Respondents were asked to rate the importance of 23 items for sensing in real time. The mean rating for each of the items is significantly different (greater) from the mid-point of the scale (rating of 4 indicating neutral) at 0.01 level of significance, on a two-tailed test. Table 8 shows the frequency, mean, and standard deviation of the rating of the attributes for sensin g a change in real time. The attributes relating to the skills of the IS personnel received top ratings. Open communication between the IS function and other business functions was rated as the top attribute. Select IS personnel with in-depth business knowledge was the second highest rated attribute (6.08). The ability to work in cross-functional teams (6.01) and good interpersonal skills (5.97) were rated as important for sensing. Attributes with a similar theme of the pres- ence of IS personnel in meetings (5.27) and in business planning (5.56) as suggested by one of the interviewees, were not rated very highly. This may be due to the pres- ence of other mechanisms that may achieve the same effect like departmental-level managers sense that a change is needed and communicate it to th e IS unit. “Ex- ternal skill assessment of the IS personnel” (4.51) was not a priority. A possible reason for this may again be due to the resource requirement for such a task like budget. Overall, all attributes were considered important with an average rating of more than 4. Table 8. Survey ratings of the attributes for sensing a change in an agile information system. Frequency of Rating1 Attribute for Sensing a Change in Real Time 1234 5 6 7 N/A N Mean2Std. Dev. Open communication between IS function and other business functions 0 0 1 3 114591 3 154 6.47** 0.94 Select IS personnel with in-depth knowledge of business and its operations 0 1 4 12204572 0 154 6.08** 1.12 Ability of IS personnel to work in cross-functional teams 0 1 0 8 286550 2 154 6.01** 0.91 IS change managem ent pr ocess to log and examine change requests from users 0 1 2 12206355 0 154 6.01** 1.02 IS personnel with good inter personal skills (interface with other parts of the organization) 0 0 1 14236550 0 153 5.97** 0.95 Open communication between the IS personnel and IS/IT ven dors 0 0 3 7 346444 2 154 5.91** 0.94 Existence of Key Performance Indicators (KPI) for IS 0 3 4 16295744 1 154 5.73** 1.18 Monitoring of various IT components through activity and performance logs 0 0 5 17375936 0 154 5.68** 1.10 A list of IS, organizational, a nd environmental parameters to be monitored regularly 0 1 3 16456028 1 154 5.59** 1.01 Examination of logs of helpdesk activity 0 2 6 11475829 1 154 5.57** 1.09 Existence of a “Chief IS Architect” 0 3 9 16315936 0 154 5.57** 1.23 Involvement of IS personnel in most business planning 0 6 5 21246038 0 154 5.56** 1.30 Parameter thresholds, and list of ad ditional paramet ers to be monitored on exceptions 0 1 3 22445528 1 154 5.52** 1.05 All IS personnel with a basic knowledge of b usiness and its operations 0 2 5 31424628 0 154 5.36** 1.16 Continuous internal sk i ll a ss es sment of IS personnel 0 3 9 1651 5123 1 154 5.35** 1.16 Presence of IS personnel in all business planning meetings 4 6 6 18395426 0 153 5.27** 1.42 Informal scanning o f the env ironment for developments in IS area (technology, etc.) 2 2 7 25495018 0 154 5.22** 1.20 Examination of reports from transaction processing systems for business trends 1 2 6 2747 5412 4 153 5.19** 1.11 Integrated reports synthesized from logs of various IT components 3 1 9 3047 3626 2 154 5.16** 1.31 Formal scanning of the environment for developments in IS area (technology, etc.) 2 5 9 2353 4615 0 153 5.08** 1.26 Examination of logs of queri es to data marts and data warehouse 2 1 1023594111 7 154 5.06** 1.14 Examination of logs of requests for ad-hoc reports 0 3 161769 3214 3 154 5.01** 1.14 Continuous external skill a s s es sment of IS personnel 3 10193553239 1 153 4.51** 1.34 Notes: 1The shaded boxes show the rating with the highest frequencies. 2Items are arranged in ascending order of mean rating. **Mean is significantly greater than 4 at 0.00 level of significance in a two-tailed test.  PANKAJ ET AL. 158 9.4. Exploratory Factor Analysis for Identification of Dimensions Underlying the Sensing Attributes An exploratory factor analysis (EFA) was conducted to identify possible dimensions underlying the benefits of an agile IS and the attributes for sensing. Though broad categories were defined when arriving at attributes and so it would be possible to do a confirmatory factor analy- sis, it was felt that an EFA is appropriate given the ex- ploratory nature of the study. For sensing, the number of attributes was 23 for a sample of 154. This satisfied the rule of thumb of 5:1for the sample size. To test the ap- propriateness of the correlation matrix for factor an alysis the Kaiser-Meyer-Olkin’s Measure of Sampling Ade- quacy (KMO MSA) was examined. The KMO MSA for sensing was 0.816 or at a meritorious level. An EFA was conducted using principal axis factoring since the object- ive was to identify underlying dimensions based on the common variance shared by the attributes. Varimax rota- tion was used to arrive at a simple structure for the fac- tors. Other rotations oblimin, quatrimax, and promax were also tested. Varimax rotation provided the simplest and most interpretable factor structure. The number of factors to be extracted was based on a combination of the scree test, eigen-value criterion, and simple structure. Simplicity of structure was given preference over parsi- mony. Initial factor extraction was based on the criteria of the eigen-value greater than 1. Then, the scree plot was examined for a visible elbow such that all factors with an eigen-value of greater than 1 were included in the solution. The factor analysis was run again with the number of factors indicated by the elbow. Both solutions were examined and the factor structure that was simple and interpretable was chosen. The cut-off for factor load- ing was taken as 0.4. Guidelines suggest [29] loadings of greater than ±0.3 to meet the minimal level while load- ings of ±0.40 are considered more important. For the EFA of the attributes for sensing, nine factors were extracted. Using the criterion of eigen-values of greater than one, six factors were extracted. The scree plot had a distinct elbow at factor 9 with a possible elbow at factor 7. Examining the factor structure with 6, 7, and 9 factors, the solution with nine factors was retained. The nine factors together explain 74% of the variance. Table 9 provides details of the factors and the items that load on the factors along with their loadings. The factors have been provided with some indicative names. The first factor was labeled as “Institutional Sensing”. The items under this factor related to organizational level sensing done both objectively and subjectively. The sec- ond factor was labeled as “Trend Sensing” as the items that loaded on this factor were related to looking for trends that can be inferred by examining various logs and/or reports. The item “examination of helpdesk activ- ity” cross-loaded onto this factor. This may be explained by the fact that helpdesk activity logs may also point to trends. The third factor was labeled as “External Sens- ing” and included formal and informal environmental scanning. The fourth was labeled as “IS Presence” since it included items relating to sensing internal organiza- tional stimuli through attendance at meetings and par- ticipation in business planning. The fifth factor was la- beled as “Interface” since it included items that related to the interface of IS personnel with the rest of the organi- zation. IS personnel may sense various stimuli through working with personnel from other functions. The sixth factor was labeled as “Communication” and the items that loaded onto this factor related to signals or stimuli commu nicat ed from the organization and external partie s. The seventh factor was labeled as “Assessment” since the items that loaded on this factor exclusively related to sensing change in the IS personnel. The eighth factor was labeled as “Logs” since the items that loaded on this fac- tor related to recording signals in various logs. The ninth factor was labeled as “Business Skills”. Apart from the item “select IS personnel with in-depth business knowl- edge”, the item “examination of reports from the Trans- action Processing Systems (TPS) for business trends” cross-loaded on this factor. The latter item relates to ex- amining TPS reports for business trends which would need significant business knowledge on the part of IS personnel. The item “all IS personnel with basic knowledge of business and its operations” did not load on any factor. One possible reason for this may be that many other items (presence at meetings, cross-functional team, etc.) may subsume this item and its variance may be explained through other items. Two items cross-loaded and the cross-loading could be justified to the extent that the items appeared to be relevant to both the factors on which the items loaded. These items could be split into items that are specific and meaningful with respect to each of the factors. For instance, “examination of help- desk log” may be rephrased to “examination of helpdesk logs to identify tren ds” in th e context of the “Trend Sens- ing Factor”. These issues may be addressed in future studies in this area. 10. Summary and Comments The survey data support the importance of attributes per- taining to sensing in an agile information system. These can be used by practitioners to improve the ability of their IS to sense. The EFA identifies dimensions that make logical sense at this early stage of exploration. The major finding from the study is that people matter and that IS agility is people-driven. The attributes related to personnel in the areas of sensing were amongst the top ated. In the comments that accompanied the survey r Copyright © 2013 SciRes. IIM  PANKAJ ET AL. 159 Table 9. Factors for sensing a change in an agile information system. Factors Attribute for Sensing a Change in Real Time 1 (Institutional Sensing) 2 (Trend Sensing) 3 (External Sensing) 4 (IS Presence) 5 (Interface) 6 (Communication) 7 (Assessment) 8 (Logs) 9 (Business Skills) Parameter thresholds, and list of additional parameters to b e monitored on exceptions 0.844 A list of IS, organizational, a nd environmental parameters to be monitored regularly 0.741 Existence of a “Chief IS Architect” 0.450 Existence of Key Performance Indicators (KPI) for IS 0.428 Integrated reports synthesized from logs of various IT com ponents 0.402 Examination of logs of queri es to data marts and data warehouse 0.809 Examination of logs of requests for ad-hoc reports 0.779 Examination of reports from transaction processing syst ems for business trends 0.578 0.409 Informal scanning of the environment for developments in IS area (technology, etc.) 0.817 Formal scanning of the environment for developments in IS area (technology, etc.) 0.601 Involvemen t of IS personnel in most business planning 0.853 Presence of IS personnel in all business planning meetings 0.636 Ability of IS personnel to work in cross-functional teams 0.762 IS personnel with good interpersonal skills (interface with other parts of the organization) 0.690 All IS personnel with a basi c knowledge of business and its operations Open communication between IS function and other business functions 0.913 Open communication between the IS personnel and IS/IT vendor s 0.533 Continuous external skill assessment of IS personnel 0.712 Continuous internal skill assessment of IS personnel 0.682 Monitoring of various IT components through activity and performance logs 0.580 Examination of logs of helpdesk activity 0.462 0.551 IS change management process to log and examine change requests from users 0.520 Select IS personnel with in-depth knowledge of business and its operations 0.464 Copyright © 2013 SciRes. IIM  PANKAJ ET AL. 160 respondents stressed the importance of people. The stress on personnel implies that organizations need to focus on issues like training and retention of good IS personnel. A valuable area where the research has implications is in the area of IS personnel. IS personnel were stated to be the key to achieving IS agility. There is a trend in the industry to outsource and to reduce personnel-related costs. This may move a significant amount of knowledge pertaining to IS to external parties. This knowledge is seldom shared between partners. Hence the outsourcing organizations run the risk of losing this knowledge and thereby their ability to ch ange IS on th eir own accord and in time. So organizations need to put in some thought on the retention and building of a team of quality of IS per- sonnel and to restrict outsourcing to just non-critical ar- eas if they have resources to follow such a strategy. In case outsourcing has to be used, the organization should take steps to establish an internal core of skilled IS per- sonnel. 10.1. Limitations There are some limitations in this study. This research represents the state at a particular point in time. In the IS area where technologies, practices, and concepts are con- tinuously evolving, the research may need to be continu- ally refreshed to be more meaningful with the times. Items may need to be further refined to avoid cross-load- ings and non-loading items in EFA. The response rate for the survey was 5.7% and though this response rate was considered acceptable for the purpose of this survey there is still room to improve the response rate. This could be done, for example, through collaboration with some spe- cial interest groups and research groups with an interest in the area of IS agility. 10.2. Future Research The attributes for sensing in an agile IS identified in this study are based on a continuous and rigorous monitoring of IS industry developments. The shifting ideas and thoughts have been conso lidated into the attribute list for sensing in an agile IS in this study. This list could serve as a starting point for further research. The instrument and the items may be examined and revised based on the data collection and analyses in this research, and the study may then be replicated. The rep- licated results may be used to come up with a scale for measuring sensing abilities of an agile IS. REFERENCES [1] R. Mason-Jones and D. R. Towill, “Total Cycle Time Compression and the Agile Supply Chain,” International Journ al of Production Economics, Vol. 62, No. 1-2, 1999, pp. 61-73. doi:10.1016/S0925-5273(98)00221-7 [2] M. Christopher, “The Agile Supply Chain: Competing in Volatile Markets,” Industrial Marketing Management, Vol. 29, No. 1, 2000, pp. 37-44. doi:10.1016/S0019-8501(99)00110-8 [3] R. I. V. Hoek, “The Thesis of Leagility Revisited,” In- ternational Journal of Agile Manufacturing Management Systems, Vol. 2, No. 3, 2000, pp. 196-201. [4] N. Bajgoric, “Web-Based Information Access for Agile Management,” International Journal of Agile Manage- ment Systems, Vol. 2, No. 2, 2000, pp. 121-129. doi:10.1108/14654650010337131 [5] H. Sharifi and Z. Zhang, “A Methodology for Achieving Agility in Manufacturing Organizations: An Introduc- tion,” International Journal of Production Economics, Vol. 62, No. 1, 1999, pp. 7-22. doi:10.1016/S0925-5273(98)00217-5 [6] Y. Y. Yusuf, M. Sarahadi and A. Gunasekaran, “Agile Manufacturing: The Drivers, Concepts, and Attributes”, International Journal of Production Economics, Vol. 62, No. 1, 1999, pp. 33-43. doi:10.1016/S0925-5273(98)00219-9 [7] J. Bal, R. Wilding and J. Gundry, “Virtual Teaming in the Agile Supply Chain,” The International Journal of Logis- tics Management, Vol. 10, No. 2, 1999, pp. 71-82. doi:10.1108/09574099910806003 [8] A. C. Boynton, “Achieving Dynamic Stability through In- formation Technology,” California Management Review, Vol. 35, No. 2, 1993, pp. 58-77. doi:10.2307/41166722 [9] Pankaj, “An Analysis and Exploration of Information Systems Agility,” Ph.D. The sis, Southern Illinois Univer- sity, Carbondale, 2005, 343 pp. [10] M. H. Pankaj and A. Ramaprasad, “Revisiting Agility to Conceptualize Information Systems Agility,” In: M. Ly- tras and P. O. D. Pablos, Eds., Emerging Topics and Te- chnologies in Information Systems, IGI-Global, Hershey, 2009, pp. 19-54. [11] “Comp.realtime: Frequently Asked Questions (FAQs) (Version 3.5),” 2002. http://www.faqs.org/faqs/realtime-computing/faq/ [12] J. Edwards, T. Milea, S. Mcleod and I. Coults, “Agile System Design and Build.” IEEE Colloquium on Manag- ing Requirements Change: A Business Process Reengi- neering Perspect i ve, London, 11 June 1998, pp. 1-5. [13] T. A. Byrd and D.E. Turner, “Measuring the Flexibility of Information Technology Infrastructure,” Journal of Man- agement Information Systems, Vol. 17, No. 1, 2000. pp. 167-208. [14] P. Ein-Dor and E. Segev, “Organizational Context and the Success of Management Information Systems,” Man- agement Science, Vol. 24, No. 10, 1978, pp. 1064-1078. doi:10.1287/mnsc.24.10.1064 [15] D. M. S. Lee, E. Trauth and D. Farwell, “Critical Skills and Knowledge Requirements of IS Professionals: A Joint Academic/Industry Investigation,” MIS Quarterly, Vol. 19, No. 3, 1995, pp. 313-340. doi:10.2307/249598 [16] K. M. Eisenhardt, “Building Theories from Case Study Copyright © 2013 SciRes. IIM  PANKAJ ET AL. 161 Research,” Ac ade my of M anagement Review, Vol. 14, N o. 4, 1989, pp. 532-550. [17] J. B. Quinn, “Managing Strategic Change,” Sloan Man- agement Review, Vol. 21, No. 4, 1980, pp. 3-20. [18] S. H. Haeckel and R. L. Nolan, “Managing by Wire: Us- ing I/T to Transform a Business from Make-and-Sell to Sense-and-Respond,” In: J. N. Luftman, Ed., Competing in the Information Age: Strategic Alignment in Practice, Oxford University Press Inc., London, 1996, p. 220. [19] R. S. Billings, T. W. Milburn and M. L. Schaalman, “A Model for Crisis Perception: A Theatrical and Empirical Analysis,” Administrative Science Quarterly, Vol. 25, No. 2, 1980, pp. 300-316. doi:10.2307/2392456 [20] S. Kiesler and L. Sproull, “Managerial Response to Changing Environments: Perspectives on Problem Sens- ing from Social Cognition,” Administrative Science Quar- terly, Vol. 27, No. 2, 1982, pp. 548-570. doi:10.2307/2392530 [21] S. P. Weil, M. Subramani and M. Broadbent, “Building IT Infrastructure for Strategic Agility,” MIT Sloan Man- agement Review, Vol. 44, No. 1, 2002, pp. 57-65. [22] B. R. Allen and A. C. Boynton, “Information Architec- ture: In Search of Efficient Flexibility,” MIS Quarterly, Vol. 15, No. 4, 1991, pp. 435-445. doi:10.2307/249447 [23] T. V. Bonoma, “Case Research in Marketing: Opportuni- ties, Problems, and a Process,” Journal of Marketing Re- search, Vol. 22, No. 2, 1985, pp. 199-208. doi:10.2307/3151365 [24] J. E. Bailey and S. W. Pearson, “Development of a Tool for Measuring and Analyzing Computer User Satisfac- tion,” Management Science, Vol. 29, No. 5, 1983, pp. 530-545. doi:10.1287/mnsc.29.5.530 [25] D. L. Goodhue, “Supporting Users of Corporate Data,” Ph.D. Thesis, Massachusetts Institute of Technology, Boston, 1988, p. 300. [26] B. Ives, M. H. Olson and J. J. Baroudi, “The Measure- ment of User Information Satisfaction,” Communications of the ACM, Vol. 26, No. 10, 1983, pp. 785-793. doi:10.1145/358413.358430 [27] J. A. Ricketts and A. M. Jenkins, “The Development of an MIS Satisfaction Questionnaire: An Instrument for Evaluating User Satisfaction with Turnkey Decision Sup- port Systems,” Discussion Paper No. 2961985, Indiana University School of Business, Bloomington. [28] G. A. Churchill, “A Paradigm for Developing Better Measures of Marketing Constructs,” Journal of Market- ing Research, Vol. 16, No. 1, 1979, pp. 64-73. doi:10.2307/3150876 [29] J. H. Hair Jr., R. E. Anderson, R. L. Tatham and W. C. Black, “Multivariate Data Analysis,” Prentice Hall, Upper Saddle River, 1995. Copyright © 2013 SciRes. IIM
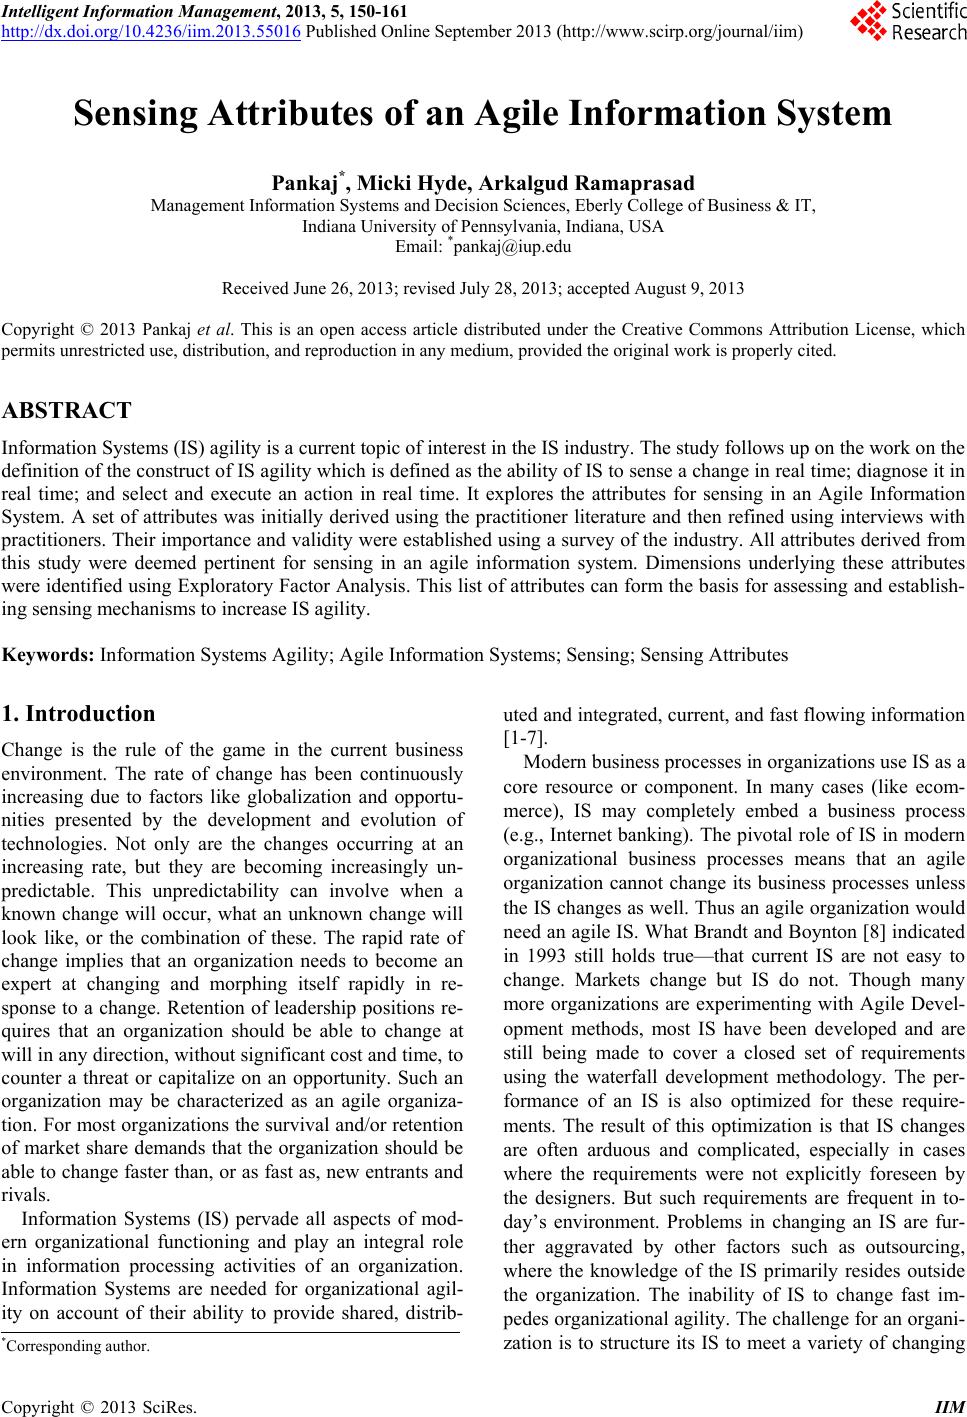
|