 Journal of Financial Risk Management 2013. Vol.2, No.3, 47-54 Published Online September 2013 in SciRes (http://www.scirp.org/journal/jfrm) http://dx.doi.org/10.4236/jfrm.2013.23008 Copyright © 2013 SciRes. 47 Stock Market Volatility, Speculative Short Sellers and Weekend Effect: International Evidence Weili Zhai1, Hossein S. Kazemi2*, Jibao He3#, Jinghan Cai4 1Department of Finance, Shenzhen University, Shenzhen, China 2Department of Economics, Stonehill College, Easton, USA 3Shenzhen Stock Exchange, Shenzhen, China 4Department of Economics, Boston College, Boston, USA Email: zhaiweili2006@126.com, *kazemi@stonehill.edu, jbhe@szse.cn, jinghan.cai@bc.edu Received June 15th, 2013; revised July 15th, 2013; accepted July 22nd, 2013 Copyright © 2013 Weili Zhai et al. This is an open access article distributed under the Creative Commons At- tribution License, which permits unrestricted use, distribution, and reproduction in any medium, provided the original work is properly cited. We test the Chen and Singal (2003) hypothesis that speculative short sellers add to the selling pressure on Mondays, and hence add to the weekend effect, by examining evidence from 60 market indices. We find strong evidence that, until about a decade ago, the actions of short sellers could explain the weekend ef- fect. Recently, however, the relationship between short sales and the weekend effect is gradually dissi- pating in developed markets, probably due to the cross-market hedges of short sellers. These findings strongly support, rather than weaken, the Chen and Singal hypothesis. Keywords: Weekend Effect; Short Sales; Market Anomaly; Stock Market Volatility Introduction We provide empirical evidence, from an international per- spective, to document the long standing weekend effect and its relation with short sales. This paper is an expanded and en- hanced version of the authors’ previous paper1 on this topic. The research on the weekend anomaly begins with French (1980), who studies the S&P 500 Index over the period 1953 through 1977, and with Gibbons and Hess (1981) who study the S&P 500 Index and the CRSP value-and-equal-weighted in- dexes for NYSE and AMEX securities over the period 1962 through 1978. After that, there is much evidence in support of systematically lower returns on Mondays. Keim and Stam- baugh (1984) find that Friday returns are lower when there is Saturday trading. Ariel (1990) finds that the value of a signifi- cantly larger number of stocks increases pre-holiday rather than post-holiday. Wang et al. (1997) find that lower returns sys- tematically occur on Mondays in the second half of a month. In addition to the US stock market, researchers have also do- cumented weekend effects in other equity markets. Hindmarch et al. (1984) find a weekend effect in the Canadian market. Jaffe and Westerfield (1985) find weekday effects similar to those in the US market for the Canadian, British, Japanese, and Austra- lian equity markets. Condoyanni et al. (1989)find significantly negative Monday or Tuesday returns in a study including seven developed markets. Chang et al. (1993) find significantly nega- tive Monday returns in 13 of 23 international markets. Dubois and Louvet (1996) provide further evidence of the existence of low Monday returns for developed markets in an examination of eleven indices from nine countries during the period 1969 through 1992. Cai et al. (2006) document a pattern similar to that found by Wang et al. (1997), i.e., they find that, in the Chi- nese stock market also, weekend effects mainly occur in the se- cond half of a month. Many researchers propose potential explanations for the wee- kend effect. Keim and Stambaugh (1984) establish that the phe- nomenon has been a regular feature of the financial landscape for many years, and they reject the possibility that it arises from measurement error. Keim (1989) finds that the bid ask bounce can explain about 17 percent of the weekend effect. Lakonishok and Maberly (1990), Abraham and Ikenberry (1994) and Chan et al. (2004) attribute part of the weekend effect to the differen- tial trading patterns or holding preferences of institutions and individuals. Sias and Starks (1995) also document an associa- tion between the weekend effect and institutional ownership. More recently, Chen and Singal (2003) propose a new expla- nation, i.e., that the weekend effect might be linked to short sales. They argue that, unlike a long position whose potential loss is limited, a short position faces theoretically unlimited down- side risks. Thus short positions require closer monitoring. Since short sellers cannot close their positions during non-trading hours, they tend to close their positions by the weekend to avoid the potential losses which might occur during the long period of non-trading. Empirically, Chen and Singal (2003) find that stocks with high short interest experience a relatively greater weekend effect than stocks with low short interest, which directly sup- ports their hypothesis. However, recently some researchers have issued evidence that is contrary to Chen and Singal’s (2003) findings. For ex- ample, Blau et al. (2007) do not find that short selling is more abundant on Mondays. Christophe et al. (2006) distinguish short sales by dealers from those by customers, but they find no evi- *Corresponding author. #Jibao He acknowledges supports from NSFC project 71172226/G0206. 1Jinghan Cai, Hossein S. Kazemi, Jibao He and Weili Zhai “Weekend Effect and Short Sales: International Evidence”. International Advances in Eco- nomic Research. May 2013, Volume 19, Issue 2, 209-211. 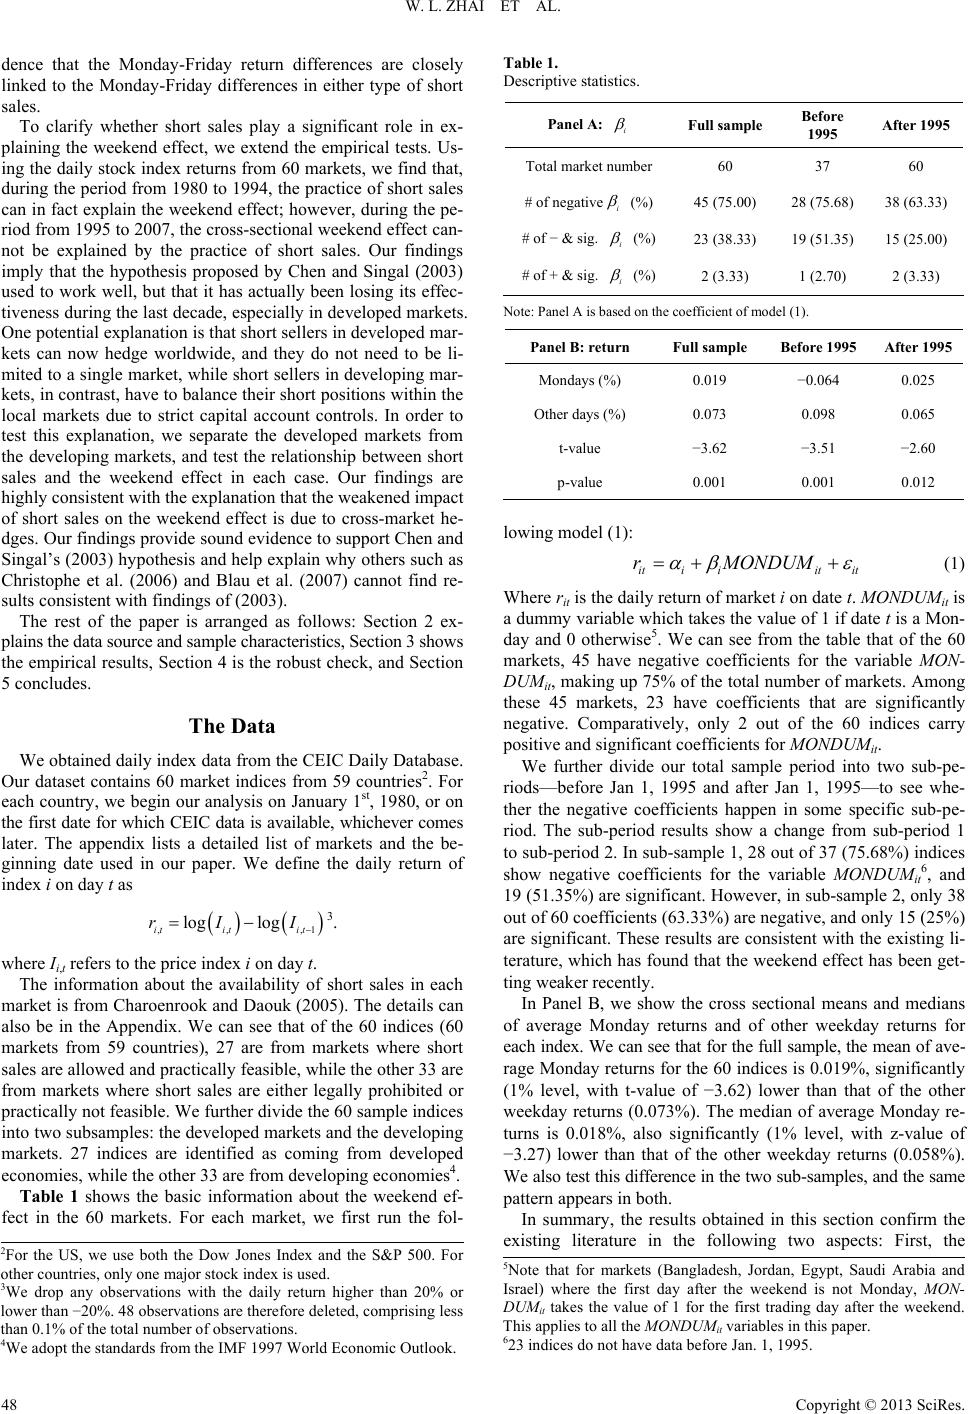 W. L. ZHAI ET AL. dence that the Monday-Friday return differences are closely linked to the Monday-Friday differences in either type of short sales. To clarify whether short sales play a significant role in ex- plaining the weekend effect, we extend the empirical tests. Us- ing the daily stock index returns from 60 markets, we find that, during the period from 1980 to 1994, the practice of short sales can in fact explain the weekend effect; however, during the pe- riod from 1995 to 2007, the cross-sectional weekend effect can- not be explained by the practice of short sales. Our findings imply that the hypothesis proposed by Chen and Singal (2003) used to work well, but that it has actually been losing its effec- tiveness during the last decade, especially in developed markets. One potential explanation is that short sellers in developed mar- kets can now hedge worldwide, and they do not need to be li- mited to a single market, while short sellers in developing mar- kets, in contrast, have to balance their short positions within the local markets due to strict capital account controls. In order to test this explanation, we separate the developed markets from the developing markets, and test the relationship between short sales and the weekend effect in each case. Our findings are highly consistent with the explanation that the weakened impact of short sales on the weekend effect is due to cross-market he- dges. Our findings provide sound evidence to support Chen and Singal’s (2003) hypothesis and help explain why others such as Christophe et al. (2006) and Blau et al. (2007) cannot find re- sults consistent with findings of (2003). The rest of the paper is arranged as follows: Section 2 ex- plains the data source and sample characteristics, Section 3 shows the empirical results, Section 4 is the robust check, and Section 5 concludes. The Data We obtained daily index data from the CEIC Daily Database. Our dataset contains 60 market indices from 59 countries2. For each country, we begin our analysis on January 1st, 1980, or on the first date for which CEIC data is available, whichever comes later. The appendix lists a detailed list of markets and the be- ginning date used in our paper. We define the daily return of index i on day t as ,, log log it itit rI I ,1 3. where Ii,t refers to the price index i on day t. The information about the availability of short sales in each market is from Charoenrook and Daouk (2005). The details can also be in the Appendix. We can see that of the 60 indices (60 markets from 59 countries), 27 are from markets where short sales are allowed and practically feasible, while the other 33 are from markets where short sales are either legally prohibited or practically not feasible. We further divide the 60 sample indices into two subsamples: the developed markets and the developing markets. 27 indices are identified as coming from developed economies, while the other 33 are from developing economies4. Table 1 shows the basic information about the weekend ef- fect in the 60 markets. For each market, we first run the fol- Table 1. Descriptive statistics. Panel A: i Full sample Before 1995 After 1995 Total market number 60 37 60 # of negativei (%) 45 (75.00) 28 (75.68) 38 (63.33) # of − & sig. i (%) 23 (38.33) 19 (51.35) 15 (25.00) # of + & sig. i (%) 2 (3.33) 1 (2.70) 2 (3.33) N ote: Panel A is based on the coefficient of model (1). Panel B: return Full sample Before 199 5 After 1995 Mondays (%) 0.019 −0.064 0.025 Other days (%) 0.073 0.098 0.065 t-value −3.62 −3.51 −2.60 p-value 0.001 0.001 0.012 lowing model (1): itiiit it r MONDUM (1) Where rit is the daily return of market i on date t. MONDUMit is a dummy variable which takes the value of 1 if date t is a Mon- day and 0 otherwise5. We can see from the table that of the 60 markets, 45 have negative coefficients for the variable MON- DUMit, making up 75% of the total number of markets. Among these 45 markets, 23 have coefficients that are significantly negative. Comparatively, only 2 out of the 60 indices carry positive and significant coefficients for MONDUMit. We further divide our total sample period into two sub-pe- riods—before Jan 1, 1995 and after Jan 1, 1995—to see whe- ther the negative coefficients happen in some specific sub-pe- riod. The sub-period results show a change from sub-period 1 to sub-period 2. In sub-sample 1, 28 out of 37 (75.68%) indices show negative coefficients for the variable MONDUMit6, and 19 (51.35%) are significant. However, in sub-sample 2, only 38 out of 60 coefficients (63.33%) are negative, and only 15 (25%) are significant. These results are consistent with the existing li- terature, which has found that the weekend effect has been get- ting weaker recently. In Panel B, we show the cross sectional means and medians of average Monday returns and of other weekday returns for each index. We can see that for the full sample, the mean of ave- rage Monday returns for the 60 indices is 0.019%, significantly (1% level, with t-value of −3.62) lower than that of the other weekday returns (0.073%). The median of average Monday re- turns is 0.018%, also significantly (1% level, with z-value of −3.27) lower than that of the other weekday returns (0.058%). We also test this difference in the two sub-samples, and the same pattern appears in both. In summary, the results obtained in this section confirm the existing literature in the following two aspects: First, the 2For the US, we use both the Dow Jones Index and the S&P 500. For other countries, only one major stock index is used. 3We drop any observations with the daily return higher than 20% or lower than −20%. 48 observations are therefore deleted, comprising less than 0.1% of the total number of observations. 4We adopt the standards from the IMF 1997 World Economic Outlook. 5Note that for markets (Bangladesh, Jordan, Egypt, Saudi Arabia and Israel) where the first day after the weekend is not Monday, MON- UMit takes the value of 1 for the first trading day after the weekend. This applies to all the MONDUMit variables in this paper. 623 indices do not have data before Jan. 1, 1995. Copyright © 2013 SciRes. 48  W. L. ZHAI ET AL. weekend effect is a world-wide phenomenon; Secondly, the degree of the weekend effect has been getting weaker in the re- cent decade, compared with one decade ago. Short Sales and the Weekend Effect Chen and Singal (2003) explain the weekend effect by intro- ducing the potential impacts of short sellers. It is well known that stock returns for unhedged short positions are theoretically unbounded. Also, researches such as Asquith and Muelbroek (1996) and DeChow et al. (2001) have noted that unhedged short positions face higher risks. All these facts indicate that an uncovered short exposure needs close watching to minimize the chance of large losses due to a price increase. Non-trading hours will therefore incur more risks than usual because short sellers are unable to adjust their positions. Based on these arguments, Chen and Singal (2003) believe that short sellers tend to close their positions before the weekend, and to reopen them on Mondays. This leads to lower average Monday returns. In this section we test whether short sales explain the week- end effect worldwide. If Chen and Singal’s (2003) story is true, in the markets allowing short sales, the weekend effect will be stronger than where short sales are prohibited. Therefore, we introduce the following regression models: itiiit it r MONDUM (1) itiiit iit it rMONDUMCMON ititiitiiit CMONMONDUMr (2) where rit is the daily return of market i on date t. MONDUMit is a dummy variable which takes the value of 1 if date t is a Monday and 0 otherwise. CMON it is the interaction term of a short sale dummy (1 if the market allows short sales and 0 oth- erwise) and the MONDUMit. Table 2 shows the results of a pooled regression of models (1) and (2). For the full sample, the coefficient of MONDUMit in model (1) is −0.066%, significant at 1% level, meaning that the weekend effect does exist around the world. After entering the interaction term, the coefficient of MONDUMit in model (2) changes to −0.039%, less negative than in regression (1), mean- ing that short sales do explain a large part of the weekend effect. On average, the Monday return of a firm in a market allowing Table 2. Pooled regression results. Full sample Before 199 5 After 1995 Unit: 10−3 (1) (2) (1) (2) (1) (2) MONDUM −0.66** (−8.57) −0.39** (−3.73) −1.26** (−9.37) −0.24 (−1.03) −0.45** (−4.87) −0.39** (−3.30) CMON −0.50** (−3.68) −1.46** (−5.54) −0.12 (−0.71) Cons 0.67** (19.73) 0.67** (0.00) 0.83** (14.22) 0.83** (14.24) 0.61** (14.90) 0.61** (14.90) F-value 73.47 43.50 87.87 59.30 23.7412.12 Prob > F 0.000 0.000 0.000 0.000 0.0000.000 R^2 (%) 0.03 0.04 0.15 0.20 0.01 0.01 Note: This table is based on models (1) and (2). t-values are in parentheses; *and **represent significance level at 5% and 1% respectively. t-values are in parenthe- ses. short sales is 0.050% lower than the Monday return from a marketnot allowing short sales. And the Monday return of a firm in a short-sale allowing market is −0.089% (−0.039 + (−0.050)) lower than the non-Monday return of a firm in a mar- ket where short sales are not allowed. The sub-sample results show a pattern different from the full sample. In the first sub-sample, the coefficient of MONDUMit in model (1) is −0.126%, meaning that the weekend effect ex- ists around the world before 1995. After entering CMONit, the coefficient of MONDUMit gets insignificant, and the coefficient of CMONit is significantly negative, implying that short sales can explain most of the weekend effect before 1995. However, in the second sub-sample, the coefficient of CMONit is now −0.012% (not significant), and MONDUMit is still negatively significant. This pattern indicates that, after 1995, the actions of short sellers cannot explain the weekend effect. We argue that the difference in the two sub-samples actually supports Chen and Singal’s (2003) story, rather than weakens it: until about a decade ago, the world’s stock markets were more isolated, and capital flows were not as convenient as they are today. Hence, cross-market hedges were not often employed, and short sellers had to adjust their positions mainly within the local market. Thus the practice of closing and re-opening short positions around the weekend was necessary and frequent, lea- ding to the prominent weekend effect. However, with the con- verging trend of the world’s stock markets, capital flows be- tween markets became easier and encountered fewer obstacles. Short sellers are now getting more comfortable at managing their positions worldwide, rather than staying within one single market. Also, investors have incentives to hedge their short po- sitions across markets because by doing so they can reduce the transaction costs incurred by closing and rebuilding short posi- tions within a single market. This explains why the weekend effect was more prominent a decade ago, but less prominent in the recent decade. Moreover, we want to separate developed from developing markets, which is important because capital flows and cross- market hedges will happen more in developed markets since in most developing markets capital accounts are still under strict control. This means that, if our explanation above is correct, the impact of short sellers’ actions should decrease by more in de- veloped markets than in developing ones. When it comes to de- veloped markets, capital flows and cross-market hedges be- come more available throughout this time period, and so short sellers’ actions should have a decreased impact in the latter sub- sample. We spell all this out in the predictions in Table 3. Pattern 1: In the full sample, short sellers’ actions can ex- plain the weekend effect in developing markets, since even at the present time, capital accounts in developing economies are still strictly controlled, and capital free flow is not expected. However, in the developed markets, the impact of short sales on the weekend effect is more ambiguous. Table 3. Comparison between developed and developing markets—predictions. The impacts of short sales on weekend effects Developed markets Developing markets Full sample Ambiguous Strong Before 199 5 Strong Strong After 1995 Weak Strong Copyright © 2013 SciRes. 49  W. L. ZHAI ET AL. Pattern 2: In sub-sample 1, (before 1995) short sellers’ ac- tions can explain the weekend effect in developed and develop- ing markets, since capital market conglomerations were not pre- vailing even in developed markets, and so short sellers every- where had to adjust their short positions mainly within a single market only. Pattern 3: In sub-sample 2, (after 1995) short sellers’ ac- tions can explain the weekend effect in developing markets. For developed markets, we do not expect to observe negative and significant coefficients of CMONit because, after 1995, the im- pact of short sales on the weekend effect in developed markets is weakened due to capital market conglomerations. In order to empirically test the patterns from Table 3, we in- troduce Table 4 for the pooled regressions based on equations (1) and (2) as shown earlier and all variables are defined the same. The empirical results in Table 4 are highly consistent with the predictions in Table 3. In the full sample, the coeffi- cients of CMONit are not significant for the developed markets, while the coefficients of CMONit for the developing markets are significantly negative, confirming the predictions in Pattern 1. In the subsample before 1995, the coefficients of CMONit for both the developing and the developed markets are negative and significant, confirming the predictions in Pattern 2. More- over, after controlling for the impact of short sales, the coeffi- cients of MONDUMit become less negative, especially for the developed markets, indicating that the impact of short sellers’ actions can explain the weekend effect to a large extent. In the subsample after 1995, the coefficients of CMONit for developed markets are now positive, indicating that, in the recent decade or so, short sellers’ actions cannot explain the weekend effect. This is because short sellers in developed markets may now hedge in other markets, rather than adjust their positions within one market. However, in developing markets the coefficients of CMONit are still negative and significant, implying that in de- veloping markets investors cannot easily hedge across markets; short sellers still have to adjust their positions around the wee- kends, leading to a strong impact on the weekend effect. Our empirical results strongly support Chen and Singal’s (2003) fin- dings that the weekend effects are partly caused by the actions of short sellers’ position adjustments. Robust Check Different Sub Periods Up until now we set the early sub-sample as the period before Jan 1st, 1995, and the recent sub-sample as the period on or after Jan 1st, 1995. The selection of this breaking date is some- what arbitrary. In order to reduce potential bias, we also select- ed different dates as breaking points, and re-examined the above- mentioned tests. We tried Jan 1st, 1996, Jan 1st, 1997, Jan 1st, 1998, Jan 1st, 1999 and Jan 1st, 2000. The results for all these dates are highly consistent with what we found when we used Jan 1st 1995. Consistent Sub-samples be fo re a nd after 1995 From Table 1 we can see that in the after 1995 sub-sample, there are 60 indices, but that in the before 1995 sub-sample, there are only 37 indices. The problem is that either the indices do not date back to before 1995, or that the CEIC database does not contain data for before 1995. This leads to the question of whether this sample difference leads to any bias. To answer this question, we kept only the 37 indices that have data before 1995, and re-performed all the above regressions on them alone. The results are highly consistent with those in Table 5, indi- cating that the different number of indices before and after 1995 does not lead to severe bias. Short Sales and Put Options Chen and Singal (2003) also provide a substitute explanation besides short selling: the put option. They empirically docu- ment that traders use options when available in preference to short selling, possibly causing the weekend effect to dissipate. Following this line, we also consider the substitution effect of put options for short sales. The following model (3) is thus in- troduced: itiiit iit it rMONDUMCMON itiiit iitiitit rMONDUM CMON PMON (3) whererit is the daily return of market i on date t. MONDUMit is a dummy variable which takes the value of 1 if date t is a Mon- day and 0 otherwise. CMONit is an interaction term of a short sale dummy (1 if the market allows the practice of short sales and 0 otherwise) and the MONDUMit. PMONit is an interaction term of a put option dummy (1 if the market allows the practice of put options and 0 otherwise) and the MONDUMit7. Table 5 shows empirical results different from Chen and Sin- gal’s (2003). The entering of PMONit does not affect the rela- tionship between short sales and the weekend effect. The pat- terns documented in Table 5 do not change at all, and the im- pact of the put options on the weekend effect is trivial. Discussion and Conclusions The weekend effect is a research field full of discussions and controversies. Ever since French (1980), many researchers do- cument the existence of it and provide numerous potential ex- planations. Recently, Chen and Singal (2003) propose an expla- nation that the weekend effect might be linked to short sales. They argue that since short sellers cannot close positions during the weekend, they tend to close their positions before the wee- kend and to re-open them on Mondays in order to avoid poten- tial losses. However, other papers—such as Christophe et al. (2006), and Blau et al. (2007)—declare that there is no empiri- cal evidence to support Chen and Singal’s (2003) explanations. In this paper, we examine the relationship between short sales and the weekend effect from an international perspective. Using 60 indices from around the world, we document the fol- lowing patterns: In the full sample (both before and after 1995) short sellers’ actions can explain the weekend effect in devel- oping markets but not in developed ones. In sub-sample 1 (be- fore 1995) the short sellers’ actions can explain the weekend ef- fect both in developed and developing markets. In sub-sample 2, (after 1995) short sellers’ actions can explain the weekend ef- fect in developing markets but not in developed ones. These re- sults are independent of various potential biases. We propose a new potential explanation: the position adjust- ments of short sellers cause the weekend effect if the investors have to balance their positions in the local markets. This pheno- menon was prevalent everywhere until about a decade ago, and is still prevalent even today in developing markets where capi- al accounts are strictly controlled and cross-market hedges are t 7The data about the availability of put options in each market are also from Charoenrook and Daouk (2004). Copyright © 2013 SciRes. 50  W. L. ZHAI ET AL. Copyright © 2013 SciRes. 51 Table 4. Comparison between developed and developing economies—empirical evidence. re 1995 (37 indices) Sub-sample 2: After 1995 (60 indices) Full sample (60 indices) Sub-sample1: Befo Unit: 10−3 Developed ma Developing Developed Developing Developed Developing rkets markets markets markets markets markets (1) (2) ) (1) ) (1) (1) ) (1) (1) (2(2(2)(2(2) MONDUM −0.5 (−) 397 (−) −0.8 (−) 572 (−) 1.14 (−) 115 (−) −1.6 (−) 834 (−) −0.2 (−) 514 (−) −0.6 (−) 515 (−) 0.484 (13.) 0.906 (14.) 0.628 (11.) 1.507 (8. 0.406 (8. 0.807 (12. ) 31 −0. 6.23 2.29 22 −0. 6.06 3.88 5 −0. 8.76 0.42 53 −0. 4.47 1.85 08 −0. 1.88 2.34 83 −0. 4.69 3.30 CMON −0.170 (−0.89) −1.329 (−4.29) −1.207 (−4.22) −2.159 (−3.18) 0.394 (0.106) −1.081 (−3.01) Constant 00 0.484 (13.00) 90 0.906 (14.90) 73 0.628 (11.13) 97) 1.507 (8.97) 34) 0.406 (8.34) 38 0.807 (12.38) F-value Prob > F 38.83 19.81 0.000 36.77 27.59 0.000 76.45 47.31 19.98 15.06 0.000 3.52 3.06 22.04 15.55 0.000 0.000 0.000 0.000 0.000 0.061 0.047 0.000 0.000 R^2 (%) 0.03 0.03 0.04 0.05 0.17 0.20 0.13 0.20 0.00 0.00 0.00 0.03 Note is the regsulton m) anluent Full sample (60 indices) Before 1995 (37 indices) After 1995 (60 indices) : This table pooledression res based odels (1d (2). t-vas are in pareheses. Table 5. he impacts of put options. T Unit: 10−3 De m ing Develope markets loping rkets Developed markets eveloping markets veloped arkets Develop markets d Deve ma D Model: (3) (3) (3) (3) (3) (3) MONDUM (−) (−) ( (−) (−) (−) − Prob > F Adj R(%) −0.628** 2.57 −0.623** 3.65 0.612 1.23) −1.420* 2.31 −0.821** 2.86 −0.501** 2.82 CMON −0.258 (−1.29) −1.350** (−4.33) 1.295** (−4.30) −2.025** (−2.96) 0.171 (0.62) −1.072** (−2.96) PMON 0.341 (1.34) 0.150 (0.59) −0.768 (−1.77) 0.939 (1.40) 0.553 (1.66) −0.045 (−0.16) Constant 0.484** (13.00) 0.906** (14.90) 0.628** (11.13) 1.507** (8.97) 0.406** (8.34) 0.807** (12.38) F-value 13.81 18.51 32.58 10.69 2.96 10.38 0.000 0.000 0.000 0.000 0.031 0.000 -square0.03 0.05 0.21 0.21 0.01 0.03 Note: *and ficance level atd 1% respectivellues are in paes. d markets in the recent decade because short sellers can now ey th short sales and the weekend effect has already largely dissipated because of the existence of cross-markets hedging. efore holidays: Existence and evi- dence on possible causes. Journal of Finance, 45, 1611-1626. doi:10.1111/j.1540-6 **represent signi 5% any. t-varenthes not as easy. However, the weekend effect dissipates in develop- tween e hedge internationally rather than being limited to local markets. This is a strong support for Chen and Singal’s (2003) story. Recently more and more researchers tend to explain the wee- kend effect through the investigation of intraday patterns. Th us tend to use a relatively short sample period (one year, for example) due to the large volume of data. However, consider- ing the empirical results of this paper, we have enough evi- dence to argue that too short a sample period may lead to the study of an already weakened weekend effect (especially forde- veloped markets). This explains why recent studies cannot find empirical evidence to support Chen and Singal (2003). For example, Blau, et al. (2007) use a one-year sample of the NYSE listed stocks, and declare that they do not find abundant short selling on Mondays. Christophe, et al. (2006) use NASDAQ stocks from September 2000 to July 2001 and find no test which supports the idea that the Monday-Friday return differ- ences are closely linked to the Monday-Friday differences in short sales. But since both of these studies employ US data (a developed market) in the recent decade, the relationship be- So their evidence cannot be considered to be weakening Chen and Singal’s (2003) conclusion. REFERENCES Ariel, R. (1990). High stock returns b 261.1990.tb03731.x k, L. (1996). An empiricaAsquith, P., & Muelbroel investigation of short , 29, interest, working paper. Abraham, A., & Ikenberry, D. (1994). The individual investor and the weekend effect. Journal of Financial and Quantitative Analysis 263-277. doi:10.2307/2331225 Blau, B., Van Ness, B., & Van Ness, R. (2007). Short selling and the weekend effect for NYSE securities, working paper. Cai, J., Li, Y., & Qi, Y. (2006). The day of the week effect: New evi- dence from Chinese stock market. The Chinese Economy, 39, 71-88. doi:10.2753/CES1097-1475390206 Cai, J., Kazemi, H. S., He, J., & Zhai, W. (2013). Weekend effect and short sales: International evidence. International Advances in Eco-  W. L. ZHAI ET AL. nomic Research, 19, 209-211. doi:10.1007/s11294-013-9398-z han, S. H., Leung, W. K., & Wang, K. (2004). The impact of institu- tional investors on the Monday sea C sonal. Journal of Business, 77, 967-986. doi:10.1086/422630 hang, E., Pinegar, J., & Ravichandran, R. (1993). International evi- dence on the robustness of the day-of-the-week effect. Journal o Cf Fi- nancial and Quantitative Analysis, 28, 497-513. doi:10.2307/2331162 haroenrook, A., & Daouk, H. (2005)C. The world pricing of short sell- C 540-6261.00541 ing, working paper. hen, H., & Singal, V. (2003). Role of speculative short sales in price formation: The case of the weekend effect. Journal of Finance, 58, 685-705. doi:10.1111/1 eturns, working paper. Christophe, S., Ferri, M., & Angel, J. (2006). Short selling and the wee- kend effect in stock r Condoyanni, I., O’Hanlon, J., & Ward, C. W. R. (1989). Day of the week effects on stock returns: International evidence. Journal of Bu- siness Finance and Acc ou nt in g , 14, 159-174. doi:10.1111/j.1468-5957.1987.tb00536.x eChow, P., Hutton, A. Meulbroek, L., & SloDan, R. (2001). Short sel- lers, fundamental analysis, and stock returns. Journal of Financial Economics, 61, 77-106. doi:10.1016/S0304-405X(01)00056-3 ubois, M., & Louvet, P. (1996). The day-of-the- tional evidence. Journal of Banking and F Dweek effect: Interna- inance, 20, 1463-1484. doi:10.1016/0378-4266(95)00054-2 ench, K. (1980). Stock returns and the weekend effect. Journal of Fi- Fr 016/0304-405X(80)90021-5nancial Economics, 8 , 55-69. doi:10.1 Gibbons, M., & Hess, P. (1981). Day of the week effects and asset re- turns. Journal of Business, 5 4 , 579-596. doi:10.1086/296147 Hindmarch, S., Jentsch, D., & Drew, D. (1984). A note on Canadian stock returns and the weekend effect. Journal of Business Admini- Ja al evidence. Journal of Fina nce, 40, 433-454. stration, 14, 163-172. ffe, J., & Westerfield, R. (1985). The weekend effect in common stock returns: The internation doi:10.1111/j.1540-6261.1985.tb04966.x eim, D. (1989). Trading patterns, bid-ask spread, and estimated secu- rity returns. Journal of Financial Economi Kcs, 25, 75-89. doi:10.1016/0304-405X(89)90097-4 eim, D., & Stambaugh, R. (1984). A further investigation kend effect in stock returns. Journal o K of the wee- f Finance, 39, 819-835. doi:10.1111/j.1540-6261.1984.tb03675.x akonishok, J., & Maberly, E. (1990). The weekend effect: T patterns of individual and institutional inv Lrading estors. Journal of Finance, 45, 231-244. doi:10.1111/j.1540-6261.1990.tb05089.x ias, R., & Starks, L. (1995). The day of the week anomaly: The role of institutional investors. Financial Analysts Journal, 51, 5 S 8-67. doi:10.2469/faj.v51.n3.1906 ang, K., Li, Y., & Erickson, J. (1997). A new look at the M effect. Journal of Finance, 52 Wonday , 2171-2186. doi:10.1111/j.1540-6261.1997.tb02757.x Copyright © 2013 SciRes. 52 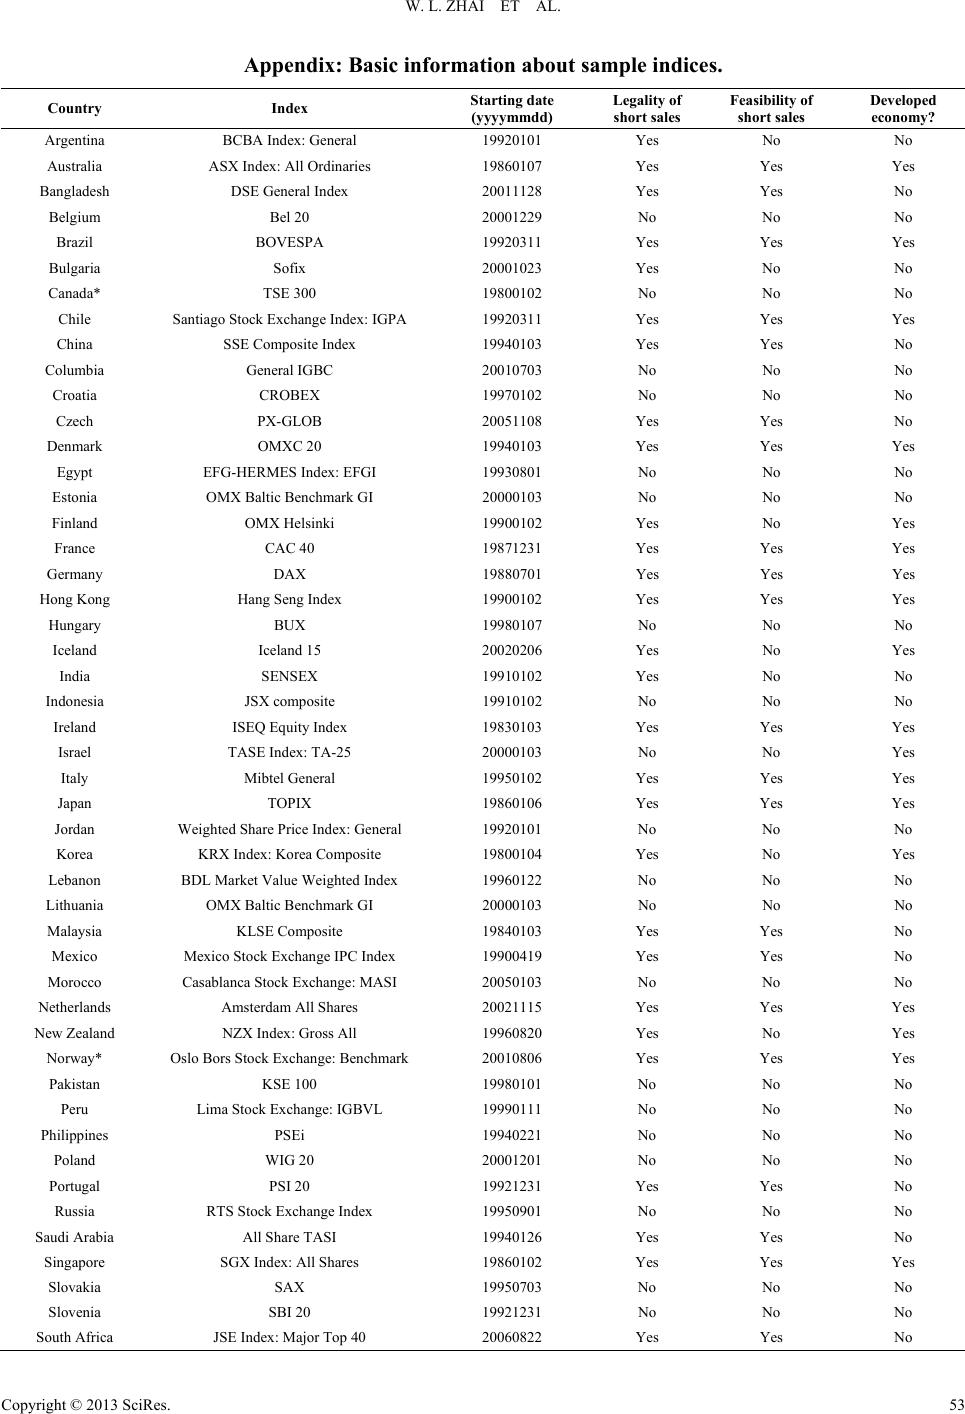 W. L. ZHAI ET AL. Appendix: Basic information about sample indices. Country Index Starting date (yyyymmdd) Legality of short sales Feasibil ity of short sales Developed economy? Argentina BCBA Index: General 19920101 Yes No No Australia ASX Index: All Ordinaries 19860107 Yes Yes Yes Bangladesh DSE General Index 20011128 Yes Yes No Belgium Bel 20 20001229 No No No Brazil BOVESPA 19920311 Yes Yes Yes Bulgaria Sofix 20001023 Yes No No Canada* TSE 300 19800102 No No No Chile Santiago Stock Exchange Index: IGPA 19920311 Yes Yes Yes China SSE Composite Index 19940103 Yes Yes No Columbia General IGBC 20010703 No No No Croatia CROBEX 19970102 No No No Czech PX-GLOB 20051108 Yes Yes No Denmark OMXC 20 19940103 Yes Yes Yes Egypt EFG-HERMES Index: EFGI 19930801 No No No Estonia OMX Baltic Benchmark GI 20000103 No No No Finland OMX Helsinki 19900102 Yes No Yes France CAC 40 19871231 Yes Yes Yes Germany DAX 19880701 Yes Yes Yes Hong Kong Hang Seng Index 19900102 Yes Yes Yes Hungary BUX 19980107 No No No Iceland Iceland 15 20020206 Yes No Yes India SENSEX 19910102 Yes No No Indonesia JSX composite 19910102 No No No Ireland ISEQ Equity Index 19830103 Yes Yes Yes Israel TASE Index: TA-25 20000103 No No Yes Italy Mibtel General 19950102 Yes Yes Yes Japan TOPIX 19860106 Yes Yes Yes Jordan Weighted Share Price Index: General 19920101 No No No Korea KRX Index: Korea Composite 19800104 Yes No Yes Lebanon BDL Market Value Weighted Index 19960122 No No No Lithuania OMX Baltic Benchmark GI 20000103 No No No Malaysia KLSE Composite 19840103 Yes Yes No Mexico Mexico Stock Exchange IPC Index 19900419 Yes Yes No Morocco Casablanca Stock Exchange: MASI 20050103 No No No Netherlands Amsterdam All Shares 20021115 Yes Yes Yes New Zealand NZX Index: Gross All 19960820 Yes No Yes Norway* Oslo Bors Stock Exchange: Benchmark 20010806 Yes Yes Yes Pakistan KSE 100 19980101 No No No Peru Lima Stock Exchange: IGBVL 19990111 No No No Philippines PSEi 19940221 No No No Poland WIG 20 20001201 No No No Portugal PSI 20 19921231 Yes Yes No Russia RTS Stock Exchange Index 19950901 No No No Saudi Arabia All Share TASI 19940126 Yes Yes No Singapore SGX Index: All Shares 19860102 Yes Yes Yes Slovakia SAX 19950703 No No No Slovenia SBI 20 19921231 No No No South Africa JSE Index: Major Top 40 20060822 Yes Yes No Copyright © 2013 SciRes. 53  W. L. ZHAI ET AL. Continued Spain IGBM General 19800102 Yes No Yes Sweden SSE 30 19860930 Yes Yes Yes Switzerland All Swiss Shares 19990628 Yes Yes Yes Taiwan TSEC Index 19940105 Yes Yes Yes Thailand SET Index 19871218 Yes Yes No Turkey ISE NPI: 1st Sec: 100 19981001 Yes Yes No UK FT 30 19860107 Yes Yes Yes Ukraine PFTS Index 19971103 No No No U.S. Dow Jones Index 19800101 Yes Yes Yes U.S. S&P 500 19800101 Yes Yes Yes Venezuela Caracas Stock Exchange Index: IBC 19940105 No No No *Note: for Canadian market, TSE 300 is used on and before Apr. 30, 2002. On or after May 1, 2002, the TSE 300 is no longer used so we use TSX composite Index instead. For Norway market, Norway index (total) is used on and before September 28th, 2001, after that, the Oslo Borse Stock Exchange Benchmark index is used instead because the former is no longer utilized. Copyright © 2013 SciRes. 54
|