Paper Menu >>
Journal Menu >>
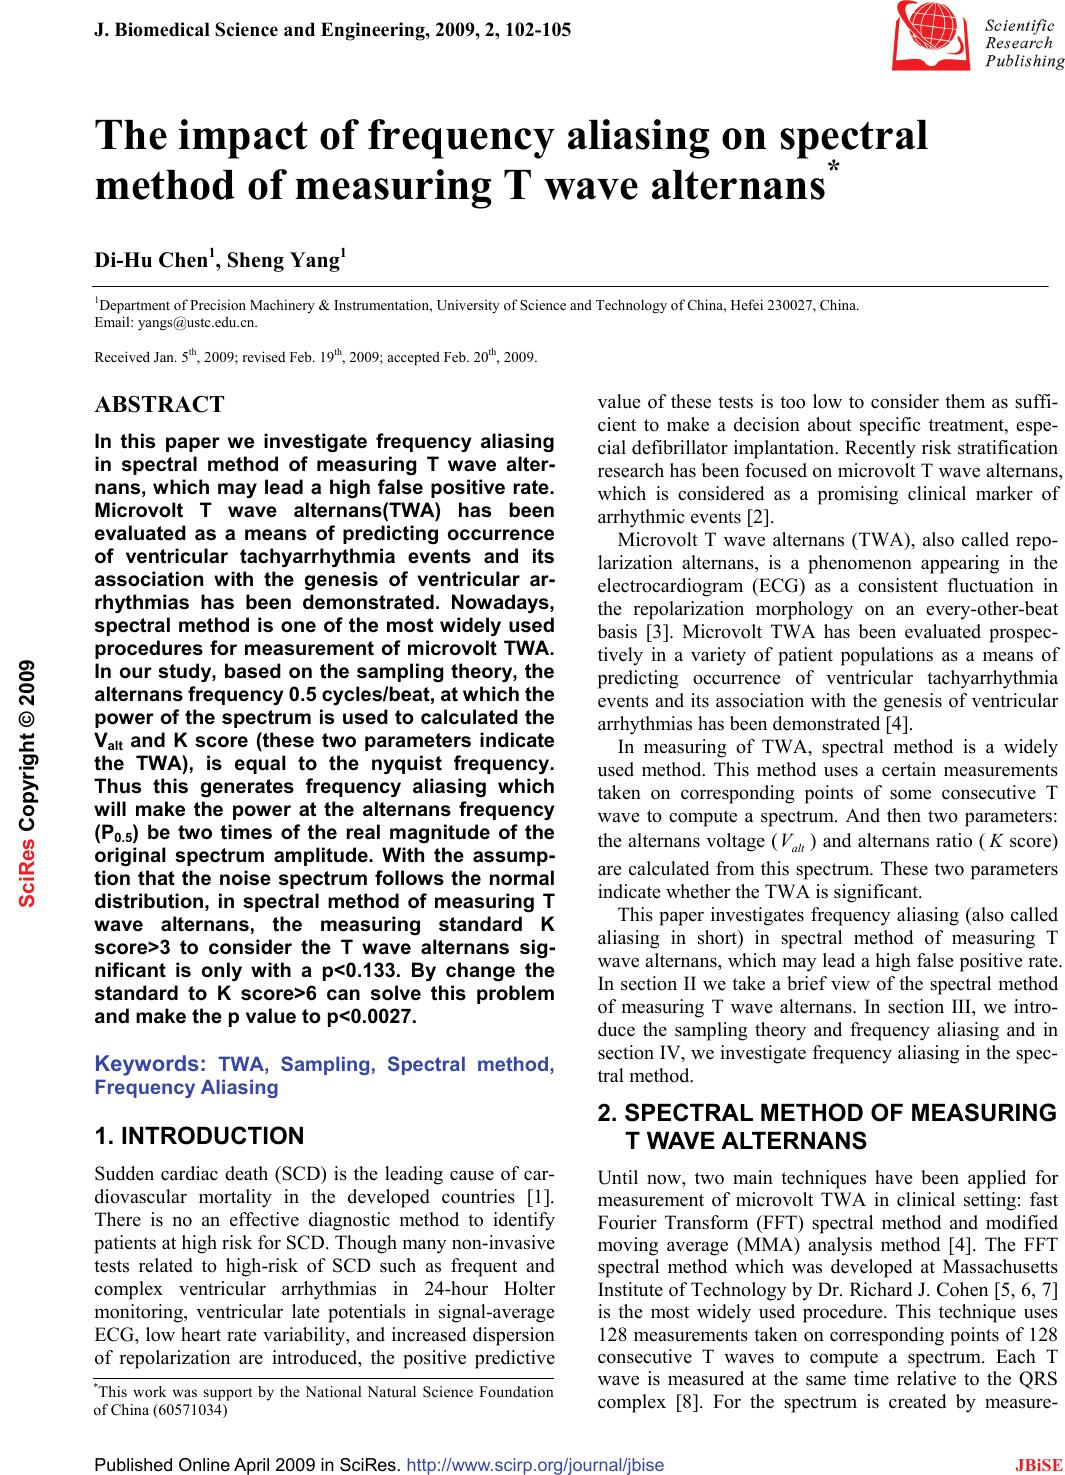 J. Biomedical Science and Engineering, 2009, 2, 102-105 Published Online April 2009 in SciRes. http://www.scirp.org/journal/jbise JBiSE 1 The impact of frequency aliasing on spectral method of measuring T wave alternans* Di-Hu Chen1, Sheng Yang1 1Department of Precision Machinery & Instrumentation, University of Science and Technology of China, Hefei 230027, China. Email: yangs@ustc.edu.cn. Received Jan. 5th, 2009; revised Feb. 19th, 2009; accepted Feb. 20th, 2009. ABSTRACT In this paper we investigate frequency aliasing in spectral method of measuring T wave alter- nans, which may lead a high false positive rate. Microvolt T wave alternans(TWA) has been evaluated as a means of predicting occurrence of ventricular tachyarrhythmia events and its association with the genesis of ventricular ar- rhythmias has been demonstrated. Nowadays, spectral method is one of the most widely used procedures for measurement of microvolt TWA. In our study, based on the sampling theory, the alternans frequency 0.5 cycles/beat, at which the power of the spectrum is used to calculated the Valt and K score (these two parameters indicate the TWA), is equal to the nyquist frequency. Thus this generates frequency aliasing which will make the power at the alternans frequency (P0.5) be two times of the real magnitude of the original spectrum amplitude. With the assump- tion that the noise spectrum follows the normal distribution, in spectral method of measuring T wave alternans, the measuring standard K score>3 to consider the T wave alternans sig- nificant is only with a p<0.133. By change the standard to K score>6 can solve this problem and make the p value to p<0.0027. Keywords: TWA, Sampling, Spectral method, Frequency Aliasing 1. INTRODUCTION Sudden cardiac death (SCD) is the leading cause of car- diovascular mortality in the developed countries [1]. There is no an effective diagnostic method to identify patients at high risk for SCD. Though many non-invasive tests related to high-risk of SCD such as frequent and complex ventricular arrhythmias in 24-hour Holter monitoring, ventricular late potentials in signal-average ECG, low heart rate variability, and increased dispersion of repolarization are introduced, the positive predictive value of these tests is too low to consider them as suffi- cient to make a decision about specific treatment, espe- cial defibrillator implantation. Recently risk stratification research has been focused on microvolt T wave alternans, which is considered as a promising clinical marker of arrhythmic events [2]. Microvolt T wave alternans (TWA), also called repo- larization alternans, is a phenomenon appearing in the electrocardiogram (ECG) as a consistent fluctuation in the repolarization morphology on an every-other-beat basis [3]. Microvolt TWA has been evaluated prospec- tively in a variety of patient populations as a means of predicting occurrence of ventricular tachyarrhythmia events and its association with the genesis of ventricular arrhythmias has been demonstrated [4]. In measuring of TWA, spectral method is a widely used method. This method uses a certain measurements taken on corresponding points of some consecutive T wave to compute a spectrum. And then two parameters: the alternans voltage (alt V) and alternans ratio ( K score) are calculated from this spectrum. These two parameters indicate whether the TWA is significant. This paper investigates frequency aliasing (also called aliasing in short) in spectral method of measuring T wave alternans, which may lead a high false positive rate. In section II we take a brief view of the spectral method of measuring T wave alternans. In section III, we intro- duce the sampling theory and frequency aliasing and in section IV, we investigate frequency aliasing in the spec- tral method. 2. SPECTRAL METHOD OF MEASURING T WAVE ALTERNANS Until now, two main techniques have been applied for measurement of microvolt TWA in clinical setting: fast Fourier Transform (FFT) spectral method and modified moving average (MMA) analysis method [4]. The FFT spectral method which was developed at Massachusetts Institute of Technology by Dr. Richard J. Cohen [5, 6, 7] is the most widely used procedure. This technique uses 128 measurements taken on corresponding points of 128 consecutive T waves to compute a spectrum. Each T wave is measured at the same time relative to the QRS complex [8]. For the spectrum is created by measure- *This work was support by the National Natural Science Foundation of China (60571034) SciRes Copyright © 2009 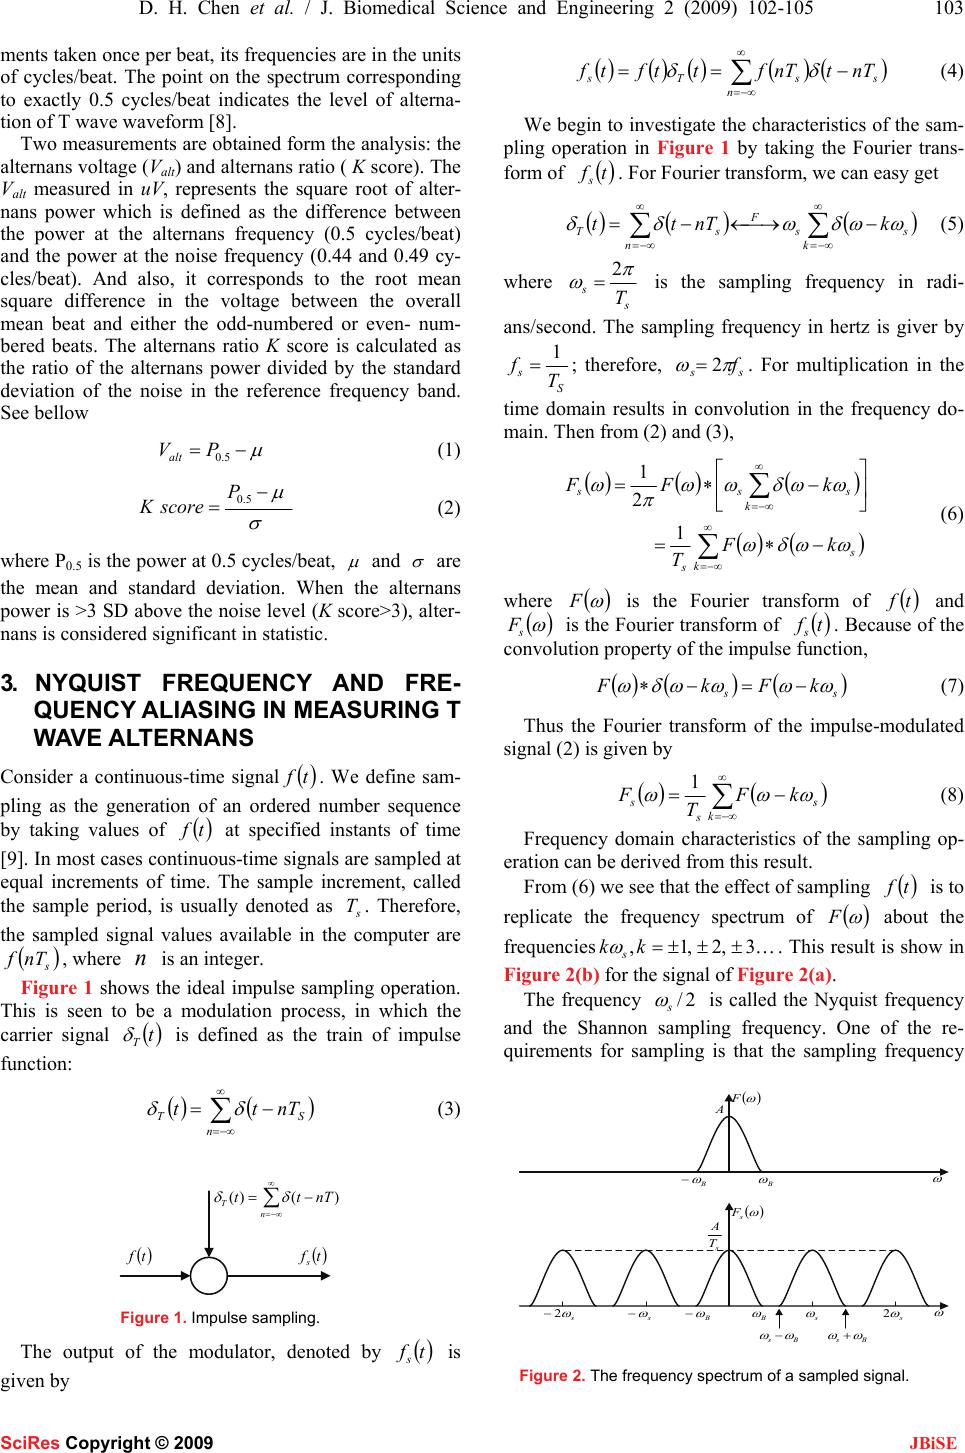 D. H. Chen et al. / J. Biomedical Science and Engineering 2 (2009) 102-105 103 SciRes Copyright © 2009 JBiSE ments taken once per beat, its frequencies are in the units of cycles/beat. The point on the spectrum corresponding to exactly 0.5 cycles/beat indicates the level of alterna- tion of T wave waveform [8]. Two measurements are obtained form the analysis: the alternans voltage (Valt) and alternans ratio ( K score). The Valt measured in uV, represents the square root of alter- nans power which is defined as the difference between the power at the alternans frequency (0.5 cycles/beat) and the power at the noise frequency (0.44 and 0.49 cy- cles/beat). And also, it corresponds to the root mean square difference in the voltage between the overall mean beat and either the odd-numbered or even- num- bered beats. The alternans ratio K score is calculated as the ratio of the alternans power divided by the standard deviation of the noise in the reference frequency band. See bellow μ −= 5.0 PValt (1) σ μ − =5.0 P scoreK (2) where P0.5 is the power at 0.5 cycles/beat, μ and σ are the mean and standard deviation. When the alternans power is >3 SD above the noise level (K score>3), alter- nans is considered significant in statistic. 3. NYQUIST FREQUENCY AND FRE- QUENCY ALIASING IN MEASURING T WAVE ALTERNANS Consider a continuous-time signal () tf . We define sam- pling as the generation of an ordered number sequence by taking values of () tf at specified instants of time [9]. In most cases continuous-time signals are sampled at equal increments of time. The sample increment, called the sample period, is usually denoted as s T. Therefore, the sampled signal values available in the computer are () s nTf , where n is an integer. Figure 1 shows the ideal impulse sampling operation. This is seen to be a modulation process, in which the carrier signal () t T δ is defined as the train of impulse function: ()( ) ∑ ∞ −∞= −= n ST nTtt δδ (3) ∑ ∞ −∞= −= n T nTtt )()( δδ () tf () tf s Figure 1. Impulse sampling. The output of the modulator, denoted by ( ) tfs is given by ()()()() () ∑ ∞ −∞= −== n ssTs nTtnTfttftf δδ (4) We begin to investigate the characteristics of the sam- pling operation in Figure 1 by taking the Fourier trans- form of ( ) tfs. For Fourier transform, we can easy get ()( )() ∑∑ ∞ −∞= ∞ −∞= −⎯→←−= k ss F n sT knTtt ωωδωδδ (5) where s sT π ω 2 = is the sampling frequency in radi- ans/second. The sampling frequency in hertz is giver by S sT f1 =; therefore, ss f π ω 2 = . For multiplication in the time domain results in convolution in the frequency do- main. Then from (2) and (3), ()()( ) () () ∑ ∑ ∞ −∞= ∞ −∞= −∗= ⎥ ⎦ ⎤ ⎢ ⎣ ⎡−∗= k s s k sss kF T kFF ωωδω ωωδωω π ω 1 2 1 (6) where ( ) ω F is the Fourier transform of ( ) tf and ( ) ω s F is the Fourier transform of () tfs. Because of the convolution property of the impulse function, ( ) ( )( ) ss kFkF ω ω ω ω δ ω −= − ∗ (7) Thus the Fourier transform of the impulse-modulated signal (2) is given by () () ∑ ∞ −∞= −= k s s skF T F ωωω 1 (8) Frequency domain characteristics of the sampling op- eration can be derived from this result. From (6) we see that the effect of sampling ( ) tf is to replicate the frequency spectrum of () ω F about the frequencies K3,2,1, ± ± ± = kk s ω . This result is show in Figure 2(b) for the signal of Figure 2(a). The frequency 2/ s ω is called the Nyquist frequency and the Shannon sampling frequency. One of the re- quirements for sampling is that the sampling frequency () ω F B ω − B ω ω () ω s F A s T A ω B ω − B ω s ω − s ω 2− s ω s ω 2 Bs ωω + Bs ωω − Figure 2. The frequency spectrum of a sampled signal. 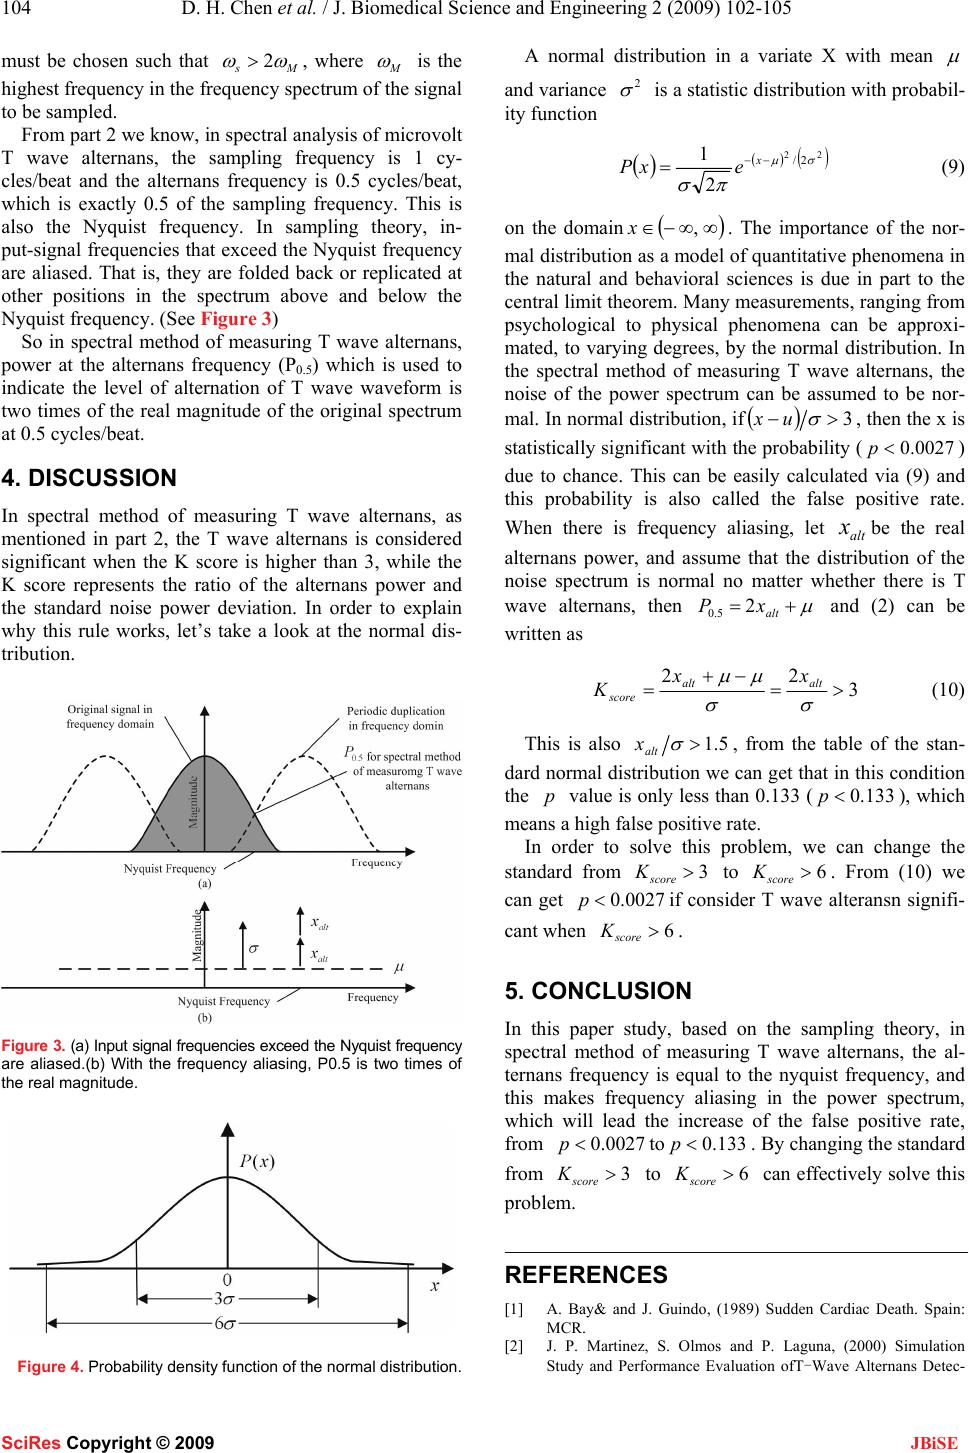 104 D. H. Chen et al. / J. Biomedical Science and Engineering 2 (2009) 102-105 SciRes Copyright © 2009 JBiSE must be chosen such that Ms ω ω 2>, where M ω is the highest frequency in the frequency spectrum of the signal to be sampled. From part 2 we know, in spectral analysis of microvolt T wave alternans, the sampling frequency is 1 cy- cles/beat and the alternans frequency is 0.5 cycles/beat, which is exactly 0.5 of the sampling frequency. This is also the Nyquist frequency. In sampling theory, in- put-signal frequencies that exceed the Nyquist frequency are aliased. That is, they are folded back or replicated at other positions in the spectrum above and below the Nyquist frequency. (See Figure 3) So in spectral method of measuring T wave alternans, power at the alternans frequency (P0.5) which is used to indicate the level of alternation of T wave waveform is two times of the real magnitude of the original spectrum at 0.5 cycles/beat. 4. DISCUSSION In spectral method of measuring T wave alternans, as mentioned in part 2, the T wave alternans is considered significant when the K score is higher than 3, while the K score represents the ratio of the alternans power and the standard noise power deviation. In order to explain why this rule works, let’s take a look at the normal dis- tribution. Figure 3. (a) Input signal frequencies exceed the Nyquist frequency are aliased.(b) With the frequency aliasing, P0.5 is two times of the real magnitude. Figure 4. Probability density function of the normal distribution. A normal distribution in a variate X with mean μ and variance 2 σ is a statistic distribution with probabil- ity function () () () 2 22/ 2 1 σμ πσ −− =x exP (9) on the domain ( ) ∞ ∞ − ∈ ,x. The importance of the nor- mal distribution as a model of quantitative phenomena in the natural and behavioral sciences is due in part to the central limit theorem. Many measurements, ranging from psychological to physical phenomena can be approxi- mated, to varying degrees, by the normal distribution. In the spectral method of measuring T wave alternans, the noise of the power spectrum can be assumed to be nor- mal. In normal distribution, if () 3>− σ ux, then the x is statistically significant with the probability (0027.0 < p) due to chance. This can be easily calculated via (9) and this probability is also called the false positive rate. When there is frequency aliasing, let alt xbe the real alternans power, and assume that the distribution of the noise spectrum is normal no matter whether there is T wave alternans, then μ += alt xP2 5.0 and (2) can be written as 3 22 >= −+ = σσ μμ altalt score xx K (10) This is also 5.1> σ alt x, from the table of the stan- dard normal distribution we can get that in this condition the p value is only less than 0.133 (133.0<p), which means a high false positive rate. In order to solve this problem, we can change the standard from 3> score K to 6> score K. From (10) we can get 0027.0 < pif consider T wave alteransn signifi- cant when 6> score K. 5. CONCLUSION In this paper study, based on the sampling theory, in spectral method of measuring T wave alternans, the al- ternans frequency is equal to the nyquist frequency, and this makes frequency aliasing in the power spectrum, which will lead the increase of the false positive rate, from 0027.0 < pto 133.0 < p. By changing the standard from 3> score K to 6> score K can effectively solve this problem. REFERENCES [1] A. Bay& and J. Guindo, (1989) Sudden Cardiac Death. Spain: MCR. [2] J. P. Martinez, S. Olmos and P. Laguna, (2000) Simulation Study and Performance Evaluation ofT-Wave Alternans Detec- 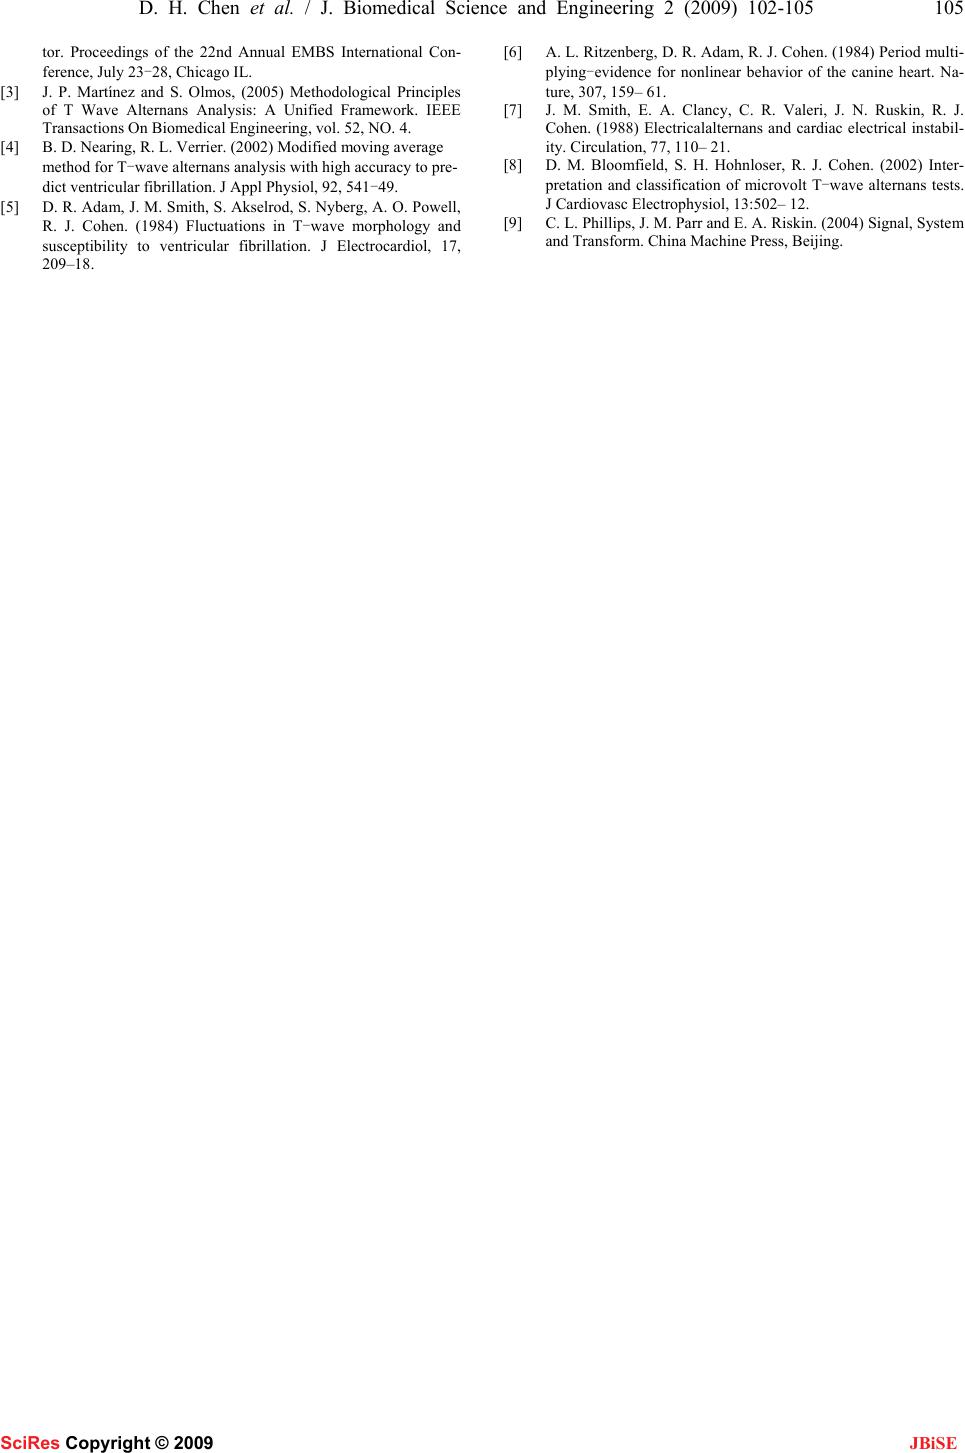 D. H. Chen et al. / J. Biomedical Science and Engineering 2 (2009) 102-105 105 SciRes Copyright © 2009 JBiSE tor. Proceedings of the 22nd Annual EMBS International Con- ference, July 23-28, Chicago IL. [3] J. P. Martínez and S. Olmos, (2005) Methodological Principles of T Wave Alternans Analysis: A Unified Framework. IEEE Transactions On Biomedical Engineering, vol. 52, NO. 4. [4] B. D. Nearing, R. L. Verrier. (2002) Modified moving average method for T-wave alternans analysis with high accuracy to pre- dict ventricular fibrillation. J Appl Physiol, 92, 541-49. [5] D. R. Adam, J. M. Smith, S. Akselrod, S. Nyberg, A. O. Powell, R. J. Cohen. (1984) Fluctuations in T-wave morphology and susceptibility to ventricular fibrillation. J Electrocardiol, 17, 209–18. [6] A. L. Ritzenberg, D. R. Adam, R. J. Cohen. (1984) Period multi- plying-evidence for nonlinear behavior of the canine heart. Na- ture, 307, 159– 61. [7] J. M. Smith, E. A. Clancy, C. R. Valeri, J. N. Ruskin, R. J. Cohen. (1988) Electricalalternans and cardiac electrical instabil- ity. Circulation, 77, 110– 21. [8] D. M. Bloomfield, S. H. Hohnloser, R. J. Cohen. (2002) Inter- pretation and classification of microvolt T-wave alternans tests. J Cardiovasc Electrophysiol, 13:502– 12. [9] C. L. Phillips, J. M. Parr and E. A. Riskin. (2004) Signal, System and Transform. China Machine Press, Beijing. |