Paper Menu >>
Journal Menu >>
 Journal of Geographic Information System, 2011, 3, 62-84 doi:10.436/jgis.2011.31005 Published Online January 2011 (http://www.SciRP.org/journal/jgis) Copyright © 2011 SciRes. JGIS Urbanization and Quality of Urban Environment Using Remote Sensing and GIS Techniques in East Delhi-India Atiqur Rahman¹, Yogesh Kumar1, Shahab Fazal2, Sunil Bhaskaran3 1Department of Geography, Faculty of Natural Sciences, Jamia Millia Islamia University, New Delhi, India 2Department of Geography, Faculty of Science, Aligarh Muslim University, Aligarh, India 3Remote Sensi ng an d GI S Division, Dep artment of Envi ro nmental, Geog rap hi c a nd Geol o gi c al Sci e nces, Lehman College, City University of New York, Bronx, USA E-mail: ateeqgeog@yahoo.co.in Received November 12, 2010; revised December 14, 2010; accepted December 27, 2010 Abstract An explosive increase of urban population, practically in all major cities and towns, has the consequent strain on the existing system manifested in an environmental chaos. The phenomena of accelerated urbanisation is the main culprit, wherein besides bringing higher standard of living, it has also brought problems, as growth of dense and unplanned residential areas, environmental pollution, non-availability of services and amenities, solid waste etc. Remote sensing satellite data is suitable for urban land use mapping to get detail and up- to-date information for environmental management. Where as GIS helps in developing database system for urban information, which supports decision making process. Development of digital database on all aspects of land use and urban planning is the next crucial task for the future in which remote sensing based informa- tion is going to play a major role. In Delhi, rise in population and growth in economic activity has led to en- vironmental degradation. With this view an attempt has been made to study the quality of urban environment in the East district of Delhi, which is experiencing very high urban growth with 98.75% urban population in 2001. For this study Landsat ASTER (MSS) data of year 2001 (15 m Ground resolution), Guide map of the year 1982 and demographic and environmental data has been used. Eight parameters were selected, which affect the urban environmental quality, namely built-up area, open spaces, household density, occupancy ra- tio, population density, accessibility to roads, noise and smell affected area. The study shows that the quality of environment has been degraded when we compare 1982 and 2003 data. Most of the East district was in a better state of environment in 1982, but in 2003 things have been changed and now 50% area is in very good, fair and desirable condition. The public participation and involvement should be encouraged planning and decisions making for the improvement in better urban environmental quality. Keywords: Urban i za t io n , U rb a n Env ir onmental Quality, Remote Sensing & GIS, East Delhi-India 1. Introduction Urban growth all over the world is taking place which is unequal but the rate of urbanization is very fast in the developing countries especially in Asia. In 1800 A.D, only 3% of the world’s population lived in urban centres and this figure reached to 14% in 1900 and in 2000, about 47% (2.8 b illion) pe ople were liv ing in urban areas. India no longer lives in villages and 79 million people were living in urban areas in India in 1961 but in 2001 about 285 million people resides in urban areas [1]. In 1991, there were 23 metropolitan cities in India [2] which increased to 35 in 2001 [3] some of the prominent are Mumbai, Delhi, Kolkatta and Chennai etc. As urban population increases, the demand of land for various ur- ban activities also increases. In India the process of ur- banization gained momentum with the start of industrial revolution and globalization way back in 1970s. Forests were cleared, grasslands ploughed or grazed, wetlands drained and croplands encroached upon under the influ- ence of expanding cities, yet never as fast as in the last decade. The main basis of urbanization is the economic change and in particular the growth of secondary and tertiary occupation in urban areas [4].  A. RAHMAN ET AL. Copyright © 2011 SciRes. JGIS 63 The high rate of increase in the urban population has created many problems in the urban areas of Indian cities. Doubling and tripling of urban population practically in all major cities and towns and the consequent strain on the existing system manifested in an environmental chaos. Every major city of India faces the same prolifer- ating problems of urban expansion, inadequate housing, poor transportation system, poor sewerage, erratic elec- tric supply, insufficient drinking water supplies etc. An increasing number of trucks, buses, cars, three-wheelers and motorcycles all spewing uncontrolled fumes, surge in sometimes-haphazard patterns over city streets jamm- ed with jaywalking pedestrians, rickshaw, cattle, and goats. The phenomena of accelerated urbanization is the main culprit, wherein besides bringing higher standard of living has also brought problems of growth of dense and unplanned residential areas, environmental pollution, non-availability of services and amenities and solid waste generation and growth of slums. The rapid growth of Delhi in past decades has resulted in significant de- crease in the quality of environment. Rise in population and growth in economic activity has led to environ- mental degradation in Delhi. Emerging future of Delhi in the light of its past experiences, current trends, and de- velopment initiatives is one of the importan t issue which shows different social and physical factors affecting the housing and quality of life in Delhi [5]. After independ- ence, when Delhi witnessed a large influx of migrants, within a very short time, the population of Delhi in- creased more than two folds. To house such a large mi- grant people city has to expand but the rate of expansion is very fast, unplanned, uncontrolled and most of them are illegal [6]. Each urban centre has a number of environmental problems with varying scale and scopes which are influ- enced by factors such as size of population and its den- sity, climatic conditions, water resources and the flora and fauna in and ar oun d the urb an cent re [1]. Th e state of urban environment all over India is deteriorating so fast that the sustainability of the cities is threatened. In metro cities, land environment is under stress due to the pres- sure of rapid urbanization. Population growth and in-migration of poor people, industrial growth, ineffi- cient and inadequate traffic corridors, poor environ- mental infrastructure, etc. are the main factors that have deteriorated the overall quality of the city environment. As the cities expand and population increases, the re- sources, which are limited, are shared. Housing, water supply, roads, drainage, transport, education, health ser- vices, police and fire services, etc. have not been able to keep pace with the prevailing urban growth rate that leads to degrading urban environmental quality. The quality of environment of an urban area is deter- mined by the intricate process of mankind’s making liv- ing an enjoyable one. One of the more interesting ques- tions with regard to urban environmental quality is how to assess it, objectively and co mparatively, the quality of a city’s built-up area. Is it the environmental quality of an isolated residential building or that of a residential complex or a neighbourhood? Some city dwellers may instinctively define what environmental quality means for them: they would emphasize the need for cleanliness in the streets and arou nd the trash dumpsters, they would mention noise problems caused by a variety of sources, they would describe the lack of certain services, and so on. There are many approaches discussed and compared for housing quality studies and environmental assess- ment. Social and physical environment of the Durgapur city had been assessed by observing the effect of air quality on land use pattern and population density using overlay method [7]. The white paper of Delhi describes the state of urban environment of Delhi and worked out for assessing the pollution trends and the prescribed am- bient standards [8]. The quality of urban environment is determined from two directional approaches one is the ‘Total City Environment’ and the other is ‘Appraisal of Individual Buildings’ i.e., quality of life and quality of development respectively [9]. In present study the ‘Qual- ity of Urban Environment’ is assessed from the ‘Total City Environment Approach’ i.e., Quality of Life. In order to objectively evaluate the quality of a home in a particular environment compared with a home in another part of the city, we would need objective data and a precise measuring tool. The application of remote sensing data as well as its integration in GIS domain provides planners and implementing agencies timely information on various aspects. Information acquired through spatial technologies not only helps in the envi- ronmental and urban planners during policy formulation and in implementation process, but also provides valu- able database for monitoring and future planning pur- poses. Indian satellite data from sensors like IRS-1D, LISS-III MSS and PAN merged products can be very useful in urban analysis and urban land use mapping [10]. Digital Mapping Technique has been applied for infor- mation generation and making an up-to-date urban in- formation [11]. The quality of urban residential envi- ronment of Ujjain city has been assessed using aerial remote sensing and limited field survey in reference of physical parameters by ‘Overlay’ and ‘Assigning value to variables’ method, i.e., ‘App raisal of individual build - ings approach’ or Quality of Development [12]. An at- tempt has been made to reconcile the differences be- tween the typical approach es to Multi Criteria Evaluation used in Vector and Raster GIS [13]. Buffer analysis of  A. RAHMAN ET AL. Copyright © 2011 SciRes. JGIS 64 physical parameters, which are identified and mapped from aerial photographs and limited field checks, and estimation of the affected population are applied to as- sess the quality of urban environment of Dwarka in Delhi [14]. Temperature data, derived from Landsat ETM+, Vegetation Index (VI) derived from high resolution IK- ONOS multi-spectral images, digitized data of the city urban infrastructure and 3-D virtual reality models were integrated to assess urban environment quality of Hong Kong [9]. The change of urban environment and its im- pact have direct repercussion on the people and their living condition. Therefore, it was thought to assess the quality of urban environment in one of the fastest grow- ing district of Delhi with the help of remote sensing and GIS technique. 2. Objectives The main objective of the paper is assessing the envi- ronmental quality in East district of Delhi Metropolitan Region (DMR) using physical and other parameters, which are derived from remote sensing satellite and sec- ondary data. The specific research objectives of the paper are 1) to assess the changing pattern of environmental quality 2) to evaluate the urban environment both quali- tatively and quantitatively by using weighted overlay method and lastly 3) to recognize the factors leading to such conditions and to evaluate the possibilities of im- provement of urban environment by public participation. 3. Study Area: East Delhi-India Delhi, the capital of India spreads over an area of 1,463 sq. km. East District of Delhi is located on the eastern side of river Yamuna between 28° 34’ 47” to 28° 40’ 47” N latitude and 77° 15’ 05” to 77° 20’ 37” E longitude Figure 1, having an area of about 64 km2. It is flanked by Gaziabad and NOIDA district of Uttar Pradesh in east and south respectively. Among the nine Districts, East district has three tehsil, Geeta Colony, Vivek Vihar and Preet Vihar, 25 administrative blocks (Figure 2) and has three villages (Vill), five Census towns (CT) apart from Delhi Municipal Corporation’s Sahadara Zone. The East district of Delhi was chosen for this study to asses the quality of urban env ironment because it is the one of the populous district and developing very fast. East District is entirely located on the eastern side Yamuna plain, which used to be a very fertile levelled land but it is fast converting in to built-up areas. The climate is semi-arid with maximum rain fall in the month of July (296 mm), October to December are dry. While the hottest months are May and June with mercury levels touching 48°C whereas the lowest falls to 4°C at the end of December and early January. The total Delhi popula- tion was nearly 0.4 million in 1901, which kept on in- creasing slowly and it was 1.74 million in 1951 and 9.42 million in 1991. Sharp rise in population occurred in the last decade (1991-2001) and Delhi population reached to 13.8 million in 2001 [3] and as per Registrar General of India (RGI) estimates Delhi’s population will be 20.78 million by 2015 [15]. East district has been experiencing very high growth rate of urban population and it ranks 6th among all districts with 90.19% urban population in 1991, while 98.75% urb an popu lation growth record ed in 2001, which is only after Central and New Delhi Dis- tricts 3.1. Pattern of Urbanization in Delhi As the national capital Delhi has drawn people from all parts of India. Delhi is mini India with the largest num- ber of immigrant communities who have made it their home. Delhi has witnessed a phenomenal population growth during past few decades. From a population of 0.46 million in 1901, its population has grown to 13.78 million in 2001 [3] (Figure 3). There was sudden in- crease in the population in 1947, as a result of partitions of India and Pakistan. The 1941-51 decade recorded a growth of 90%. Since 1951, the population of Delhi has been increasing at an average rate of about 50% every decade (Table 1). In the 1901 Census, more than 47.34% of Delhi’s population lived in rural areas which showed a gradual decline 17.60% in 1951 to 6.99% in 200 1 (Table 2). A l- though, there has been a slight reversal of the trend, i.e., 10.07% in 1991. Urbanisation h as increased rapidly since 1911 when the capital of India was sifted from Calcutta (presently Kolkata) to Delhi. The pace of urbanisation was accelerated during 1941-51 when the country was divided into India and Pakistan and a large number of migrant settled in Delhi. With rapid urbanisation, the rural area is shrinking; it has reduced from 1157.52 sq km in 1961 to 591.91 sq km in 2001. In 2001 the pop ula- tion density was 14,387 and 1,627 persons/km2 in urban areas and rural areas respectively. Villages of Delhi, which have coexisted with the sprawling urban settle- ments, still retain a great deal of rural tradition. The rapid urbanisation has led to the development of new settlements colonies in Delhi. These settlements are categorised by Delhi Development Authority (DDA) in terms of civic infrastructure, types of houses, authorised vs. unauthorised settlement etc, Jhuggis and Jhoparis (informal) resettlement colonies, Slum resettlement colonies, Refugee resettlement colonies, Approved/ planned colonies, Unauthorised-regularised colonies, Urbanised colonies, Urbanised villages, Notified slum  A. RAHMAN ET AL. Copyright © 2011 SciRes. JGIS 65 Figure 1. Locational aspect of study area. Figure 2. Administrative divisions of east Delhi.  A. RAHMAN ET AL. Copyright © 2011 SciRes. JGIS 66 Figure 3. Population in Delhi 1901-2001. Table 1. District-wise area and population of Delhi during 1991 to 2001. 1991 2001 District Area (km2) % Area to total area of State Population (In lakhs) % to Pop- ulation of State Density (pers./km2) Population (In lakhs) % to Pop ulation of State Density (pers./km2) Decadal growth 1991-2001 North-West 440 29.7 1,778,268 18.88 18,088 2,847,395 20.66 29,395 60.12 South 250 16.9 1,502,878 15.95 26,261 2,258,367 16.38 25,760 50.27 West 129 8.7 1,434,008 15.22 15,986 2,119,641 15.38 22,637 47.81 North-East 60 4.05 1,085,250 11.52 11,116 1,763,712 12.8 16,431 62.52 South-West 420 28.3 1,084,705 11.51 11,471 1,749,492 12.69 12,996 61.29 East 64 4.31 1,023,078 10.86 6,012 1,448,770 10.51 9,033 41.61 North 60 4.05 688,252 7.31 4,042 779,788 5.66 6,471 13.30 Central 25 1.68 656,533 6.97 4,791 644,005 4.67 4,909 -1.91 New Delhi 35 2.36 167,672 1.78 2,583 171,806 1.25 4,165 2.47 Total NCT Delhi 1483 100.00 94,20,644 100.00 6352 137,82,976100.00 9,294 46.31 Source: Census of India 1991 & 2001 Table 2. Urban and rural population in Delhi 1901-2001. Census Years Total Population Total Urban Population % of Urban Population % of Rural Population Annual exponen- tial growth rate Decennial growth percent 1901 4,05,819 2,14,115 52.76 47.34 -- -- 1911 4,13,851 2,37,944 57.50 42.5 1.1 11.13 1921 4,88,452 3,04,420 62.32 37.68 2.5 27.94 1931 6,36,246 4,47,442 70.33 29.67 3.9 46.98 1941 9,17,939 6,95,686 75.79 24.21 4.4 55.48 1951 17,44,072 14,37,134 82.40 17.60 7.3 106.58 1961 26,58,612 23,59,408 88.75 11.25 5.0 64.17 1971 40,65,698 36,47,023 89.68 10.32 4.4 54.57 1981 62,20,406 57,68,200 92.73 7.27 4.6 58.16 1991 94,20,644 84,71,625 89.93 10.07 3.8 46.87 2001 137,82,976 12,81,9761 93.01 6.99 4.1 51.33 Census of India 1901-2001  A. RAHMAN ET AL. Copyright © 2011 SciRes. JGIS 67 areas/Walled City and Rural villages are the various types of settlements which are commonly seen in Delhi. 4. Data and Methodology District map showing the villages, Census towns, Mu- nicipal areas and wards of Delhi has been used for preparation of base map. Guide map and East Delhi map was geo-referenced with the help of 1976 Survey of In- dia (SoI) topograph ical sheet no. 53 H/6 NW and 53 H/6 SW at the scale of 1:25,000 and Guide map of Delhi 1982. The Advanced Space-born Thermal Emission Re- flection Radiometer (ASTER) data acquired on 22nd No v. 2003 has been used in this study. The ASTER satellite image has 15m ground resolution, which has been used for generate land use/land cover map of 2003 and from that map built-up area was extracted. Guide map of Delhi 1982 was digitised, cleaned, topology was built to pre- pare land use/land cover map in Arc GIS 9.0 software Figure 4. The satellite data was enhanced before classification using histogram equalization in ERDAS Imagine 8.7 for the better quality of the image and to achiev e better clas- sification accuracy. Further both satellite data and Guide map which was used as base map were re-projected to a common Universal Traverse Mercator (UTM) projec- tion/coordinate system on 1:50,000 scale. The data were resampled to a common spatial resolution of 15 m. Then supervised classification was performed using maximum likelihood algorithm for ASTER data with 4 bands in VNIR range, i.e., band 1 (0.52-0.60 µm), band 2 (0.63- 0.69 µm), band 3 (0.76-0.86 µm), band 4 near infrared (0.76.90 µm). Two land use land cover map was prepare 1) using Guide map of 1982 2) using ASTER satellite data of 2003. Thereafter from these two maps built-up area, open spaces which also includes open green spaces were extracted for analysis. Digitized administrative boundary was superimposed on the classified land use/ land cover map in order to get ward-wise information of both the years 1982 and 2003. The demographic data (household density, occupancy ratio and population density) have been collected from the office of Register General of India, New Delhi. The data related to the environmental pollution has been col- lected from the Central Pollution Control Board (CPCB), New Delhi. Integration of spatial and non-spatial (attrib- ute data), which are collected from secondary sources i.e. pollution, population, etc. were done in GIS environment using Arc GIS 9.0. To asses the quality of urban envi- ronment 8 parameters 1) % age of built-up area 2) open spaces 3) household density 4) occupancy ratio 5) popu- lation density 6) accessibility to roads 7) noise pollution 8) foul smell were selected, which were assigned weigh- tages according to their relative importance Table 3. All parameters are taken into consideration for 2003 but two parameters housing density and occupation ratio have not used in 1982 due to not availability of data. Weighted Overlay Technique was applied for assessing and evalu- ating the quality of the urban environment. Quantitative weights were given to all parameters according to their relative importance for the assessment of quality of ur- ban environment. On the basis of importance the score for the parame- ters I, II, III, IV, and V are multiplied by 3 before adding with the parameters VI, VII and VIII for the year 2003, while for year 1982 the sum of selected parameter I, II and V were multiplied by 5 instead of 3 before adding to the VI, VII and VIII parameters. This is done for making comparability in the two years in terms of their values assigned, because in 1982 the parameters III & IV, i.e., housing density and occupancy ratio have not been used due to non availability o f data. The weighted layers were clubbed by using the composite score and based on it the final layer of quality of environment map for East Delhi was prepared. To assess the change in environment qual- ity the composite scores of 2003 has been subtracted from the composite scores of 1982. Finally the resulting composite scores have been categorized into 7 different classes. 5. Result and Discussions 5.1. Built up Area Built up area is directly related to the housing density, higher the housing density the lower the environmental quality [5]. As a result of built-up densities, hazards such as noise and air pollution are likely to increase, since many of these problems are caused by transportation. Higher urban densities are also liable to damage open spaces within the cities, as well as the quality of life in over-crowded residential neighbourhoods [16]. The East Delhi district was sparsely built 10 years before but now many new multi-storeyed residential colonies have come up. In 1982, the built-up area varies from 40% to 60% in north-eastern part and negligible in other parts. The ward no. 78 Jagatpuri ranked first in terms of percentage of built up area 80.16%. Lowest built up area is in Gharoli village, which is a town in 2001 Census, with 2.8%. In 2003, the built-up areas have been increased and Jagat- puri ranked first with 94% in 1982 it was 80.16%. The village Chilla Saroda Khadar has least built up area of only 8.65% which is in first category. There were 11 villages, Census towns wh ich had bu ilt-up area of < 20% in 1982 but in 2003 only one left in < 20% category other have gone to more built-up category. Surprisingly the  A. RAHMAN ET AL. Copyright © 2011 SciRes. JGIS 68 Table 3. Parameters of urban environme ntal quality. S No. Parameters Class/Category Weightages Data source Below 20 % 5 20% - 40% 4 40% - 60% 3 60% - 80% 2 I Built up area Above 80% 1 Extracted from guide map, 1982 and ASTER image, 2 003 Below 10 % 1 10% - 30% 2 30% - 50% 3 50% - 70% 4 II Open spaces Above 70% 5 It is clipped from guide map, 1982 and ASTER image, 2 003 Below 50 5 50 - 100 4 100 - 150 3 150 - 200 2 III Household density Above 200 1 It is collected from Primary Census Abstract (PCA), 2003 Below 4.5 p/h 4 4.5 - 5.0 p/h 3 5.0 - 5.5 p/h 2 IV Occupancy ratio Above 5.5 p/h 1 It is collected from PCA, 2003 Below 300 p/km2 5 300 - 500 p/km 2 4 500 - 700 p/km 2 3 700 - 1000 p/km2 2 Population density Above 1000 1 It is assessed by projected population for 1982 & 2003 and the built-up area. V Buffer zones Zone I(A) Zone II(B) 250 m 500 m No accessibility 4 1 1% - 25% 8 2 25% - 50% 12 3 50% - 75% 16 4 75% - 99% 20 5 VI % age of population accessible to roads 100% 24 6 The major roads are mapped and their buffer has been created at the distance of 250 m and 500 m in Arc GIS, which was overlaid on the built-up layer to get ace- ssible areas. 40 m 180 m Not affected 10 5 1% - 5% 8 4 5% - 15% 6 3 15% - 30% 4 2 VII % age of population affected from noise Above 30% 2 1 The buffer of 40 m and 180 m (noise exposure zone) has been created for the two tracks of Eastern Railway and over- laid on built-up layer. 250 m 500 m Not affected 10 5 1% - 15% 8 4 15% - 30% 6 3 30% - 45% 4 2 VIII % age of population affected from foul smell Above 45% 2 1 The open chocked drains have been digitised in GIS and the smell affected areas has been determined by making buffer zone of 250 m and 500 m.  A. RAHMAN ET AL. Copyright © 2011 SciRes. JGIS 69 Figure 4. Flow chart of methodology for land use/land cover classification. Patparganj, a higher-medium income colony, which also had built-up area of < 20% have moved to 60-80% cate- gory in 2003 (Table 4 & Figure 5). This shows that in most of the wards and villages land use have been changed by man. That is why the built up areas have increased in most of the areas. 5.2. Open Spaces The open space is another important aspect for the as- sessment of environmental quality which pro vides pollu- tion free environment for the people living nearby. Vegetated and open green spaces (parks) have been taken as one of the most important parameter of quality of urban environment assessment. More open and green spaces in the city better is the quality of environment. It is very essential to have open green in the surro unding of living area for healthy life. It is commonly seen that in recent years apart from few planned residential colonies other building are coming up at a very fast rate without leaving any open space or parks. In 1982 almost 2/3rd of the total study area had > 70% open spaces but situation has change the other way round and after 20 years in 2003 about 90% of the area was in the 10-50% open spaces (Table 5 & Figure 6). The ward Jagatpuri r anked last in terms of percentage of open spaces to the total area, with 17.64%. The village Gharoli, which becomes as Census town in 2001 has highest 95.23% open spaces, followed by Dallopura and Chilla Saroda Khadar. In 2003, village Chilla Saroda Khadar ranked first in terms of largest area under open spaces with 81.42% and the second is Shamas Pur, which has 72.19% open spaces. The DMC wards have less open spaces, i.e., Shaikarpur, and Jagatpuri have 2.66% and 3.7% open spaces respec- tively. The major changes have been observed in the all Census towns that the open spaces decreased rapidly in the past years due to expansion of residential areas. The Census town Gharoli, situated at the south-eastern boun- dary of East Delhi has largest area under open spaces with 58% among all Census towns, wh ile Patparganj has least open spaces with 28%. So the DMC wards are most ly v er y mu ch co ng est ed, especially the northern part of the study area. 5.3. Housing Density Housing density (number of houses/Km²) shows the pressure of households on existing utilities and services  A. RAHMAN ET AL. Copyright © 2011 SciRes. JGIS 70 Figure 5. Change in built up area in east Delhi, 1982–2003. Table 4. Built up areas in different wards, CTs & villages in 1982 & 2003. Wards, Census Towns and Villages 1982 2003 Built up (%) weights Chilla S. Khadar(Vill), Gharoli(Vill), Dallo Pura(Vill), Kondli(Vill), Chilla S Bangar(Vill), Patparganj(Vill), Shamas Pur(Vill), 69-Mayur Vihar, 68-Dallopura, 79-Preet Vihar, 74-Laxmi Nagar, Shakar Pur(Vill) Chilla S. Khadar(Vill) < 20 % 5 72-Mandawl, 80-Vishwas Nagar, 82-Vivek Vihar, 73-Geeta Colony, 70-Kondali Shamas Pur(Vill), Shakar Pur(Vill), 74-Laxmi Nagar, Gharoli(CT) 20% - 40% 4 87-Rohtas Nagar, 75-Gandhi Nagar, 71-Shaikarpur, 76 -Raghubarpura, 77-Krishna Na gar, 81-Shahdara 73-Geeta Colony, Kondli(CT), Chilla S Ban- gar(CT), 75-Gandhi Nagar, 87-Rohtas Nagar, 79-Preet Vihar, Dallo Pura(CT), 69-Mayur Vihar, 72-Mandawli, 80-Vishwas Nagar 40% - 60% 3 None 82-Vivek Vihar, Patparganj(CT), 68-Dallopura, 81-Shahdara, 77-Krishna Nagar, 70-Kondali, 76-Raghubarpura 60% - 80% 2 78-Jagatpuri 71-Shaikarpur, 78-Jagatpuri > 80% 1 Note: Vill - Villages, CT - Census towns i.e., drinking water and sanitation etc. which is needed by the people. Higher the housing density, poorer the qual- ity of urban environment [5]. In 2003, the Delhi Munici- pal Corporation (DMC) Raghubarpura ward had highest housing density with 32,700 houses/km². The highest housing density among Census towns is in Gharoli with 20,000 houses/km2. The lowest housing density is in Samaspur village. The village Chilla Saroda Khadar has high housing density among all villages with 108 houses/ km2. It can be easily observed that a large area in the middle of the district, i.e., Mandawli, Preet Vihar, Shai- karpur and villages Shakar Pur Barmad and Shamaspur has less than 5,000 houses/km2 housing density (Table 6 & Figure 7). While in northward and southward  A. RAHMAN ET AL. Copyright © 2011 SciRes. JGIS 71 Figure 6. Percentage open spaces in east delhi, 1982 & 2003. Table 5. Open spaces in different wards, CTs and villages in 1982 & 2003. Wards, Census Towns and Villages 1982 2003 Open Spaces weight None 71-Shaikarpur, 78-Jagatpuri Below 10% 1 78-Jagatpuri, 81-Shahdara 76-Raghubarpura, 70-Kondali, 77-Krishna Nagar, 81-Shahdara, 68-Dallopura, 82-Vivek Vihar, Pat- parganj(CT), 69-Mayur Vihar 10% - 30% 2 76-Raghubarpura, 77-Krishna N agar, 75-Gandhi Nagar, 87-Rohtas Nagar, 71-Shaikarpur 72-Mandawli, 75-Gandhi Nagar, 87-Rohtas Nagar, Dallo Pura(CT), 80-Vishwas Nagar, 79-Preet Vi- har, Chilla S. Bangar(CT), 73-Geeta Colony (42.76), Ko n dli(CT) 30% - 50% 3 73-Geeta Colony, 74-Laxmi Nagar, 70-Kondali, 82-Vivek Vihar, Shakar Pur Baramad(Vill) 74-Laxmi N agar, Gharoli(CT), Shakar Pur Baramad(Vill) 50% - 70% 4 80-Vishwas Nagar, 72-Mandawli, 79-Preet Vihar, 69-Mayur Vihar, Shamas Pur(Vill), 68-Dallopura,Patparganj(Vill), Chilla S. Ban- gar(Vill), Kondli(Vill), Chilla S. Khadar(Vill), Dallo Pura(Vill), Gharoli(Vill) Shamas Pur(Vill), Chilla S. Khadar(Vill) Above 70% 5 direction the housing density is very high, especially in the north eastern part is the old part of the East of Delhi. The southern areas are recently developed, but due to easily availability of land at ch eap rates in NOIDA. 5.4. Occupancy Ratio Number of persons/household which is also referred as occupancy ratio gives the picture of pressure of popula-  A. RAHMAN ET AL. Copyright © 2011 SciRes. JGIS 72 Figure 7. Household density of east delhi, 2003. Table 6. Housing density in different wards, census towns & villages. Wards, Census Towns and Villages Housing Density (Household/km2)weights Shamas Pur(Vill), Shakar Pur Baramad(Vill), 71-Shaikarpur, 72-Mandawli, 79-Preet Vihar, 68-Dallopura Below 5,000 5 Patparganj(CT), 69-Mayur Vihar, 80-Vishwas Nagar, Kondli(CT), 82-Vivek Vi har, 70-Kondali, 73-Geeta Colony 5,000 - 1,0000 4 Chilla Saroda Khadar(Vill), 87-Rohtas Nagar, 74-Laxmi Nagar 10,000 - 15,000 3 77-Krishna Nagar, Chilla Saroda Bangar(CT), 81-Shahdara, Dallo Pura(CT), Gharoli(CT) 15,000 - 20,000 2 78-Jagatpuri, 75-Gandhi Nagar, 76-Raghubarpura Above 20,000 1 tion on individual house. Lesser the occupancy ratio bet- ter will be the quality of environment. The data for 1982 was not available in the Government office so occupancy ration was analysed for 2003 only. In 2003 the all vil- lages of the study area has low occupancy rate, while the DMC wards in the northern part has highest occupancy ratio, among them Raghubarpura, Gandhi Nagar, Rohtas Nagar and Shahdara has above 5 persons/household. Among Census towns Kondali has lowest and Dallupura has highest occupancy ratio (Table 7 & Figure 8). This is because these areas are mainly inhabited by lower- medium income people who have large family size. 5.5. Population Density The population grows very fast in urban areas due to migration of people mainly from rural areas and also from nearby smaller cities and towns, which in turn leads to pressure on all existing resources of bigger and metro cities like Delhi. So the population dens ity has been con- sidered inversely related parameters to the quality of urban environmen t. In 1982, entire north- eastern p art had low population den sity and out of 25 villages 20 villages had population density of 1000 person/km² or even less Table 8. The Raghubarpura ward ranked first in terms of high popul at i on density wit h 1,524 person/ k m². In 2003, the analysis of population density indicates that the DMC wards, which are situated along the Grand Trunk road, have very high population density except some areas. The northern and southern part of the study area is more populated than the middle part. DMC wards, Raghubarpura, Gandhi Nagar, Jagatpuri, Sahadara in  A. RAHMAN ET AL. Copyright © 2011 SciRes. JGIS 73 Figure 8. Occupancy ratio of east delhi, 2003. Table 7. Occupancy ration in different war ds census towns 7 villages. Wards, Census Towns and Villages Occupancy Ratio (persons/household) Weight Chilla S. Khadar(Vill), Shakar Pur Baramad(Vill), Shamas Pur(Vill) Below 4 4 Kondli(CT), Chilla S. Bangar(CT), Patparganj(CT), Gharoli(CT), 69-Mayur Vihar, 72-Mandawli, 79-Preet Vihar 4 - 5 3 82-Vivek Vihar, 74-Laxmi Nagar, 68-Dallopura, 71-Shaikarpur, Dallo Pura(CT), 78-Jagatpuri, 73-Geeta Colony, 80-Vishwas Nagar, 77-Krishna Nagar, 70-Kondali 5 - 5 2 81-Shahdara, 87 -Rohtas Nagar, 75- G andhi Nagar, 7 6-Raghubarpura Above 5 1 North and a Census town Dallopura have population density > 1,000 person/km² (Table 8 & Figure 9). The northern part which was developed earlier is experienc- ing very high population pressure due to heavy influx of migrants from Bihar and Bengal, while the southern part which is recently developed due to migration from ad- joining state, like Uttar Pradesh, Haryana and Rajasthan. 5.6. Accessibility to Roads Transportation affects urban quality of life because of the type of accessibility it allows. Therefore, distance of residential colonies from major roads is an important aspect with respect to availing the utility and service fa- cilities. In this regard two buffer zones at the distance of 250 m and 500 m were created along the major roads Figure 10. The total road length available in Delhi is just 0.28 km/000 populations. The number of vehicles in Delhi is rapidly increasing and is expected to reach 3.87 million by the year 2015 [17]. This leads to traffic conges- tion and reduced traffic speeds, often as l ow as 10 km/ hrs. In 1982, the entire north-eastern part has very good road network and almost 75% area were having major roads at a distance of less than 250 m and rest area are served by major road at the distance of 250 m to 500 m. Excluding the north-eastern part of the East district all area have poor road network. The southern most part does not have any major roads at the distance of 500 m but it is served by the other minor roads. About 98% population of Gharoli Census town in the south eastern part does not have access to any major roads at a distance of 500 m. 5.7. Noise Affected Area Noise pollution is one of the most prominent and influ-  A. RAHMAN ET AL. Copyright © 2011 SciRes. JGIS 74 77°16' 77°16' 77°18' 77°20' 77°20'77°18' 77°16' 77°16' 77°18' 77°20' 77°20'77°18' 28°36'28°38 '28°40' 28°36'28°38'28°40' N 1012Kilometers EAST DELHI 19822003 Y A M U N A R I V E R Y A M U N A R I V E R PO PU LAT ION D E NSIT Y Railway track River State Boundary Dis tri ct Boun dary Village, CT & War ds Boundary 300 - 500 500 - 700 700 - 1000 Above 1000 Below 300 Population density (in person/hectare) Figure 9. Population density in east delhi, 1982 & 2003. Table 8. Population density in different wards, CTs & villages in 1982 & 2003. Wards, Census Towns and Villages 1982 2003 Pop. Density (person/km²) weights Chilla S. Khadar (Vill), Shakar Pur(Vill ), Shamas Pur(Vill), Patparganj(Vill), Ch illa S. Bangar(Vill), 71-Shaikarp ur, Dallo Pura(Vill), 72-Mandawli, Kondli(Vill) Shamas Pur(Vill), Shakar Pur(Vill), 71-Shaikarpur, 72-Mandawli, 79-Preet Vihar, 68-Dallopura, Patpar- ganj(CT), 6 9-Mayur Vihar Below 300 5 Gharoli(Vill), 73-Geeta Colony, 79-Preet Vihar, 87-R ohtas Nagar Kondli(CT), 80-Vishwas Nagar, 82-Vivek Vihar, Chilla S. Khadar(Vill), 70-Kondali, 73-Geeta Colony 300 - 500 4 82-Vivek Vi har, 7 0-Kondali , 74-La xmi Nagar, 80-Vi shwas Nagar, 68-Dall opura, 77-Krishn a Nagar 87-Rohtas Nagar, 74- Laxmi Nagar 500 - 700 3 78-Jagatpuri, 81-Shahdara, 75-Gandhi Nagar, 69-Mayur Vihar Chilla S. Bangar(CT), 77-Krishna Nagar, Gharoli(CT) 700 - 1000 2 76-Raghubarpura Dallo Pura(CT), 81-Shahdara, 78-Jagatpuri, 75-Gandhi Nagar, 76-Ra ghubarpura Above 1000 1 ential factors affecting the quality of life of city residents and urban environmental quality [18]. Unwanted sound or noise damages human hearing and creates other re- lated problems. Railway is considered to be one of the chief noise polluting agents. Two buffer zones at the distance of 40 m and 180 m has been created and coded with VII A and VII B respectively based on US System of Noise Exposure Forecast. Two railway tracks crosses the study area from east to west direction, one at the north while other in middle part. The first railway track affects more people while second one affects fewer, be- cause northern part is more populated then central area Figure 11. 5.8. Smell Affected Area Urban areas, especially in developing countries like India waste water is drained out from various sources like  A. RAHMAN ET AL. Copyright © 2011 SciRes. JGIS 75 Figure 10. Major roads and accessible areas, 1982 & 2003. 77°16' 77°16' 77°18'77°20' 77°20'77°18' 77°16' 77°16' 77°18' 77°20' 77°20'77°18' 28°36'28°38 '28°40' 28°36'28°38'28°40' N 1012Kilometers Railway track River State Boundary D is tri ct Boun dary Village, CT & War ds Boundary Not affected Noise affected areas 40 m Buffer 180 m Buffer EA ST DELHI NOISE AFFECTED AREAS 19822003 Y A M U N A R I V E R Y A M U N A R I V E R Figure 11. Noise affected areas, 1982 & 2003. houses, commercial places and industrial areas etc. by narrow open drains to main drainage system which is also open. Garbage is normally dumped in residential colonies wherever open space is available in the absence of garbage bins. To assess the population affected by foul smell from open drains and waste disposal sites again two buffer zones at the distance of 250 m and 500 m has been created and has been coded as VIII A and VIII B respectively. Gahzipur drain and Shahdara drain are the two main drains in the study area both are open, while Hindon cut is the third which is very much polluted. Hindon cut  A. RAHMAN ET AL. Copyright © 2011 SciRes. JGIS 76 flows from east to west direction and meet the river Ya- muna, the two small drains flows from north to south meets Gahzipur drain, which flows along the H indon cut. Shahdara drain start from middle of the study area and flows in south direction and meet at Gahzipur drain. In order to assess the population affected by foul smell due to open drainage and garbage buffer maps along drains and around garbage collection points was created to know the extent of smell. These two maps were then overlaid on the population density maps to get the idea that how many people are being affected with the foul smell due to open drainage. The study shows that in 1982 about 86,718 persons were affected by foul smell who were living in 250 m buffer distance to the drain, while 1, 14,543 people are under 500 m foul smell buffer zone. Village Kondali is highly affected by smell i.e. 62.5% population affected by the smell in 250 m buffer while rest population af- fected by 500 m smell zone. In 2003 a garbage dumping site comes up at Gajipur in the south eastern part. And about 15, 00,798 persons are affected by the foul smell and out of that 5, 15,860 persons were affected by severe foul smell who lived in 250 m buffer distance from the drain (Figure 12). While 9, 84,938 persons comes under 500 m smell zone. DMC ward Krishna Nagar is highly affected by foul smell, about 52% population are affected by the smell in 250 m buffer while 25% population are affected by 500 m smell zone. 6. Comparative Analysis of Quality of Urban Environment (1982-2003) Human beings impose changes on natural ecosystems and increasing control of environment often creates con- flicts between his goals and natural process. Urban con- centrations intensity, the shortage of housing, transport capacity and other urban amenities affects in day-to-day life of common people. The deficiencies magnify crowd- ing, noise, air pollutants and street filth. These factors are detrimental to health and well being of the people. Qualitative weights were assigned to 8 selected envi- ronment parameters and then composite weights were calculated for both 1982 and 2003 that shows the quality of urban environment (Tables 9 and 10). These values are classified in seven different classes of urban envi- ronment condition, i.e., excellent, very good, fair, desir- able, acceptable minimum, poor, bad alarming and then maps were prepared for both the years 1982 & 2003 (Figure 13). Higher the weights better the urban envi- ronmental quality and vice-versa. Most of the area (89%) were having good environment conditions in 19 82 only ward no. 78 Jagatpuri was under bad alarming cond ition because it h ad high built up land s with least open spaces. The northern areas are served by National Highway (NH-2) so, along this highway linear urban sprawl has been observed at a fast rate. The north- astern area is near to the city centre so the unauthorized colonies have come up which degrade the urban envi- ronment. About 89% area has good environmental con- dition, which are mainly urban villages, amo ng some are uninhabited and having most of the area open or covered with food crops. DMC wards namely 72-Mandawali, 73- Geeta Colony, 74-Laxmi Nagar, 79-Preet Vihar have fair environment condition. Geeta colony and Laxmi Nagar have high densely built up area but served by the major roads and are not affected by noise or foul smell, that’s a fair environmental condition, is seen. In 2003, little over two decades, the result of urban environment conditions indicate th at comparatively most area 75% have good environment conditions while 22% is in poor condition and rest 3.5% is in bad alarming condition in East Delhi. Th is is mainly due to unplann ed expansion on open vacant green areas excellent envi- ronment condition has been replaced by the poorer envi- ronmental conditions. In 1982 two villages are in excel- lent condition (Table 11). Out of eight village in 1981 five are becomes as Census town of Preet Vihar tehsil. The three villages situated along the river Yamuna has not been sprawled so the two villages Shakar Pur Bar- mad and Samas Pur are in very good condition and rest (Chilla saroda Khadar) is in fair condition. Among five Census towns Dallopura is in poor condition, while oth- ers are in desirable environment cond ition. These Census towns were in very good condition in 1982 thus the en- vironment condition has been degraded in these areas very much due to outward expansion of Delhi When we talk about the environment condition in DMC wards, ward no 78 Jagatpuri which was in bad alarming condi- tion in 1982 is same in 2003 followed by 76 Raghubar- pura. Ward no 68 Dallo Pura ranked first in terms of good environmental condition followed by 69 Mayur Vihar, 74 Laxmi Nagar, 73 Geeta Colony, Shaikarpur, 79 Preet Vihar have fair environmental condition. 7. Change in Quality of Urban Environment (1982-2003) Change is the Law of Nature but an urban environment condition is being chang ed rapidly due to interference of Man. The entire East Delhi has been changed signifi- cantly, mostly in negative direction (Table 12). The analysis shows that the area under poor environment condition has been increased, while bad alarming condi- tions have slightly increased in 2003 from 1982 (Figure 14). Most of the East district was in a better state of en- vironment in 1982 , but in 2003 thing s hav e been ch ang ed  A. RAHMAN ET AL. Copyright © 2011 SciRes. JGIS 77 Figure 12. Foul smell affected areas, 1982 & 2003. Figure 13. Quality of urban environment in east Delhi in 1982 & 2003. and now 50% area is in very good, fair and desirable condition. The study clearly shows that comparatively many ar- eas in the East District of Delhi Metropolitan Region (DMR) have good environment condition. But in com- parison to the year 1982, the quality of environment has been degraded in many areas in 2003. Major chan ges are observed in the southern part especially in all Census towns. The Census towns namely Dallupura and Patpar- ganj are in very poor condition in the term environment degradation, while Kondali has minimum acceptable degradation in and rest areas show poor condition. The village Shakar Pur Barmad ranked first in terms of im- provement in environment condition, which was ranked 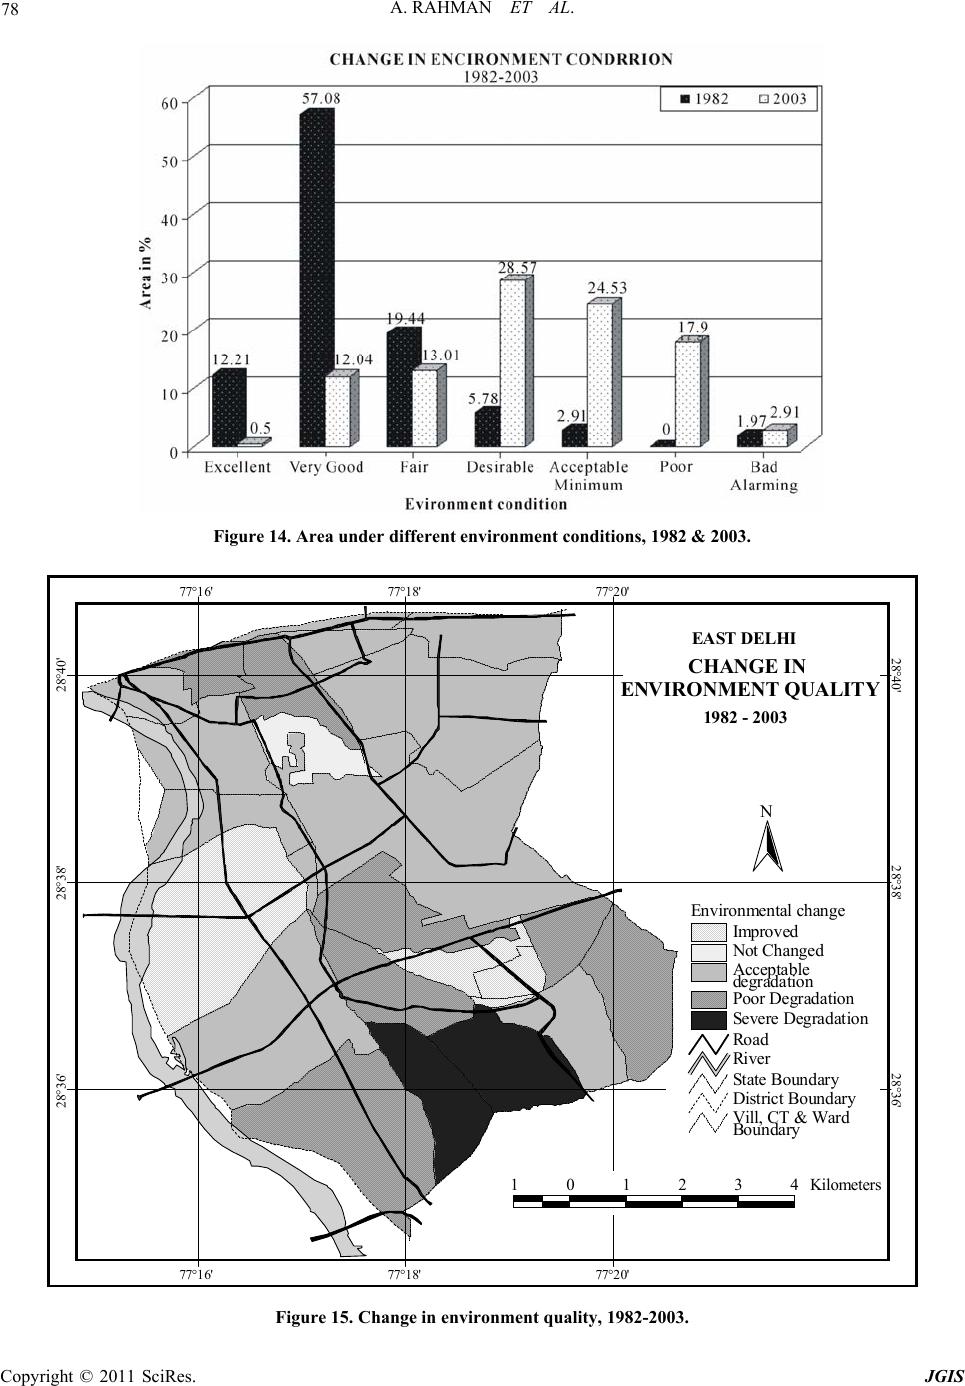 A. RAHMAN ET AL. Copyright © 2011 SciRes. JGIS 78 Figure 14. Area under different environment conditions, 1982 & 2003. N Imp roved Not Changed Acceptable degradation Poor Degradation Severe Degradation Environmental change 28°36' 28°36' 28°38' 28°38' 28°40' 28°40' 77°16' 77°16' 77°18' 77°18' 77°20' 77°20' CHANGE IN ENVIRONMENT QUALITY EAST DELHI 1982 - 2003 Riv er Road State Boundary District Boundary Vill, CT & Ward Boundary 101234Kilometers Figure 15. Change in environment quality, 1982-2003. 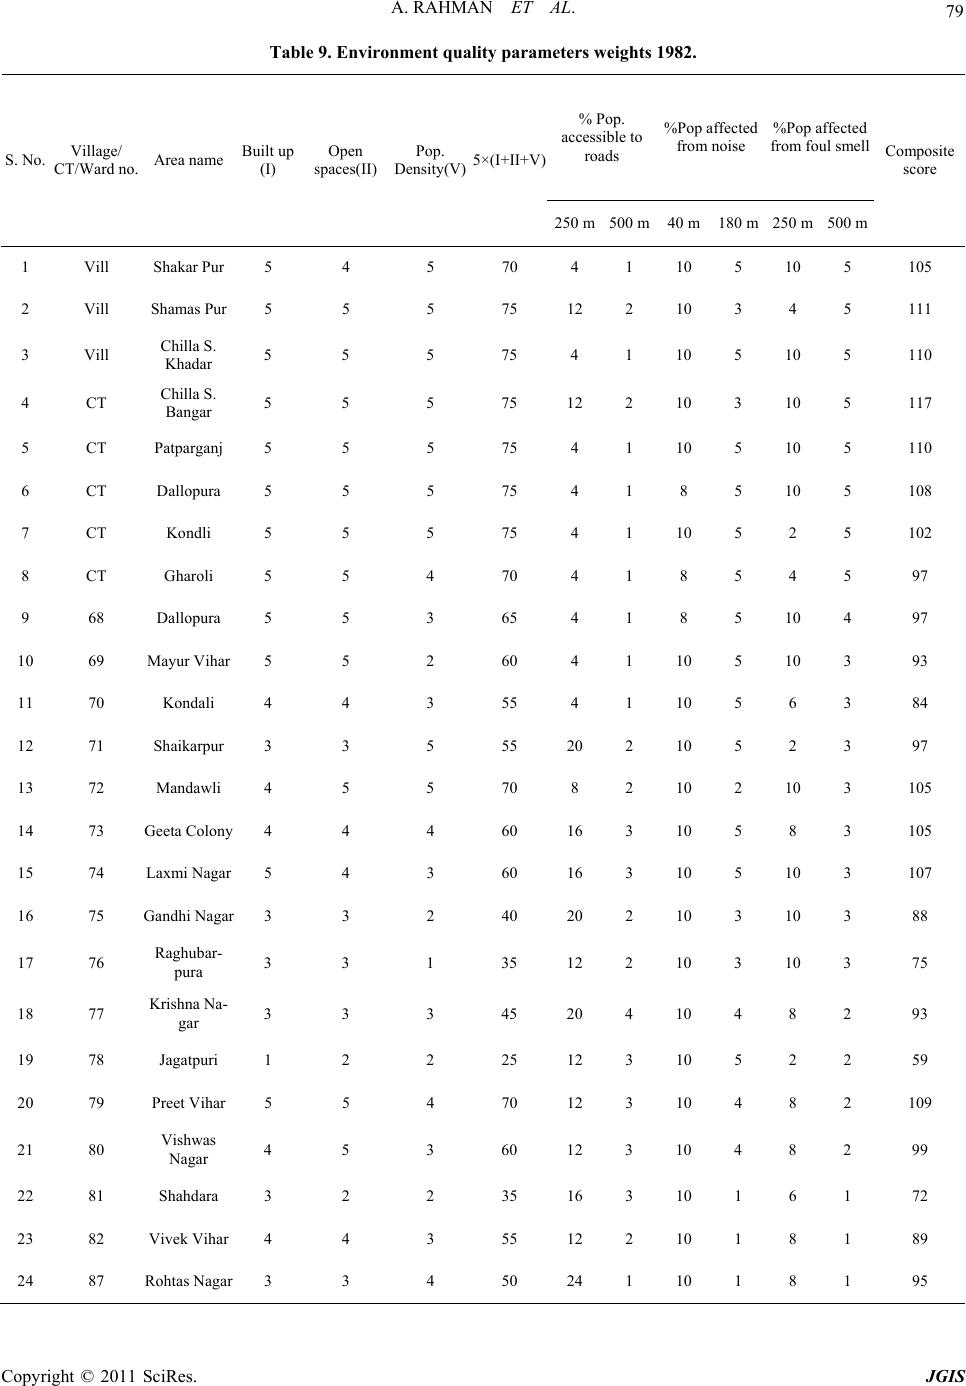 A. RAHMAN ET AL. Copyright © 2011 SciRes. JGIS 79 Table 9. Environment quality parameters weights 1982. % Pop. accessible to roads %Pop affected from noise %Pop affected from foul smell S. No. Village/ CT/Ward no. Area name Built up (I) Open spaces(II) Pop. Density(V) 5×(I+II+V) 250 m500 m40 m180 m 250 m 500 m Composite score 1 Vill Shakar Pur 5 4 5 70 4 1 10 5 10 5 105 2 Vill Shamas Pur 5 5 5 75 12 2 10 3 4 5 111 3 Vill Chilla S. Khadar 5 5 5 75 4 1 10 5 10 5 110 4 CT Chilla S. Bangar 5 5 5 75 12 2 10 3 10 5 117 5 CT Patparganj 5 5 5 75 4 1 10 5 10 5 110 6 CT Dallopura 5 5 5 75 4 1 8 5 10 5 108 7 CT Kondli 5 5 5 75 4 1 10 5 2 5 102 8 CT Gharoli 5 5 4 70 4 1 8 5 4 5 97 9 68 Dallopura 5 5 3 65 4 1 8 5 10 4 97 10 69 Mayur Vihar 5 5 2 60 4 1 10 5 10 3 93 11 70 Kondali 4 4 3 55 4 1 10 5 6 3 84 12 71 Shaikarpur 3 3 5 55 20 2 10 5 2 3 97 13 72 Mandawli 4 5 5 70 8 2 10 2 10 3 105 14 73 Geeta Colony 4 4 4 60 16 3 10 5 8 3 105 15 74 Laxmi Nagar 5 4 3 60 16 3 10 5 10 3 107 16 75 Gandhi Nagar 3 3 2 40 20 2 10 3 10 3 88 17 76 Raghubar- pura 3 3 1 35 12 2 10 3 10 3 75 18 77 Krishna Na- gar 3 3 3 45 20 4 10 4 8 2 93 19 78 Jagatpuri 1 2 2 25 12 3 10 5 2 2 59 20 79 Preet Vihar 5 5 4 70 12 3 10 4 8 2 109 21 80 Vishwas Nagar 4 5 3 60 12 3 10 4 8 2 99 22 81 Shahdara 3 2 2 35 16 3 10 1 6 1 72 23 82 Vivek Vihar 4 4 3 55 12 2 10 1 8 1 89 24 87 Rohtas Nagar 3 3 4 50 24 1 10 1 8 1 95 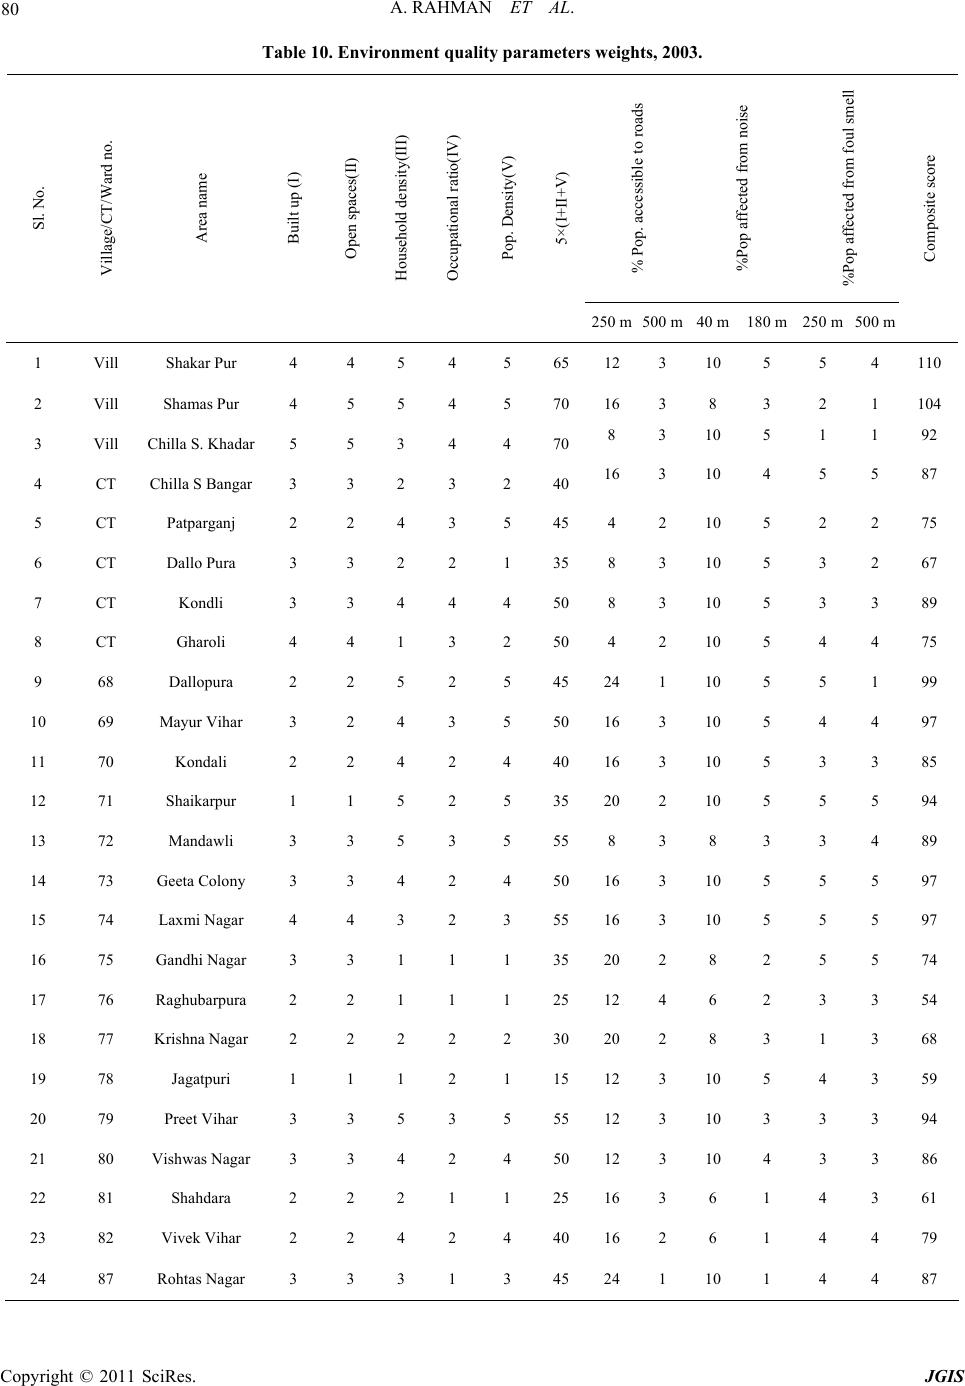 A. RAHMAN ET AL. Copyright © 2011 SciRes. JGIS 80 Table 10. Environment quality parameters weights, 2003. % Pop. accessible to roads %Pop affected from noise %Pop affected from foul smell Sl. No. Village/CT/Ward no. Area name Built up (I) Open spaces(II) Household density(III) Occupational ratio(IV) Pop. Density(V) 5×(I+II+V) 250 m 500 m40 m 180 m 250 m 500 m Composite score 1 Vill Shakar Pur 4 4 5 4 5 65 12 3 10 5 5 4 110 2 Vill Shamas Pur 4 5 5 4 5 70 16 3 8 3 2 1 104 3 Vill Chilla S. Khadar5 5 3 4 4 70 8 3 10 5 1 1 92 4 CT Chilla S Bangar3 3 2 3 2 40 16 3 10 4 5 5 87 5 CT Patparganj 2 2 4 3 5 45 4 2 10 5 2 2 75 6 CT Dallo Pura 3 3 2 2 1 35 8 3 10 5 3 2 67 7 CT Kondli 3 3 4 4 4 50 8 3 10 5 3 3 89 8 CT Gharoli 4 4 1 3 2 50 4 2 10 5 4 4 75 9 68 Dallopura 2 2 5 2 5 45 24 1 10 5 5 1 99 10 69 Mayur Vihar 3 2 4 3 5 50 16 3 10 5 4 4 97 11 70 Kondali 2 2 4 2 4 40 16 3 10 5 3 3 85 12 71 Shaikarpur 1 1 5 2 5 35 20 2 10 5 5 5 94 13 72 Mandawli 3 3 5 3 5 55 8 3 8 3 3 4 89 14 73 Geeta Colony3 3 4 2 4 50 16 3 10 5 5 5 97 15 74 Laxmi Nagar 4 4 3 2 3 55 16 3 10 5 5 5 97 16 75 Gandhi Nagar3 3 1 1 1 35 20 2 8 2 5 5 74 17 76 Raghubarpura2 2 1 1 1 25 12 4 6 2 3 3 54 18 77 Krishna Nagar2 2 2 2 2 30 20 2 8 3 1 3 68 19 78 Jagatpuri 1 1 1 2 1 15 12 3 10 5 4 3 59 20 79 Preet Vihar 3 3 5 3 5 55 12 3 10 3 3 3 94 21 80 Vishwas Nagar3 3 4 2 4 50 12 3 10 4 3 3 86 22 81 Shahdara 2 2 2 1 1 25 16 3 6 1 4 3 61 23 82 Vivek Vihar 2 2 4 2 4 40 16 2 6 1 4 4 79 24 87 Rohtas Nagar3 3 3 1 3 45 24 1 10 1 4 4 87 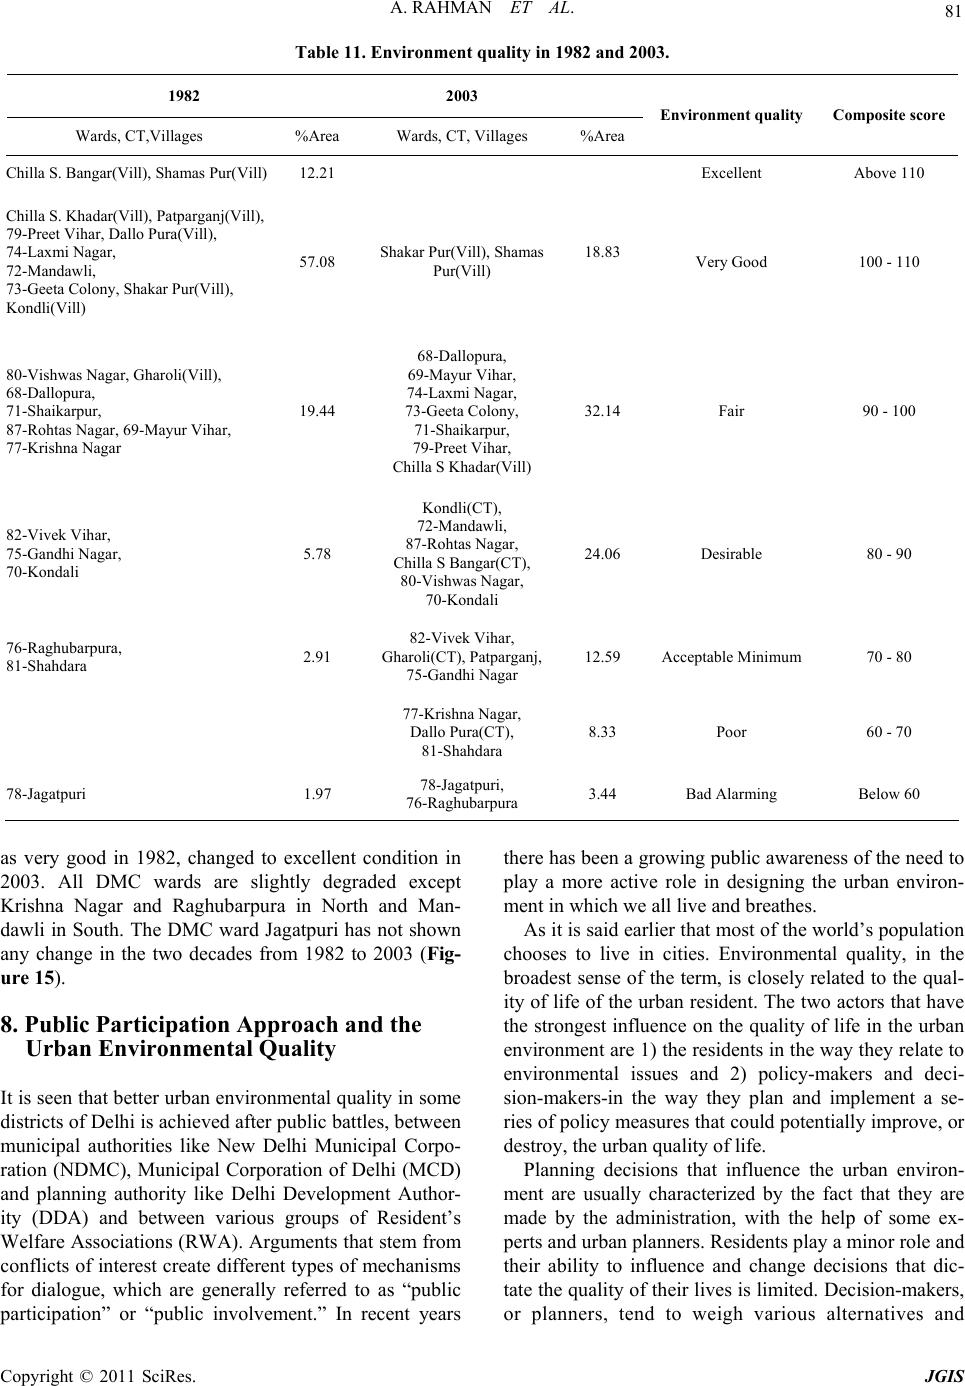 A. RAHMAN ET AL. Copyright © 2011 SciRes. JGIS 81 Table 11. Environment quality in 1982 and 2003. 1982 2003 Wards, CT,Villages %Area Wards, CT, Villages %Area Environment quality Composite score Chilla S. Bangar(Vill), Shamas Pur(Vill) 12.21 Excellent Above 110 Chilla S. Khadar(Vill), Patparganj(Vill), 79-Preet Vihar, Dallo Pura(Vill), 74-Laxmi Nag ar, 72-Mandawli, 73-Geeta Colony, Shakar Pur(Vill), Kondli(Vill) 57.08 Shaka r Pur(Vill), Shamas Pur(Vill) 18.83 Very Good 100 - 110 80-Vishwas Nagar, Gharoli(Vill), 68-Dallopura, 71-Shaikarpur, 87-Rohtas Nagar, 69-Mayur Vihar, 77-Krishna Nagar 19.44 68-Dallopura, 69-Mayur Vihar, 74-Laxmi Nag ar, 73-Geeta Colony, 71-Shaikarpur, 79-Preet Vihar, Chilla S Khadar(Vill) 32.14 Fair 90 - 100 82-Vivek Vihar, 75-Gandhi Nagar, 70-Kondali 5.78 Kondli(CT), 72-Mandawli, 87-Rohtas Nagar, Chilla S Bangar(CT), 80-Vishwas Nagar, 70-Kondali 24.06 Desirable 80 - 90 76-Raghubarpura, 81-Shahdara 2.91 82-Vivek Vihar, Gharoli(CT), Patparganj, 75-Gandhi Nagar 12.59 Acceptable Minimum 70 - 80 77-Krishna Nagar, Dallo Pura(CT), 81-Shahdara 8.33 Poor 6 0 - 70 78-Jagatpuri 1.97 78-Jagatpuri, 76-Raghubarpura 3.44 Bad Alarming Below 60 as very good in 1982, changed to excellent condition in 2003. All DMC wards are slightly degraded except Krishna Nagar and Raghubarpura in North and Man- dawli in South. The DMC ward Jagatpuri has not shown any change in the two decades from 1982 to 2003 (Fig- ure 15). 8. Public Participation Approach and the Urban Environmental Quality It is seen that better urban environmental quality in some districts of Delhi is achieved after public battles, between municipal authorities like New Delhi Municipal Corpo- ration (NDMC), Municipal Corporation of Delhi (MCD) and planning authority like Delhi Development Author- ity (DDA) and between various groups of Resident’s Welfare Associations (RWA). Arguments that stem from conflicts of interest create different types of mechanisms for dialogue, which are generally referred to as “public participation” or “public involvement.” In recent years there has been a growing public awareness of the need to play a more active role in designing the urban environ- ment in which we all live and breathes. As it is said earlier that most of the world’s population chooses to live in cities. Environmental quality, in the broadest sense of the term, is closely related to the qual- ity of life of the urban resident. The two actors that have the strongest influence on the quality of life in the urban environment are 1) the residents in the way they relate to environmental issues and 2) policy-makers and deci- sion-makers-in the way they plan and implement a se- ries of policy measures that could potentially improve, or destroy, the urban quality of life. Planning decisions that influence the urban environ- ment are usually characterized by the fact that they are made by the administration, with the help of some ex- perts and urban planners. Residents play a minor role and their ability to influence and change decisions that dic- tate the quality of th eir lives is limited. Decision-makers, or planners, tend to weigh various alternatives and  A. RAHMAN ET AL. Copyright © 2011 SciRes. JGIS 82 Table 12. Change in urban environment (1982–2003). Villages, CTs & DMC wards Environment Quality In 1982 Environment Quality In 2003 Change in 1982–2003 Shakar Pur Bar amad Very Good Excellent Improved Shamas Pur Excellent Very Good Acceptable degradation Chilla Saroda Khadar Excellent Fair Poor Degradation Chilla Saroda Bangar Excellent Desirable Poor Degradation Patparganj Excellent Acceptable Minimum Severe Degradation Dallopura Very Good Poor Severe Degradation Kondli Very Good Desirable Acceptable degradation Gharoli Fair Acceptable Minimum Poor Degradation 68-Dallopura Fair Fair Improved 69-Mayur Vihar Fair Fair Improved 70-Kondali Desirable Desirable Improved 71-Shaikarpur Fair Fair Acceptable degradation 72-Mandawli Very Good Desirable Poor Degradation 73-Geeta Colony Very Good Fair Acceptable degradation 74-Laxmi Nagar Very Good Fair Acceptable degradation 75-Gandhi Nagar Desirable Acceptable Minimum Acceptable degradation 76-Raghubarpura Acceptable Minimum Bad Alarming Poor Degradation 77-Krishna Nagar Fair Poor Poor Degradation 78-Jagatpuri Bad Alarming Bad Alarming Not Changed 79-Preet Vihar Very Good Fair Acceptable degradation 80-Vishwas Nagar Fair Desirable Acceptable degradation 81-Shahdara Acceptable Minimum Poor Acceptable degradation 82-Vivek Vihar Desirable Acceptable Minimum Acceptable degradation 87-Rohtas Nagar Fair De si ra b le Acceptable degradation choose the one they prefer in terms of “the public inter- est,” as they perceive it. This concept would seem to reflect a balance between the needs of people and groups of citizens often defined as “narrow interests” and be- tween “the greater good,” as perceived by policymakers. Realization of that interest is the rational basis underly- ing urban planning and development. But environmental quality is often trampled in the name of “the public in- terest” and various populations in the city are getting affected in its wake. Over the last few decade city like Delh i has undergone impressive development in the public’s awareness of environmental issues and planning, and the ability of individuals, groups and communities to influence urban environmental quality through planning and the use of policy tools. This is seen mainly with the increase in lit- eracy and coming up of various NGOs. On the other hand, there are still many people who are not cognizant of the importance of planning and its impact on the urban environment [19]. Everyone wants to have a spacious apartment, and clean air. The question is, what is “clean” and who gets to define it; and what is the price we are willing to pay in order to reduce open spaces in the city for the sake of constantly increasing the size of the aver- age housing unit? These are clearly questions of values, and therefore the answers cannot be based solely on the opinions of environmental experts, no matter how pro- fessional and well trained they may be. Issues pertaining  A. RAHMAN ET AL. Copyright © 2011 SciRes. JGIS 83 to public participation are also a matter of great concern. They are based on an acceptance of democratic and plu- ralistic values, without which there is no conceptual basis for public participation. The idea that the public has a fundamental right to be involved in the decisions that affect their lives is a values statement, by definition. Since urban environmental quality is determined, to a large extent, by planners, decision-makers and policy- makers who influence the quality of life of each individ- ual, the public has th e right to have a say in these matters. Through involvement and participation, the public should have an influence on planning, the decisions that are made and policies that are formulated for the better urban environmen tal quality. 9. Conclusions As the urban areas are growing at a fast rate, especially in metropolitan cities like Delhi and Mumbai etc. so up-to-date information on land and people is needed to monitor and manage the quality of urban environmental. The paper shows that the East Delhi has experienced environmental deterioration in two decades especially in southern periphery due to unplanned urban expansion adjoining to the state of Uttar Pradesh. Physical envi- ronment is to be improved in north-western part, by ur- ban renewal scheme by providing greenery and im- provement of traffic movement. The physical environ- ment in many slums areas is poor and they should be provided with necessary services lik e water supply, sani- tation, sewerage and accessibility to roads. Remote sensing data and GIS technique is very useful for extrac- tion of information like built-u p areas, open green space, urban land use mapping that are important attribute for assessing the urban environmental qu ality for a big urban agglomeration. The fast growing areas in Census towns located in southern part should be properly planned and the infrastructure and other recreational facilities should be improved in these areas so as to improve the envi- ronmental quality of these urban settings. There should be a larger role of public for planning and designing the urban land use pattern and other associated activities in order to have a healthy urban environment for the good quality of life. 10. References [1] A. Rahman, M. Netzband, S. Alka and M. Javed, “An assessment of Urban Environmental Issues Using Remote Sensing and GIS Techniques an Integrated Approach: A Case Study: Delhi, India,” In: A. de Sherbinin, A. Rah- man, A. Barbieri, J. C. Fosto and Y. Zhu, Eds., Urban Population-Environment Dynamics in the Developing World: Case Studies an Lessons Learned, International Cooperation in National Research in Demography (CICRED), Paris, 2009, pp. 181-211. [2] “Census of India,” New Delhi, 1991. www.censusindia. net [3] “Census of India,” New Delhi, 2001, www.censusindia. net [4] S. Fazal, “Land Reorganization Study along Major Roads,” Land Use Policy, Vol. 18, No. 2, 2001, pp. 191-199. doi:10.1016/S0264-8377(01)00007-2 [5] B. Mishra, R. B. Singh and M. Anupama, “Delhi Me- tropolis: Housing and Quality of Life,” In: R. P. Mishra, Million Cities of India, Vol. 1, 2001, pp. 196-228. [6] A. Rahman, “Application of Remote Sensing and GIS Technique for Urban Environmental Management and Sustainable Development of Delhi, India,” In: M. Netz- band, W. L. Stefnow and C L. Reman, Eds., Applied Re- mote Sensing for Urban Planning, Governance and Sus- tainability, Springer-Verlag Publishes, Berlin, 2007, pp. 165- 197. doi:10.1007/978-3-540-68009-3_8 [7] S. Sengupta and P. Venkatachalam, “Assessment of So- cial and Physical Environment of a Planned Town with Geographical Information System: A Case of Durgapur, West Bengal, India,” In: B. S. Sokhi and S. M. Rashid, Eds., Remote Sensing of Urban Environment, 1999, pp. 196-203. [8] MoEF (Ministry of Environment and Forest), “White Paper on Pollution in Delhi with Action Plan,” Govern- ment of India, 1997. [9] J. Nichol and M. S. Wong, “Mapping and Modelling of Urban Environment Quality in Hongkong,” 2004. [10] ISRO, “Urban Planning Using IRS-1C Data,” Banglore, 2005. [11] R. S. Rathi and R. R. Vatsvani, “Digital Mapping of Ur- ban/Sub-Urban Environment of Dehradun Using SPOT Data,” In: B. S. Sokhi and S. M. Rashid, Eds., Remote Sensing of Urban Environment, 1999, pp. 123-136. [12] P. V. P. C. Prasad, “Environmental Impact Assessment,” Project Work, HUSA, IIRS, NRSA, 1990. [13] J. R. Eastman, “Multi-Criteria Evaluation and GIS,” In: P. A. Langley, M. F. Goodchild, D. J. Maguire and D. W. Rhind, Eds., Geographical Information System, Vol. 1, Principals and Technical Issues, 2002. [14] K. K. Talukdar and B. Ramesh, “Assessment of Urban Environment Quality Using Large Scale Aerial Photo- graphs-Case Study in Dwarka, Delhi,” In: Proceedings, Indian Society of Remote Sensing Silver Jubilee Sympo- sium 1994-1995, Indian Institute of Remote Sensing, De- hradun, 1995, pp. 250-257. [15] Economic Survey of Delhi, 1999-2000. http://delhiplan- ning.nic.in/Economic%20Survey/chapter_3.htm [16] I. Kimhi, “Urban Environmental Quality,” The Centre for Environmental Policy Studies Series #12, the Jerusalem Institute for Israel Studies, Jerusalem, 2005. http://www.j iis.org.il [17] CSE (Centre for Science and Environment), “A people’s model to clean air: Steering the way, Down to Earth,”  A. RAHMAN ET AL. Copyright © 2011 SciRes. JGIS 84 New Delhi, Vol. 11, No. 12, November 2002. [18] J. E. Hardoy, D. Mitlin and D. Satterthwaite, “Environ- mental Problems in Third World Cities,” Earthscan Pub- lication, London, 1997. [19] B. N. Haack, “Urban Analysis and Planning,” In: Manual of Photographic Interpretation, 2nd Edition, W. R. Phil- ipson, Editor-in-Chief, ASPRS, 1997. |