 Journal of Sustainable Bioenergy Systems, 2013, 3, 209-216 http://dx.doi.org/10.4236/jsbs.2013.33029 Published Online September 2013 (http://www.scirp.org/journal/jsbs) Economic Analysis of Biodiesel and Glycerol Carbonate Production Plant by Glycerolysis Nghi Nguyen*, Yaşar Demirel Department of Chemical and Biomolecular Engineering, University of Nebraska Lincoln, Lincoln, USA Email: *nghinguyen1985@yahoo.com Received June 12, 2013; revised July 12, 2013; accepted July 30, 2013 Copyright © 2013 Nghi Nguyen, Yaşar Demirel. This is an open access article distributed under the Creative Commons Attribution License, which permits unrestricted use, distribution, and reproduction in any medium, provided the original work is properly cited. ABSTRACT Techno-economic analysis of an indirect use of carbon dioxide within the route of glycerolysis of glycerol with urea is investigated. The results show that the net present value of the biodiesel-glycerol carbonate production by glycerolysis is higher than the biodiesel-glycerol carbonate production by direct carboxylationat at the end of the 12-year operation with similar capacities. The stochastic model has predicted that using glycerolysis route for the synthesis of glycerol carbonate production might increase the probability of getting positive net present value by about 15%. Keywords: Biodiesel; Direct Carboxylation; Glycerolysis; Glycerol Carbonate; Economic Analysis 1. Introduction Biodiesel is renewable, nontoxic, biodegradable, and essentially free of sulfur and aromatics, hence it may be one of the most suitable candidates for future biofuel. Besides, US Department of Energy life cycle analysis on biodiesel shows that it produces 78.5% less net carbon dioxide emissions compared to petroleum diesel [1]. In 2011, the United States produced approximately 1.1 bil- lion gallons of biodiesel and the production is expected to increase to 1.9 billion gallons in 2015 [2]. The major drawbacks of biodiesel production using vegetable oil are the high costs of manufacturing and the feedstock oil, which competes with food. Currently, biodiesel produc- tion plants depend on government subsidies in order to keep their plants in operation [2]. Thus, seeking for a more economic biodiesel production process to reduce the dependency of government subsidies and promote expansion of biodiesel industry is desirable. Recently, a conventional biodiesel production plant was retrofitted using thermodynamic analysis, which em- ploys process heat integration, column grand composite curves, and exergy loss profiles to assess the existing operation and suggest modifications [3]. The retrofit de- sign operates with less thermodynamic imperfections, hence it requires less energy. With a suitable reaction rate, a type of catalyst, relative volatilities of the compo- nents, and the reaction and separation temperature range, reaction and separation can be combined into a reac- tive distillation (RD) [4-6]. RD reduces operational and equipment costs by decreasing waste energy and over- coming thermodynamic and chemical equilibrium limita- tions. Further reduction of energy and equipment cost of the biodiesel production plant is possible by using ther- mally coupled distillation column sequences as they al- low interconnecting vapor and liquid flows between the two columns to eliminate the reboiler or condenser or both [7]. About 1 kg of glycerol is formed for every 10 kg of biodiesel produced [8]. The production cost of biodiesel increases by $0.021/liter for every $0.22/kg reduction in glycerol selling price [9,10]. As a result, economical utilization schemes of bioglycerol can lead to a more economical biodiesel production plant. A recent study suggests that addition of glycerol carbonate production by direct carboxylation route may be more economical than the conventional biodiesel production plant [11]. However, recently, Li and Wang (2011) [12] have sug- gested that direct carboxylation of glycerol and CO2 is thermodynamically limited and the yield is very low (less than 35%) [13]. Low yield requires high energy for the separation of products and the recovery of reactants lead- ing to high cost of manufacturing. Thus, in this study synthesis of glycerol carbonate by glycerolysis route is developed and economics of the biodiesel-glycerol car- bonate production by direct carboxylation and glyceroly- sis plants are compared. Economic analyses based on *Corresponding author. C opyright © 2013 SciRes. JSBS  N. NGUYEN, Y. DEMIREL 210 deterministic and stochastic models are used to compare the two plants to determine the most feasible process. 2. Direct Carboxylation Plant The direct carboxylation plant contains two Sections. Section 1 produces biodiesel and crude bioglycerol, while Section 2 produces bioglycerol carbonate and wa- ter. Overall, Section 1 consumes 738.89 kg/h of methanol and 6419.51 kg/h of oil to produce 6482.25 kg/h of fatty acid methyl ester (FAME) and 1652.97 kg/h of glycerol. The glycerol carbonate production section (Section 2) utilizes 273.74 kg/h of carbon dioxide, 266.78 kg/h of methanol, and the glycerol as a byproduct of the Section 1 to produce 649.69 kg/h of glycerol carbonate and 209.51 kg/h of water. Process details are available in reference [11]. 3. Glycerolysis Plant 3.1. Glycerolysis Reaction Glycerolysis with urea (using urea as CO2 donor) may be described by the following reactions [14]. Over 89% of glycerol carbonate yield with 98.6% se- lectivity can be achieved when the reaction proceeds at 140˚C, 3 kPa, with a glycerol to urea mass ratio of 3.07, and 1% of La2O3-600 as a catalyst in 1 hour. La2O3-600 shows high stability, even after six consecutive runs and GC yield is still over 84% with over 97% selectivity can be obtained [14]. Ammonia (NH3) is released when urea reacts with glycerol. Urea can be recovered by reacting NH3 with CO2 under high pressure and temperature [15]. 3.2. Process Flow Diagram The glycerolysis plant contains two sections as shown in Figure 1(a). Section 1 (Figure 1(b)) produces biodiesel and crude bioglycerol, while Section 2 (Figure 1(c)) pro- duces bioglycerol carbonate and water. Section 1 utilizes methanol and triglyceride to produce FAME and crude glycerol using calcined eggshell containing mostly CaO as a catalyst. Utilization of catalyst derived from waste materials reduces the overall cost of manufacturing as well as beneficial to the environment [16]. Recycled and fresh methanol and oil are mixed in mixer M101 and fed into the reactor R101.When the reaction proceed at 65˚C and 100 kPa, 98% conversion of triglyceride is achieved in 3 hours, with the methanol to oil molar ratio of 9:1 and 3% of the catalyst [17]. The reactor effluent, stream S2, containing mixture of catalyst, products, and unreacted reactants, is sent to separator SEP101 to recover catalyst, which will be discarded after 13 cycles(approximately 36 hours of operation) [17]. The outlet of separator SEP101, stream S3, enters de- canter DEC101 to remove glycerol by phase separation. The top layer, stream S4, of the decanter DEC101 is heated to 104.3˚C by stream S6 in heater HX101 before it is sent to stage 2 of the distillation column T101. Col- umn T101 operates at 3 stages with a total condenser and a kettle reboiler. The distillate, containing mostly metha- nol, is recycled while the bottom, containing 6319.55 kg/h of FAME, becomes the primary product. The stream properties of the biodiesel plant shown in Figure 1(b) are summarized in Table 1, which is obtained by using the Aspen plus V7.3 with the thermodynamic model of UNIF-DMD. Overall, Section 1 of the glycerolysis plant uses 741.18 kg/h of methanol and 6419.51 kg/h of oil to produce 6319.55 kg/h of FAME and 1653.28 kg/h of crude glycerol as summarized in Table 1. In Section 2, stream BY-PROD is sent to flash drum F201 to recover methanol. Using design specification block, the flow rate of methanol in the distillate of flash drum F201 is set to 30.40 kmol/h by varying the tem- perature. Flash drum F201 operates at 102.44˚C and 20 kPa. The distillate, stream R5, is recycled to Section 1, while the bottom, stream S1, mixes with the recycled glycerol, stream R4, in Mixer M201. Stream S2, con- taining mostly glycerol, is heated to reaction conditions before entering reactor R201. Fresh urea, stream UREA, is also sent to reactor R201. The reaction takes place at 140˚C and 3 kPa with the glycerol to urea mass ratio of 1.79, and using 1% of La2O3-600 as a catalyst in 1 hour. Under these conditions, it was assumed that 85% yield and 100% selectivity of glycerol carbonate are achieved [14]. Separator SEP201 is used to recover the catalyst lanthanum oxide from the reactor outlet. After six con- secutive runs, lanthanum oxide is discarded as waste [14]. The outlet of separator, stream S5, is cooled to 60˚C before it is sent to flash drum F202 to separate NH3. Flash drum F202 operates at 60˚C and 50 kPa. Stream S12 is a secondary by-product containing mostly ammo- nia and stored after it is cooled to 25˚C. Using additional unit for urea production from NH3 and CO2 is not feasi- ble because of the low production capacity. The bottom product, stream S7, is heated to 140˚C in heater H202 andsent to stage 10 of distillation column T201 to mini- mize exergy losses caused by the temperature gradient [3,7,18,19]. Distillation column T201 operates with 16 equilibrium stages with a partial condenser and a kettle Copyright © 2013 SciRes. JSBS  N. NGUYEN, Y. DEMIREL Copyright © 2013 SciRes. JSBS 211 HIERARCHY SECTION1 HIERARCHY SECT I ON2 OIL METH R5 BY-PR OD FAME UREA PROD-GC NH3OUT (a) OIL OIL(IN) MET H MET H(IN) R5 R5(IN) BY-PROD BY-PROD(OUT) FAME FAME(OUT ) S2 S3 R1 CATOUT S1 R2 R3 R6 S4 MK UP S6 S5 S7 SEP101 R101 M101 DEC101 M102 HX101 E101 E102 T101 (b) BY-PRODBY-PROD(IN) UREAUREA(IN) R5R5(OUT) PR OD - GCPROD-GC(OUT) NH3OUTN H3OU T(OUT) S1 S3 R2 S4 S2 R4 S5 CATOUT R1 S6 S7 S10 S8 R3 METOUT S9 MKUP F201 R201 H201 M201SEP201 F202 T201 E201 H202 M203 E202 E203 E204 (c) Figure 1. (a) Hierarchy of the novel biodiesel production plant by glycerolysis route; (b) Process flow diagram of Section 1 for biodiesel and bioglycerol production plant; (c) Process flow diagram of Section 2 for bioglycerol carbonate production plant. reboiler. Two design specifications are used to control the molar flow rates of methanol and glycerol in the dis- tillate of the distillation column, T201. The first design specification sets the molar flow rate of glycerol in stream R3 to 1 kmol/h by varying the bottom flow rate. The second design specification sets the flow rate of methanol to 0.065 kmol/h in stream R3 by varying the distillate vapor fraction. The distillate stream, R3, con- taining mostly glycerol is recycled. The bottom stream contains 97.59% of 830.79 kg/h of glycerol carbonate as the secondary product as shown in Table 2. 4. Economic Analysis 4.1. Deterministic Model The bare module costs of major equipment , o mi C are estimated using the CAPCOST 2008 program and the chemical engineering plant cost index (CEPCI) of 580  N. NGUYEN, Y. DEMIREL 212 Table 1. Streams properties of Section 1 of the novel biodiesel production plant by glycerolysis shown in Figure 1(b). BY-PROD FAMEMETH OIL R3 R5 R6 S1 S3 S4 S5 S6 S7 Mass Flow kg·h−1 METHANOL 9.95E+02 3.76E+017.41E+02 0.00E+00 3.78E+02 9.74E+02 9.74E+02 2.09E+03 1.41E+03 4.15E+02 4.15E+02 3.76E+01 3.76E+01 OIL 1.68E−06 1.28E+020.00E+00 6.42E+03 1.25E−01 1.68E−06 1.68E−06 6.42E+031.28E+02 1.28E+02 1.28E+02 1.28E+02 1.28E+02 FAME 3.79E+00 6.32E+030.00E+00 0.00E+00 7.34E−02 3.46E+003.46E+00 3.53E+00 6.32E+03 6.32E+03 6.32E+03 6.32E+03 6.32E+03 GLYCEROL 6.55E+02 2.54E+000.00E+00 0.00E+00 4.41E−02 2.74E+002.74E+00 2.79E+00 6.57E+02 2.59E+00 2.59E+00 2.54E+00 2.54E+00 Mass Frac METHANOL 0.6018 0.00581.0000 0.0000 0.9994 0.9937 0.9937 0.2457 0.1655 0.0605 0.0605 0.0058 0.0058 OIL 0.0000 0.01980.0000 1.0000 0.0003 0.0000 0.0000 0.75350.0151 0.0187 0.0187 0.0198 0.0198 FAME 0.0023 0.97400.0000 0.0000 0.0002 0.0035 0.0035 0.0004 0.7423 0.9204 0.9204 0.9740 0.9740 GLYCEROL 0.3959 0.00040.0000 0.0000 0.0001 0.0028 0.0028 0.0003 0.0771 0.0004 0.0004 0.0004 0.0004 Total Flow kg·h−1 1653.28 6487.93741.18 6419.51 377.99980.52980.528519.20 8519.20 6865.92 6865.92 6487.93 6487.93 Temperature ˚C 65.00 25.00 25.00 25.00 64.31 100.0025.00 25.09 65.00 65.00 104.30 138.3775.00 Pressure kPa 100 100 100 100 100 20 100 100 100 100 100 100 100 for the year 2011 [20]. The Fixed Capital Investment (FCI) of the direct carboxylation plant is $29,276,352, while the FCI of the glycerolysis plant is $27,000,160 as shown in Table 3. The cost estimation accuracies of the preliminary designs range from +25% to −15% of the actual costs. Land (L) and working capital (WC) are as- sumed equal to 5% and 20% of FCI, respectively. Table 3 also shows the total cost of utilities. The costs of utili- ties for low and medium pressure steam, cooling water, and electricity [21] are updated using the 2011 CEPCI of 580. Number of employee (NOL) is estimated using equa- tion from reference [22]. All the costs can be updated by using the current value of CEPCI in Cost(new) = Cost(old)[CEPCI(new)/CEPCI(old)]. The total cost of labor summarized in Table 3 is cal- culated based on 8400 h/year of the plant operation. The cost of waste disposal is $0.37/kg [21]. The price of oil and methanol are $0.79/Liter and $0.20/Liter, respect- tively. The current selling price of products is presented in Table 3. With the inclusion of tax incentive and re- newable index number, biodiesel producers can get up to $0.74/Liter in addition to the market price of biodiesel [23], making the selling price of biodiesel approximately equal to $1.19/Liter. Salvage (S) value is 5% of FCI [22]. The useful life of the plants, taxation rate (t), years of depreciation and interest rate are also presented in Table 3. In the deterministic model, based on the most likely economic data considered in Table 3, discounted cash flows (DCF) and cumulative discounted cash flows (CDCFs) are estimated. The plot of DCFs versus years of operation yields the feasibility criteria of net present value (NPV), payback period (PBP), and rate of return (ROR). For a feasible operation, at least two criteria must satisfy the conditions: NPV ≥ 0; ROR >i (interest rate), and PBP ≥ n (plant operation time). 4.2. Stochastic Model In reality, parameters used to evaluate profitability are subject to change throughout the life of the chemical plant. Stochastic model incorporates Monte-Carlo simu- lation into economic analysis to quantify the uncertainty on the values of NPV, PBP, and ROR [22]. Trapezoidal, normal, and lognormal density cumulative probability density function are often used to describe uncertainty in data. However, triangular cumulative probability func- tion (P(x)) can be used to reduce calculation complexity [22] 2 for xa Pxx b caba (1) 2for baxb cxb Pxx b ca cacb (2) where a is the estimate of the lowest value, b is the most likely value and c is the estimate of the highest value. The uncertainties on the fixed capital investment, price of product, working capital, income tax rate, interest rate, raw material, and salvage values are considered for sto- chastic model economic comparison. The assumed un- certainties of those parameters from the base value are listed in Table 4. 5. Results and Discussions T he market value of crude bioglycerol is low due to its Copyright © 2013 SciRes. JSBS 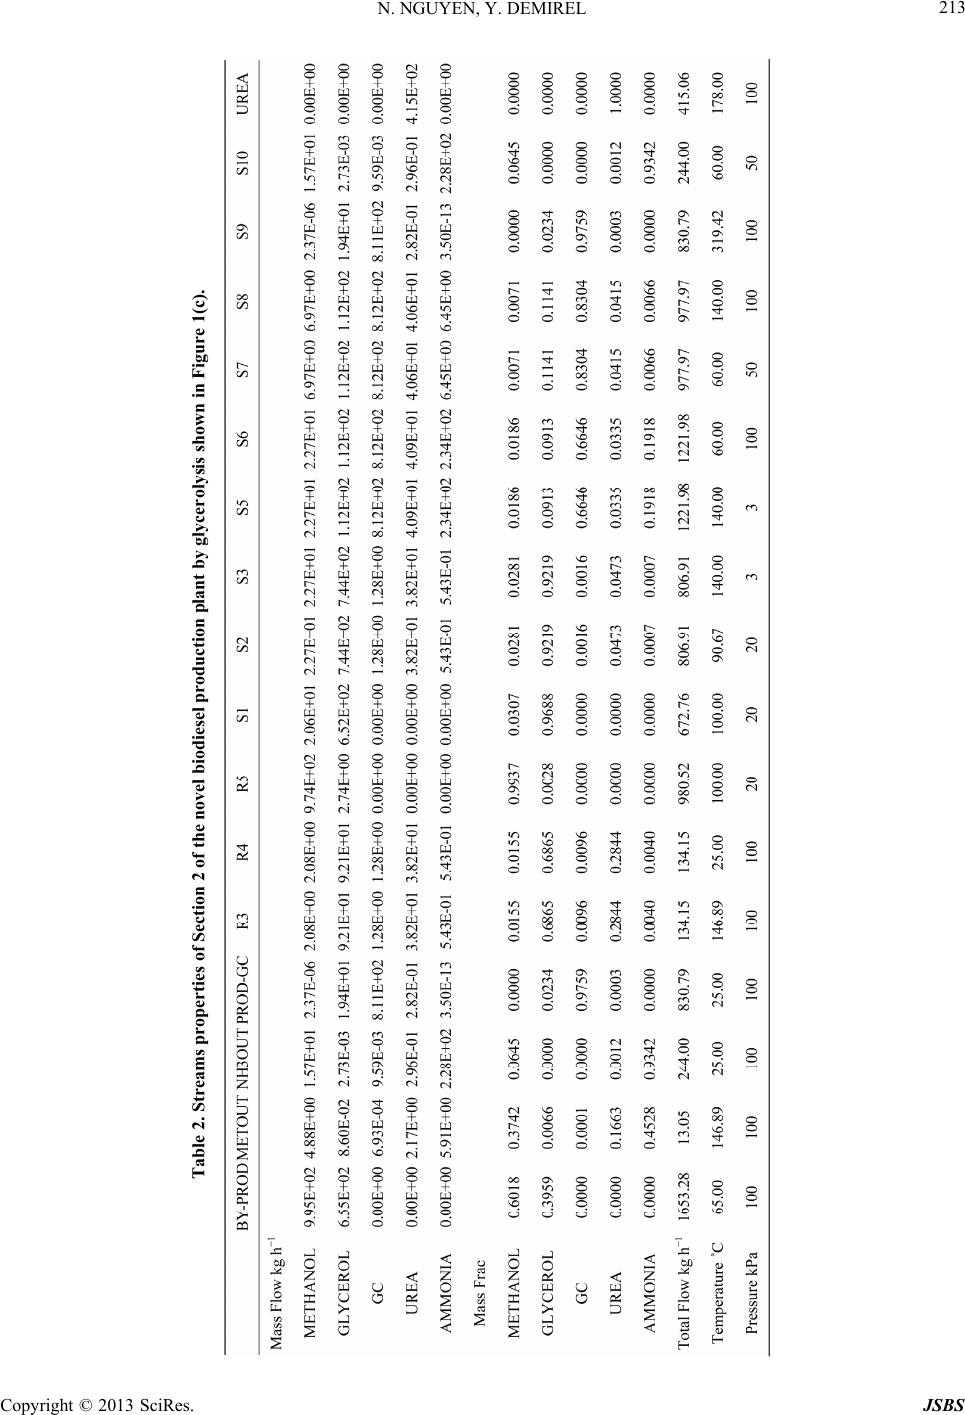 N. NGUYEN, Y. DEMIREL 213 Table 2. Streams properties of Section 2 of the novel biodiesel production plant by glycerolysis shown in Figure 1(c). Copyright © 2013 SciRes. JSBS  N. NGUYEN, Y. DEMIREL 214 Table 3. Major cost factors of the biodiesel with glycerol carbonate production plants. Direct Carbonxylation Glycerolysis Fixed capital investment (FCI), $ 29,276,352.00 27,000,160.00 Land (L), $ (5% of FCI) 1,463,817.60 1,350,008.00 Working capital (WC), $ (20% of FCI) 5,855,270.40 5,400,032.00 Labor, $ h-1 30 30 Operating labor 16 16 Cost of labor (COL), $ 4,032,000.00 4,032,000.00 Cost of Electricity, $ kW-1·h−1 0.0666 0.0666 Cost of cooling water, $ tonne−1 0.0202 0.0202 Cost of 1 bar steam, $ tonne−1 2.4 2.4 Cost of 22 bar steam, $ tonne-1 - 14.7 Cost of 35 bar steam, $ tonne−1 16.6 - Cost of 190 bar steam, $ tonne−1 - 23.3 Cost of utilities (CUT), $ 982,856.23 347,810.85 Waste treatment, $ kg−1 0.37 0.37 Waste treatment (S), $ 987,610.17 124,596.33 Cost of methanol, $ L−1 0.20 0.20 Cost of oil, $ L−1 0.79 0.79 Cost of CO2, $ kg−1 0.045 0.045 Cost of Urea, $ kg−1 - 0.27 Cost of CaO, $ kg−1 0.10 0.10 Cost of n-Bu2SnO, $ kg−1 17.15 - Cost of La2O3, $ kg−1 - 12.00 Total cost of raw materials, $ 48,752,136.47 49,590,018.45 Cost of manufacturing (COM), $ 78,665,904.89 77,444,172.33 Price of FAME, $ L−1 1.19 1.19 Price of GC, $ kg−1 2.4 2.4 Price of NH3, $ kg−1 - 0.12 Revenue (R), $ yr−1 88,881,165.58 92,393,726.54 Salvage value (S), $ 1,463,817.60 1,350,008.00 Taxation rate (t), % 35 35 Years of operation (n) 12 12 Years of depreciation** (k) 5 5 Operational time, h yr−1 8400 8400 Interest rate (i), % 5 5 L: Liter; **Depreciation method: Modified Accelerated Cost Recovery Sys- tem (MACRS). excess production as a by-product of the biodiesel pro- duction. Purification of glycerol in a small to medium scale biodiesel production plant is not feasible due to high investment in separation units and low ROR. Figure 2 shows the discounted cash flow diagrams generated using the deterministic model based on the 5 year Modified Accelerated Cost Recovery System (MACRS) depreciation method. Table 5 presents the discounted profitability criteria of the two plants. Any two criteria should be favorable for the project to be fea- sible. The net present value of the glycerolysis plant is about $27.83million higher than the direct carboxylation plant at the end of 12-year project. The discounted pay- back period of the direct carboxylation and glycerolysis plants is 3.7 and 2.4 years, respectively, as shown in Ta- ble 5. Table 4. Uncertainties on some key economic parameters. Lower Limit (a) Upper Limit (c) Fixed capital investment −20% 30% Price of product −10% 10% Working capital −30% 10% Income tax rate −20% 20% Interest rate −10% 20% Raw material price −10% 15% Salvage value −30% 20% Table 5. Discounted profitability criteria. Direct Carboxylation Glycerolysis Net Present Value (millions) (NPV ≥ 0) 34.05 61.88 Discounted Cash Flow Rate of Return (ROR > i) 19.91% 32.08% Discounted Payback Period (years) (DPBP ≥ n) 3.7 2.4 -40 -20 0 20 40 60 02468101214 CDCF ($ 10 6 ) Ye ar Direct Carboxylation Glycerolysis Figure 2. Comparison of the cumulative discounted cash flow (CDCF) diagrams of the direct carboxylation and glycerolysis routes. Copyright © 2013 SciRes. JSBS  N. NGUYEN, Y. DEMIREL 215 Table 4 presents the uncertainties on some of the key parameters over the plant life. Figure 3 presents the cu- mulative probability distributions obtained 1000-point Monte Carlo simulations for the values of NPV, dis- counted cash flow rate of return (DCFROR) and dis- counted payback period (DPBP) obtained using CAP- COST 2008 software based on the uncertainties of pa- rameters shown in Table 4 [20]. Figure 3(a) shows that 0.0 0.2 0.4 0.6 0.8 1.0 -60-30030 60 90120 Cumulative Probability Net Present Values ($ 10 6 ) Direct Carboxylation Glycerolysis (a) 0.0 0.2 0.4 0.6 0.8 1.0 0.0 0.1 0.2 0.3 0.4 0.5 0.6 0.7 Cumulative Probability DCFROR Direct Carboxylation Glycerolysis (b) 0.0 0.2 0.4 0.6 0.8 1.0 147101 Cumulative Probability DPBP (years) 3 Direct Carboxylation Glycerolysis (c) Figure 3. 1000-point Monte Carlo simulation on; (a) Net present values (NPV); (b) Discounted cash flow rate of re- turn (DCFROR); (c) Discounted payback period (DPBP). there is about 17% chance that the direct carboxylation plant will not be profitable, while there is approximately 2% chance that the glycerolysis plant will not be profit- able. The glycerolysis plant is about 15% more likely to be profitable compared to the direct carboxylation plant. If the median probability of 50% is considered, the glyc- erolysis plant yields a higher value of NPV of $28million. The lowest values of NPV for the direct carboxylation and glycerolysis plants are −$63.8 and −$29.5 million, respectively, while the highest possible values of NPV for the direct carboxylationand glycerolysis plants are $151.5 and $128.2 million, respectively. 6. Conclusion Production of glycerol carbonate using direct carboxyla- tion route suffers from low yield and costly separation units. In contrast, the glycerolysis route using CO2 indi- rectly and urea as a CO2 donor may simplify the glycerol carbonate production, and hence it leads to a more eco- nomical biodiesel-glycerol carbonate production process. Deterministic model predictions show that the net present value of the glycerolysis plant is higher than that of the direct carboxylation plant at the end of 12-year operation. Stochastic model for the economic analysis predicts that the glycerolysis route for glycerol carbonate production increases the probability of getting positive net present value by about 15%. REFERENCES [1] J. Sheehan, V. Camobreco, J. Duffield, M. Graboski and H. Shapouri, “Life Cycle Inventory of Biodiesel and Pe- troleum Diesel for Use in an Urban Bus [Internet],”NREL, 2011. http://www.nrel.gov/docs/legosti/fy98/24089.pdf [2] J. M. Urbanchuk, “Economic Impact of Removing the Biodiesel Tax Credit for 2010 and Implementation of RFS2 Targets through 2015 [Internet],” Cardno ENTRIX, 2012. http://www.biodiesel.org/reports/20110608_gen-425.pdf [3] N. Nguyen and Y. Demirel, “Retrofit of Distillation Col- umns in Biodiesel Production Plants,” Energy, Vol. 35, No. 4, 2010, pp. 1625-1632. doi:10.1016/j.energy.2009.12.009 [4] A. C. Dimian, C. S. Bildea and F. Omota, “Innovative Process for Fatty Acid Esters by Dual Reactive Distilla- tion,” Computers & Chemical Engineering, Vol. 33, No. 3, 2009, pp. 743-750. doi:10.1016/j.compchemeng.2008.09.020 [5] W. L. Luyben and C.-C. Yu, “Reactive Distillation De- sign and Control,” Wiley, New York, 2008. [6] N. Nguyen and Y. Demirel, “Reactive Distillation Col- umn for Esterification of Lauric Acid with Methanol: Equilibrium vs. Nonequilibrium Approaches,” American Institute of Chemical Engineers Annual Meeting Confer- ence Proceedings, Salt Lake City, 2010. https://aiche.confex.com/aiche/2010/webprogram/Paper1 Copyright © 2013 SciRes. JSBS  N. NGUYEN, Y. DEMIREL Copyright © 2013 SciRes. JSBS 216 97994.html [7] N. Nguyen and Y. Demirel, “Using Thermally Coupled Reactive Distillation Columns in Biodiesel Production,” Energy, Vol. 36. No. 8, 2011, pp. 4838-4847. doi:10.1016/j.energy.2011.05.020 [8] N. Nguyen and Y. Demirel, “Carboxylation of Glycerol in a Biodiesel Plant,” American Institute of Chemical En- gineers Annual Meeting Conference Proceedings, Salt Lake City, 2010. http://www3.aiche.org/Proceedings/Abstract.aspx?PaperI D=197821 [9] S. Behzadi and M. M. Farid, “Review: Examining the Use of Different Feedstock for the Production of Bio- diesel,” Asia-Pacific Journal of Chemical Engineering, Vol. 2, No. 5, 2007, pp. 480-486. [10] Y. Zheng, X. Chen and Y. Shen, “Commodity Chemicals Derived from Glycerol, an Important Biorefinery Feed- stock,” Chemical Reviews, Vol. 108, No. 12, 2008, pp. 5253-5277. doi:10.1021/cr068216s [11] N. Nguyen and Y. Demirel, “A novel Biodiesel and Glyc- erol Carbonate Production Plant,” International Journal of Chemical Reactor Engineering, Vol. 9, No. 1, 2011, p. A108. doi:10.2202/1542-6580.2856 [12] J. Li and T. Wang, “Chemical Equilibrium of Glycerol Carbonate Synthesis from Glycerol,” The Journal of Che- mical Thermodynamics, Vol. 43, No. 5, 2011, pp. 731- 736. doi:10.1016/j.jct.2010.12.013 [13] J. George, Y. Patel, S. Pillai and P. Munshi, “Methanol Assisted Selective Formation of 1,2-Glycerol Carbonate from Glycerol and Carbon Dioxide Using nBu2SnO as a Catalyst,” Journal of Molecular Catalysis A: Chemical, Vol. 304, No.1-2, 2009, pp. 1-7. doi:10.1016/j.molcata.2009.01.010 [14] L. Wang, Y. Ma, Y. Wang, S. Liu and Y. Deng, “Effi- cient Synthesis of Glycerol Carbonate from Glycerol and Urea with Lanthanum Oxide as a Solid Base Catalyst,” Catalysis Communications, Vol. 12, No. 15, 2011, pp. 1459-1462. doi:10.1016/j.catcom.2011.05.027 [15] K. Piotrowski, J. Piotrowski and J. Schlesinger, “Model- ing of Complex Liquid-Vapour Equilibria in the Urea Synthesis Process with the Use of Artificial Neural Net- work,” Chemical Engineering and Processing, Vol. 42, No. 4, 2003, pp. 285-289. doi:10.1016/S0255-2701(02)00060-0 [16] R. Chakraborty, S. Bepari and A. Banerjee, “Transesteri- fication of Soybean Oil Catalyzed by Fly Ash and Egg Shell Derived Solid Catalysts,” Chemical Engineering Journal, Vol. 165, No. 3, 2010, pp. 798-805. doi:10.1016/j.cej.2010.10.019 [17] Z. Wei, C. Xu and B. Li, “Application of Waste Eggshell as Low-Cost Solid Catalyst for Biodiesel Production,” Bioresource Technology, Vol. 100, No. 11, 2009, pp. 2883-2885. doi:10.1016/j.biortech.2008.12.039 [18] S. Bandyopadhyay, R. K. Malik and U. V. Shenoy, “Temperature-Enthalpy Curve for Energy Targeting of Distillation Columns,” Computers & Chemical Engi- neering, Vol. 22, No. 12, 1998, pp. 1733-1744. doi:10.1016/S0098-1354(98)00250-6 [19] Y. Demirel, “Retrofit of Distillation Columns Using Thermodynamic Analysis,” Separation Science and Tech- nology, Vol. 41, No. 5, 2006, pp. 791-817. doi:10.1080/01496390600600047 [20] Y. Feng and G. P. Rangaiah, “Evaluating Capital Cost Estimation Programs [Internet],” National University of Singapore, Singapore City, 2011. http://www.che.com/technical_and_practical/8359.html [21] W. D. Seider, J. D. Seader and D. R. Lewin, “Product and Process Design Principles,” 3rd Edition, John Wiley & Sons, Inc., Hoboken, 2009. [22] R. Turton, R. C. Bailie and W. B. Whiting, “Analysis, synthesis, and Design of Chemical Processes,” 3rd Edi- tion, Prentice Hall, Upper Saddle River, 2008. [23] L. Geiver, “Biodiesel RIN Prices Reach New Highs, Could Be Headed Higher [Internet],” Biodiesel Magazine, 2012. http://www.biodieselmagazine.com/articles/7611/biodie- sel-rin-prices-reach-new-highs-could-be-headed-higher
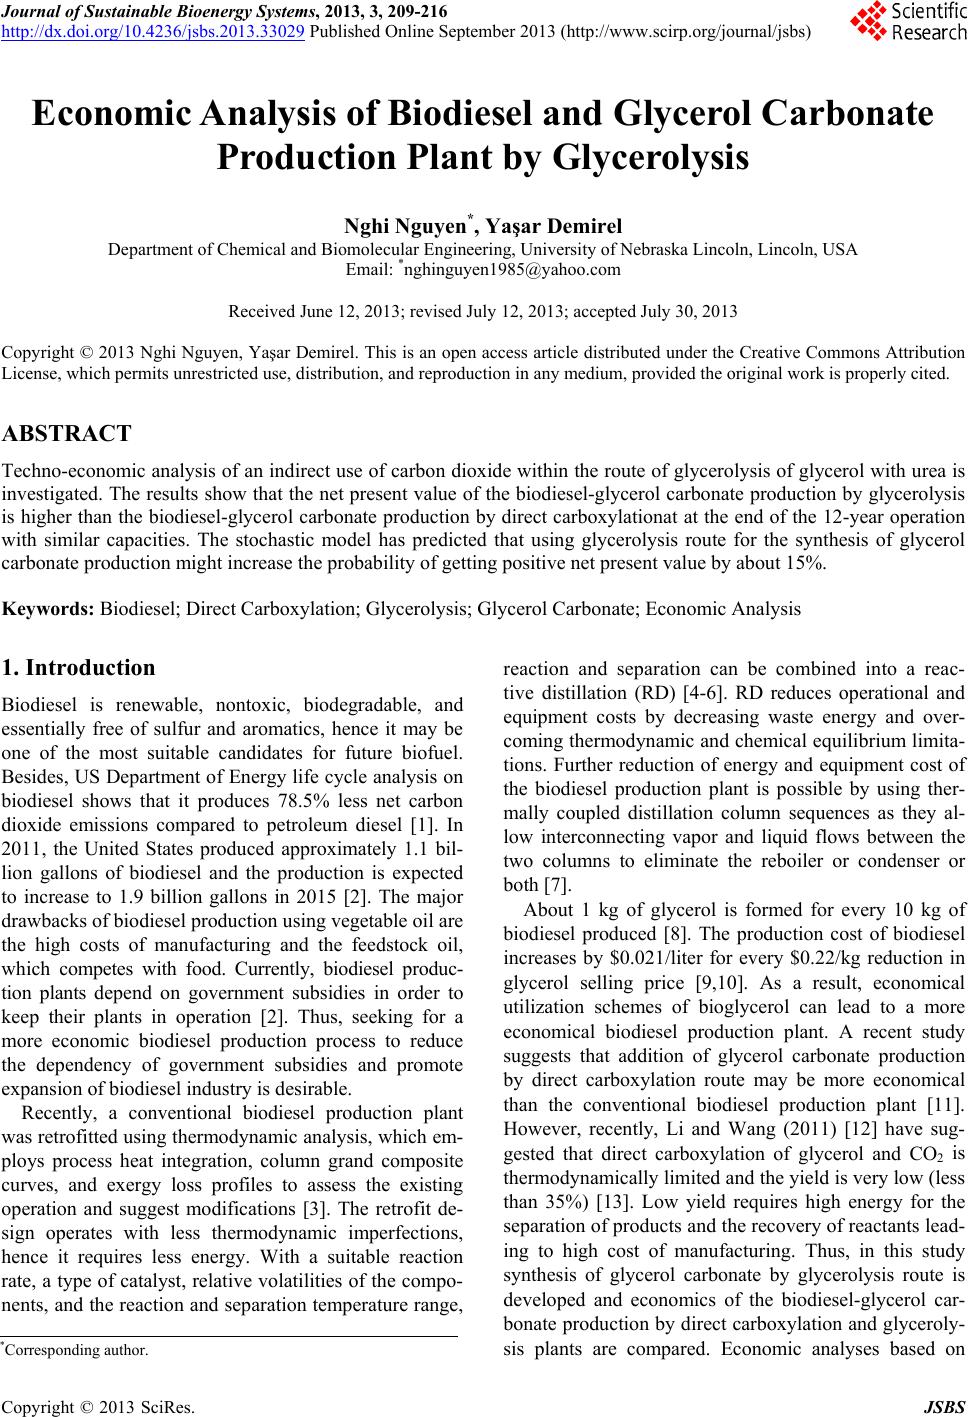
|