Paper Menu >>
Journal Menu >>
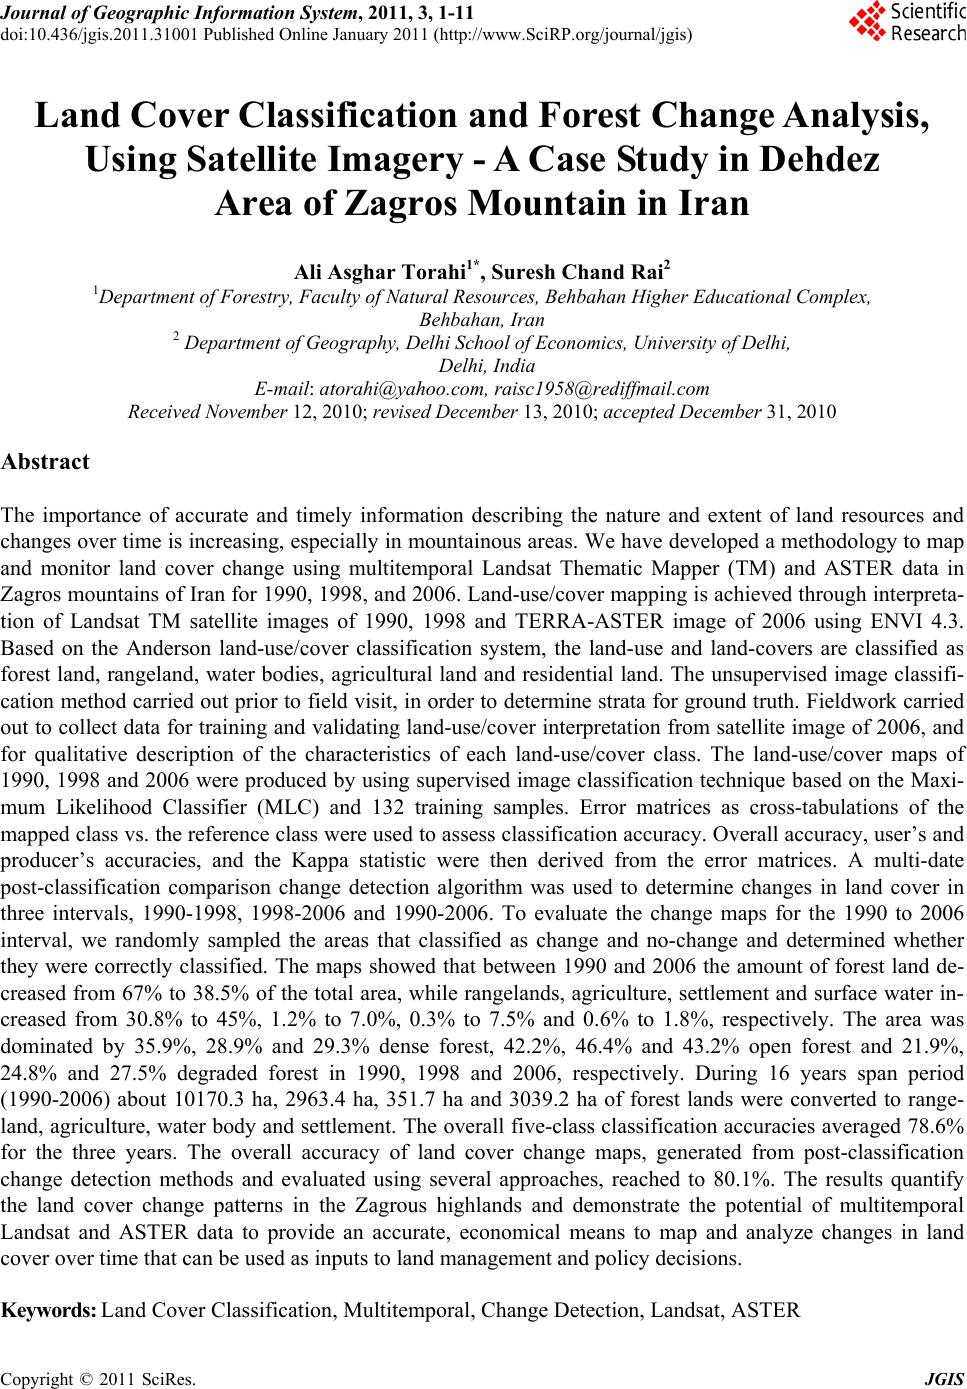 Journal of Geographic Information System, 2011, 3, 1-11 doi:10.436/jgis.2011.31001 Published Online January 2011 (http://www.SciRP.org/journal/jgis) Copyright © 2011 SciRes. JGIS Land Cover Classification and Forest Change Analysis, Using Satellite Imagery - A Case Study in Dehdez Area of Zagros Mountain in Iran Ali Asghar Torahi1*, Suresh Chand Rai2 1Department of Forestry, Faculty of Natural Resources, Behbahan Higher Educational Complex, Behbahan, Iran 2 Department of Geography, Delhi School of Economics, University of Delhi, Delhi, India E-mail: atorahi@yahoo.com, raisc1958@rediffmail.com Received November 12, 2010; revised December 13, 2010; accepted December 31, 2010 Abstract The importance of accurate and timely information describing the nature and extent of land resources and changes over time is increasing, especially in mountainous areas. We have developed a methodology to map and monitor land cover change using multitemporal Landsat Thematic Mapper (TM) and ASTER data in Zagros mountains of Iran for 1990, 1998, and 2006. Land-use/cover mapping is achieved through interpreta- tion of Landsat TM satellite images of 1990, 1998 and TERRA-ASTER image of 2006 using ENVI 4.3. Based on the Anderson land-use/cover classification system, the land-use and land-covers are classified as forest land, rangeland, water bodies, agricultural land and residential land. The unsupervised image classifi- cation method carried out prior to field visit, in order to determine strata for ground truth. Fieldwork carried out to collect data for training and validating land-use/cover interpretation from satellite image of 2006, and for qualitative description of the characteristics of each land-use/cover class. The land-use/cover maps of 1990, 1998 and 2006 were produced by using supervised image classification technique based on the Maxi- mum Likelihood Classifier (MLC) and 132 training samples. Error matrices as cross-tabulations of the mapped class vs. the reference class were used to assess classification accuracy . Overall accuracy, user’s and producer’s accuracies, and the Kappa statistic were then derived from the error matrices. A multi-date post-classification comparison change detection algorithm was used to determine changes in land cover in three intervals, 1990-1998, 1998-2006 and 1990-2006. To evaluate the change maps for the 1990 to 2006 interval, we randomly sampled the areas that classified as change and no-change and determined whether they were correctly classified. The maps showed that between 1990 and 2006 the amount of forest land de- creased from 67% to 38.5% of the total area, while rangelands, agriculture, settlement and surface water in- creased from 30.8% to 45%, 1.2% to 7.0%, 0.3% to 7.5% and 0.6% to 1.8%, respectively. The area was dominated by 35.9%, 28.9% and 29.3% dense forest, 42.2%, 46.4% and 43.2% open forest and 21.9%, 24.8% and 27.5% degraded forest in 1990, 1998 and 2006, respectively. During 16 years span period (1990-2006) about 10170.3 ha, 2963.4 ha, 351.7 ha and 3039.2 ha of forest lands were converted to range- land, agriculture, water body and settlement. The overall five-class classification accuracies averaged 78.6% for the three years. The overall accuracy of land cover change maps, generated from post-classification change detection methods and evaluated using several approaches, reached to 80.1%. The results quantify the land cover change patterns in the Zagrous highlands and demonstrate the potential of multitemporal Landsat and ASTER data to provide an accurate, economical means to map and analyze changes in land cover over time that can be used as inputs to land management and policy decisions. Keywords: Land Cover Classification, Multitemporal, Change Detection, Landsat, ASTER 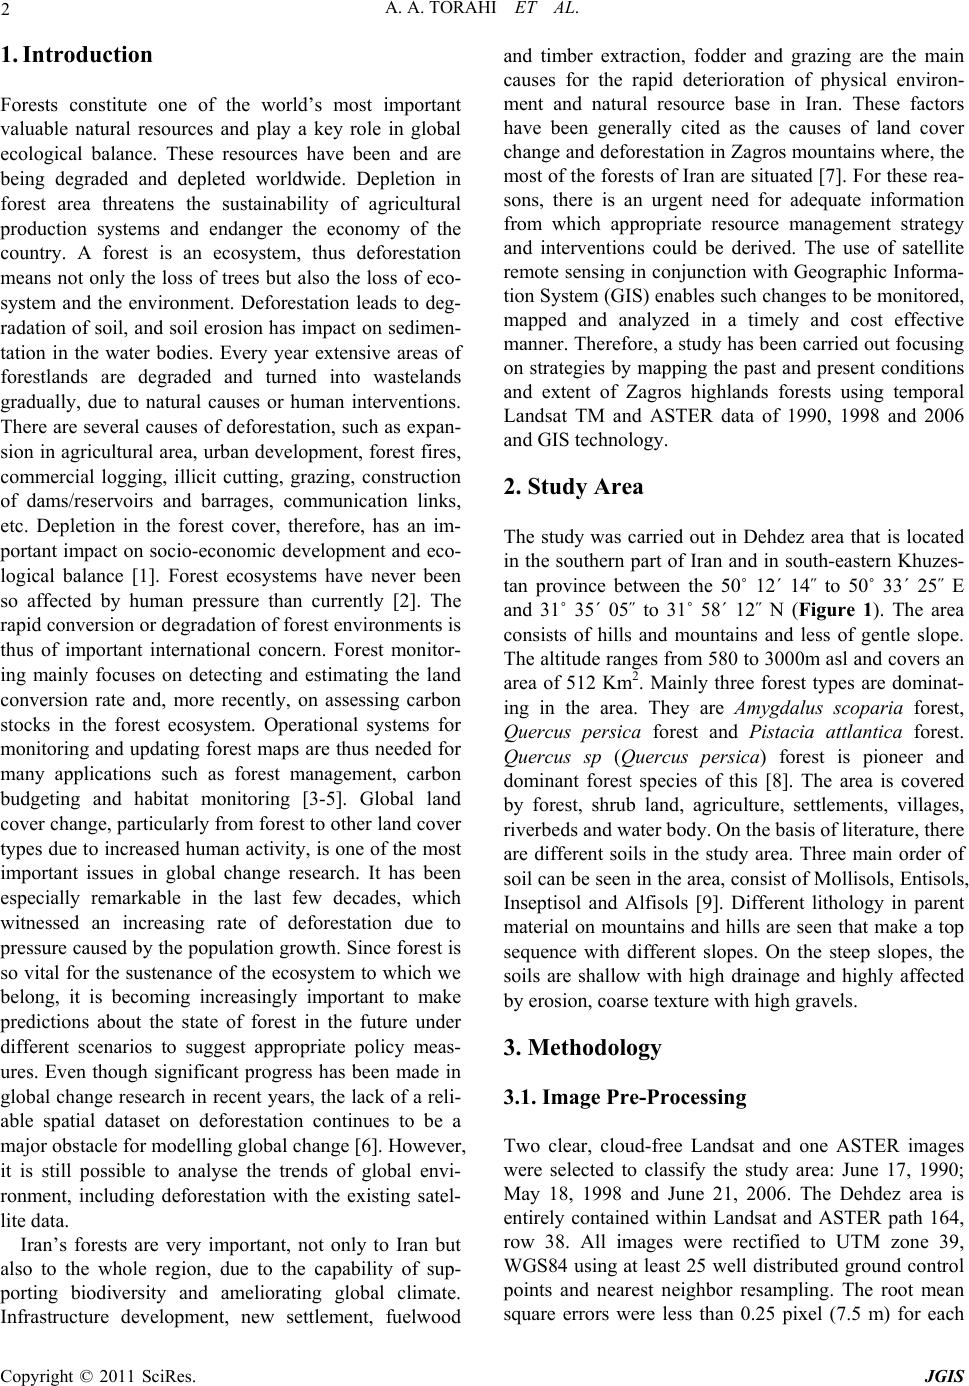 A. A. TORAHI ET AL. Copyright © 2011 SciRes. JGIS 2 1. Introduction Forests constitute one of the world’s most important valuable natural resources and play a key role in global ecological balance. These resources have been and are being degraded and depleted worldwide. Depletion in forest area threatens the sustainability of agricultural production systems and endanger the economy of the country. A forest is an ecosystem, thus deforestation means not only the loss of trees but also the loss of eco- system and the environment. Deforestation leads to deg- radation of soil, and soil erosion has impact on sedimen- tation in the water bodies. Every year extensive areas of forestlands are degraded and turned into wastelands gradually, due to natural causes or human interventions. There are several causes of deforestation, such as expan- sion in agricultural area, urban development, forest fires, commercial logging, illicit cutting, grazing, construction of dams/reservoirs and barrages, communication links, etc. Depletion in the forest cover, therefore, has an im- portant impact on socio-economic development and eco- logical balance [1]. Forest ecosystems have never been so affected by human pressure than currently [2]. The rapid conversion or degradation of forest environments is thus of important international concern. Forest monitor- ing mainly focuses on detecting and estimating the land conversion rate and, more recently, on assessing carbon stocks in the forest ecosystem. Operational systems for monitoring and updating forest maps are thus needed for many applications such as forest management, carbon budgeting and habitat monitoring [3-5]. Global land cover change, particularly from forest to other land cover types due to increased human activity, is one of the most important issues in global change research. It has been especially remarkable in the last few decades, which witnessed an increasing rate of deforestation due to pressure caused by the population growth. Since forest is so vital for the sustenance of the ecosystem to which we belong, it is becoming increasingly important to make predictions about the state of forest in the future under different scenarios to suggest appropriate policy meas- ures. Even though significant progress has been made in global change research in recent years, the lack of a reli- able spatial dataset on deforestation continues to be a major obstacle for modelling global change [6]. However, it is still possible to analyse the trends of global envi- ronment, including deforestation with the existing satel- lite data. Iran’s forests are very important, not only to Iran but also to the whole region, due to the capability of sup- porting biodiversity and ameliorating global climate. Infrastructure development, new settlement, fuelwood and timber extraction, fodder and grazing are the main causes for the rapid deterioration of physical environ- ment and natural resource base in Iran. These factors have been generally cited as the causes of land cover change and deforestation in Zagros mountains where, the most of the forests of Iran are situated [7]. For these rea- sons, there is an urgent need for adequate information from which appropriate resource management strategy and interventions could be derived. The use of satellite remote sensing in conjunction with Geographic Informa- tion Syste m (GIS) en ables su ch ch anges to be monito red , mapped and analyzed in a timely and cost effective manner. Therefor e, a study has been carried out focusing on strategies by mapping the past and present conditions and extent of Zagros highlands forests using temporal Landsat TM and ASTER data of 1990, 1998 and 2006 and GIS technology. 2. Study Area The study was carried out in Dehdez area that is located in the southern part of Iran and in south-eastern Khuzes- tan province between the 50˚ 12´ 14˝ to 50˚ 33´ 25˝ E and 31˚ 35´ 05˝ to 31˚ 58´ 12˝ N (Figure 1). The area consists of hills and mountains and less of gentle slope. The altitude ranges from 580 to 3000m asl and covers an area of 512 Km2. Mainly three forest types are dominat- ing in the area. They are Amygdalus scoparia forest, Quercus persica forest and Pistacia attlantica forest. Quercus sp (Quercus persica) forest is pioneer and dominant forest species of this [8]. The area is covered by forest, shrub land, agriculture, settlements, villages, riverbeds and water body. On the basis of literature, there are different soils in the study area. Three main order of soil can be seen in the area, co nsist of Mollisols, En tisols, Inseptisol and Alfisols [9]. Different lithology in parent material on mountains and hills are seen that make a top sequence with different slopes. On the steep slopes, the soils are shallow with high drainage and highly affected by erosion, coarse texture with high gravels. 3. Methodology 3.1. Image Pre-Processing Two clear, cloud-free Landsat and one ASTER images were selected to classify the study area: June 17, 1990; May 18, 1998 and June 21, 2006. The Dehdez area is entirely contained within Landsat and ASTER path 164, row 38. All images were rectified to UTM zone 39, WGS84 using at least 25 well distributed ground control points and nearest neighbor resampling. The root mean square errors were less than 0.25 pixel (7.5 m) for each  A. A. TORAHI ET AL. Copyright © 2011 SciRes. JGIS 3 Figure 1. Location map of Dehdez in Khuzestan province, Iran. of the three images. Image processing was performed using ENVI 4.3. Land-use/cover mapping is achieved through interpretation of Landsat TM satellite images of 1990, 1998 and TERRA-ASTER image of 2006. Nu- merous researchers, including [10-14] have demonstrated the value of multi-temporal imagery for classification of land cover. 3.2. Image Classification 3.2.1. Training Classification scheme was based on the land cover and land use classification system developed by [15] for in- terpretation of remote sensor data at various scales and resolutions. Based on the Anderson land-use/cover clas- sification system, the land-use and land-covers are clas- sified as forest land, rangeland, water bodies, agricultural land and residential land. The unsupervised image classi- fication method carried out prior to field v isit, in order to determine strata for ground truth. Fieldwork carried out to collect data for training and validating land-use/cover interpretation from satellite image of 2006, and for qua- litative description of the characteristics of each land- use/cover class. Also, it is necessary to collect other an- cillary data and historical data required for classification of 1990 and 1998 images. In order to create a testing sample set, first of all a set of testing points is selected randomly. However, reaching all those random points in practice is infeasible because study area is a very com- plex with very steep slope, and very difficult to access, especially areas which are very far from the road/path. So, a modification is made in the field, whereby 95 ran- domly points used and all cover classes, which were mapped in the vicinity o f these points were checked. For classification of images of 1990 and 1998 simple rando m sampling is applied [16]. The land-use maps of the ac-  A. A. TORAHI ET AL. Copyright © 2011 SciRes. JGIS 4 cordant years used as data source for ground truth, which were made based on the field surveys by technical staff of Natural Resources Research Center (NRRC) in Khu- zestan province. 3.2.2. All ocation The image classification is carried out in ENVI software. A supervised classification technique with Maximum Likelihood Algorithm was applied. The classification was based on 48 training samples for the image of 2006, and 42 samples for the images of 1990 and 1998. The land-use/cover maps of 1990, 1998 and 2006 were pro- duced by using supervised image classification technique based on the Maximum Likelihood Classifier (MLC) and 132 training samples [17]. Finally, a 3*3 majority filter was applied to each classification to recode isolated pix- els classified differently than the majority class of the window. 3.2.3. Testing An independent sample of an average of 95 polygons, with about 100 pixels for each selected polygon, was randomly selected from each classification to assess clas- sification accuracies. Error matrices as cr os s - ta b u la t io n s o f the mapped class vs. the reference class were used to assess classification accuracy [18]. Overall accuracy, user’s and producer’s accuracies, and the Kappa statistic were then derived from the error matrices. The Kappa statistic incorporates the off diagonal elements of the error matrices (i.e., classification errors) and represents agreement obtained after removing the proportion of agreement that could be expected to occur by chance. 3.3. Change Detection Following the classification of imagery from the individ- ual years, a multi-date post-classification comparison change detection algorithm was used to determine changes in land cover in three intervals, 1990-1998, 1998-2006 and 1990-2006. This is perhaps the most common approach to change detection [19] and has been successfully used by [20] to monitor land use changes in the Atlanta, Georgia area. The post-classification approach provides “from-to” change information and the kind of landscape transforma- tions that have occurred can be easily calculated and mapped. A change detection map with 25 combinations of ‘‘from-to’’ change information was derived for each of the four seven-class maps. 3.4. Change Detection Accuracy Assessment Change detection presents unique problems for accuracy assessment since it is difficult to sample areas that will change in the future before they change [18]. A concern in change detection analysis is that both position and attribute errors can propagate throug h the multiple dates. This is especially true when more than two dates are used in the analysis. The simplest method of accuracy assessment of change maps is to multiply the individual classification map accuracies to estimate the expected accuracy of the change map [21]. A more rigorous ap- proach is to randomly sample areas classified as change and no-change and determine whether they were cor- rectly classified [22]. We took this approach to evaluate the change maps for the 1990 to 2006 interval. Sample size was determined using the standard formula, N =Z2 * P * (1 - P) / E2, where Z = Z value (e.g., 1.96 for 95% confidence level), P = expected accuracy, and E = al- lowable error. For 50% accuracy, 95% confidence level, and 5% margin of error, a sample of 384 pixels was ran- domly selected from each class. Pixels on the boundaries of change areas (i.e., mixed pixels) were excluded, leav- ing 305 samples of change and 324 of no-change. Each sample point was compared to the reference data from Natural Resources Research Center (NRRC) of Khuzestan province land use maps to determine whether the Landsat and ASTER classified change had actually occurred. This method required intensive visual analysis because of the different formats and spatial characteris- tics of the several sources of reference maps. Neverthe- less, it provided additional information to evaluate the accuracy of the Landsat and ASTER change detection. 4. Results and Discussion 4.1. Classification and Change Maps and Statistics Classification maps were generated for all three years (Figure 2) and the individual class area and change sta- tistics for the three years are summarized in Table 1. About 67%, 48.8% and 38.5% of the total area was under forest cover in 1990, 1998 and 2006, respectively. The rangeland covers about 30.8%, 36.7% and 45% of the total geographical area of the Dehdez in 1990, 1998 and 2006, respectively. About 1.2%, 4.9% and 7% area was under agricultural practices in 1990, 1998 and 2006, re- spectively. The surface water body covers about 0.6%, 4% and 1.8% of the total area of the region in 1990, 1998 and 2006, respectively. About 0.3%, 5% and 7.5% area was under settlement in 1990, 1998 and 2006, respec- tively. Spatial distribution pattern reveals that the area was dominated by dense forest and rich rangeland at the ridge tops, open forest in the middle, and poor rangeland and agriculture in the valley areas. Based on the forest de nsity , there were three types of forest viz., dense forest,  A. A. TORAHI ET AL. Copyright © 2011 SciRes. JGIS 5 Table 1. Summary of landsat and ASTER classification area statistics for 1990, 1998 and 2006. Land cover class 1990 1998 2006 Area (ha) % Area (ha) % Area (ha) % Forest 34407.0 67.0 25072.0 48.8 19764.1 38.5 Rangeland 15814.1 30.8 18839.2 36.7 23112.2 45.0 Agriculture 580.1 1.2 2536.3 4.9 3618.1 7.0 Water 327.1 0.6 2094.1 4.0 924.0 1.8 Settlement 184.3 0.3 2771.0 5.0 3894.1 7.5 open forest and degraded forest in Dehdez region (Fig- ure 3). The area was dominated by 35.9%, 28.9% and 29.3% dense forest, 42.2%, 46.4% and 43.2% open for- est and 21.9%, 24.8% and 27.5% degraded forest in 1990, 1998 and 2006, resp ectively (Table 2). The northern and eastern parts of the Dehdez region were dominated by dense forest. The Open forests were located mainly in western part and some places in southern part, and de- graded forests were located in southern part and some places in western part of the Dehdez region, where the forest is more closed to the villages. From 1990 to 2006, settlement increased approximately 3710 ha (7.2%), ag- riculture increased 3038 ha (5.8%), water bodies in- crease597 ha (1.2%) and rangeland increased 7298 ha (14.2%), while forest decreased 14643 ha (28.5%). Al- though the extent of water bodies and wetlands may change from year to year due to varying precipitation and temperature, the variation in wetland area is also likely Figure 2. Land-use/cover classification maps for Dehdez area: (1) 1990, (2) 1998, and (3) 2006 and comparison of respective exten ts of land-use/cover classes by percentage of study area.  A. A. TORAHI ET AL. Copyright © 2011 SciRes. JGIS 6 Table 2. Summary of forest classification area statistics for 1990, 1998 and 2006. Forest class 1990 1998 2006 Area (ha) % Area (ha) % Area (ha) % Dense forest1 12350 35.9 7235 28.9 5790 29.3 Open forest2 14526 42.2 11630 46.4 8545 43.2 Degraded forest3 7531 21.9 6206 24.8 5429 27.5 canopy c o ver > 40% of land; 2 canopy co v er 10-40% of land; 3 cano py cover < 10% o f l and Figure 3. Forest cover classification maps in Dehdez area: (1) 1990, (2) 1998, and (3) 2006 and comparison of respective ex- tents of forest types by percentage in the area. due to classi-fication errors Tabl e 4. However, the small fluctuations in water are believed to be related to varying lake levels given the high classification accuracy for wa- ter. To further evaluate the results of land cover conver- sions, matrices of lan d cover changes from 1990 to 1998, 1998 to 2006, and 1990 to 2006 were created (Table 3). In the table, unchanged pixels are located along the ma- jor diagonal of the matrix. Conversion values were sorted by area and listed in descending order. Changes were greater in extent over the span of 16 years in the land under different categories. During 1990-1998, about  A. A. TORAHI ET AL. Copyright © 2011 SciRes. JGIS 7 8097.9 ha, 1 672.8 ha, 1275 .2 ha and 1638.8 ha of forest- lands were converted to rangeland, agriculture, surface water body and settlement, respectively. In the period 1998-2006, about 6390.6 ha, 3134.6 ha, 330.4 ha and 2979.5 ha of forest areas were converted to rangeland, agriculture, water body and settlement, respectively. During 16 years span period (1990-2006) about 10170.3 ha, 2963.4 ha, 351.7 ha and 3039.2 ha of forest lands were converted to rangeland, agriculture, water body and settlement. These results indicate that decreases in forest areas mainly came from conversion of forest land to ag- riculture, rangeland and settlement uses during the six- teen-year period, 1990-2006 (Table 3(c)). Table 3(c) shows that 351.7 ha of forests were con- verted to water between 1990 and 2006. These changes may seem to be classification errors, but conversion of forest to surface water bodies and wetlands is because of overflow of the rivers and flood happening in some places of the area. Roads were generally classified as settlement, but when tree canopies along the roads grow and expand, the associated pixels may be classified as forest. We note that the changes from settlement to forest occurred almost entirely near roads. Classification errors may also cause other unusual changes. For example, between 1998 and 2006, 927.4 ha, 1301.3 ha, 139.9 ha and 89.9 ha of settle- ment changed to forest, rangeland, agriculture Table 3. Matrices of land cover and changes (ha) from 1990 to 2006. (a) 1990-1998 1998 1990 1998 Total Forest Rangeland Agriculture water Settlement Forest 23837 3111.6 224.2 2.5 37.8 27213.1 Rangeland 8097.9 11622 48.02 29.1 9.6 19806.62 Agriculture 1672.8 636.8 142.4 9.1 37 2498.1 Water 1275.2 481.5 31.2 185.9 21.09 1994.89 Settlement 1638.8 983.1 19.3 2.8 51.4 2695.4 1990 Total 36521.7 16835 465.12 229.4 156.89 35838.7 (b) 1998-2006 2006 1998 2006 Total Forest Rangeland Agriculture water Settlement Forest 18001 4390.8 837.7 73.58 927.36 24230.44 Rangeland 6390.6 15632.5 918.4 423.76 1301.3 24666.56 Agriculture 3134.6 435.7 488.7 958.26 139.9 5157.16 Water 330.4 42.6 24.2 463.9 89.9 951 Settlement 2979.5 1512.0 281.4 147.3 315.6 5235.8 1998 Total 30836.1 22013.6 2550.4 2066.8 2774.06 34901.7 (c) 1990-2006 2006 1990 2006 Total Forest Rangeland Agriculture water Settlement Forest 19708.7 1738.4 122.6 1.0 10.01 24421.51 Rangeland 10170.3 14049 27.7 4.4 35.11 24642.51 Agriculture 2963.4 383.7 228.9 11.1 1.7 3588.8 Water 351.7 32.9 11.1 183.5 4.1 231.6 Settlement 3039.2 890.1 106.02 27.6 90.5 4153.42 1990 Total 36233.3 17094.1 3693.12 227.6 141.42 34260.6  A. A. TORAHI ET AL. Copyright © 2011 SciRes. JGIS 8 and water, respectively. These changes are most likely associated with omission and commission errors in the Landsat classifications change map. Registration errors and edge effects can also cause apparent errors in the determ i na t ion of chang e vs . no-change. 4.2. Classification and Change Detection Accuracy Error matrices were used to assess classification accu- racy and are summarized for all three years in Table 4. The overall accuracies for 1990, 1998, and 2006 were, respectively, 89.37%, 75.24%, and 71.14%, with Kappa statistics of 78.71%, 55.61%, and 51.41%. User’s and producer’s accuracies of individual classes were consis- tently high. Multiplying the individual classification ac- curacies from Table 4 gives expected overall change detection accuracies of 67.3% for 1990-1998, 53.5% for 1998-2006, and 63.6% for 1990-2006. The change detec- tion accuracy was also evaluated by the method de- scribed in Subsection 3.4 in which 629 random samples classified as no-change or changed between 1990 and 2006 were evaluated and a change detection error matrix was derived (Table 5). The overall accuracy of change detection was 80.1%, with Kappa of 60%. 4.3. Analysis of Change Patterns The above change statistics shed little light on the ques- tion of where land use changes are occurring. However, by constructing a change detection map Figure 4, the advantages of satellite remote sensing in spatially disag- gregating the ch ange statistics can be more fully ap preci- ated. It shows a map of the major land cover typesand the conversion from forest to another uses. Forest and rangelands representing 82.5% of the total area, are the two major land cover types in Dehdez. Conversions in- volving these two classes also represent the most sig- nificant changes. Forest conversion to rangeland and agriculture and the loss of forest resources are the most important conversions in this area. Forest cover has been shrinking rapidly, especially in lower parts. About 16524.6 ha of forests are actively affected by humans during 16 years period (1990-2006). In other words, al- most 1032.78 ha forests lost each year. However, much more than this area is subject of human onslaughts that includes collection of fodder, firewood, non-timber ma- terial, burning, grazing and hunting. The main causes of deforestation are expansion of rangeland, agriculture and settlement, excessive commercial use of timber, fuel- wood and cattle grazing. The conversion of forest to rangeland, agriculture and settlement is due to cutting of the trees up to steep slops and river valleys by the local people and they use to graze their livestock, farm and settle in those areas, especially nearby the villages. No- madic herding is a common practice in this area. Usually many herds of sheep and goats used to keep at the high altitude during the summer and bring down in the winter. This migration comes to be important problem in the region due to increasing the demolition of the forest. Firewood is the common and mostly used source of household energy. The demand for firewood is increas- ing with the rapid inflow of tourists in the region. Forest is the source of different purposes including timber, fod- der, fuel-wood, saplings, medicinal herbs, wild fruits, wild vegetables, leaf/litter and thatch in the area. Among them collection of timber, fodder and fuelwood are very common. Basically, the use depends on the species types and distance from the settlement. In the lower elevation, Amygdalus scoparia is the dominant species. This species is confined in the lower part of the Deh- dez region. The local people accept Amygdalus as one of the best species for the firewood and charcoal pro- duction. Quercus persica and Pistacia mutica are the common species up to 1500 m asl. These species highly used as timber for the house construction, Table 4. Summary of landsat and ASTER classification accuracies (%) for 1990, 1998 and 2006. Land cover class 1990 1998 2006 Producer’s User’s Producer’s User’s Producer’s User’s Forest 88.10 96.80 71.17 94.68 65.18 94.37 Rangeland 92.41 82.06 86.35 65.32 86.79 75.28 Agriculture 86.30 66.19 67.78 41.40 66.67 15.89 Water 100.00 100.0 78.00 45.61 77.00 54.23 Settlement 100.00 86.96 100.00 65.11 70.00 55.22 Overall accuracy 89.37 75.24 71.14 Kappa statistics 78.71 55.61 51.41  A. A. TORAHI ET AL. Copyright © 2011 SciRes. JGIS 9 Table 5. Change detection error matrix for 1990-2006. Reference class Classification Producer’s accuracy (%) Change No-change Change 199 19 91.3 No-change 106 305 74.2 User’s accuracy (%) 65.2 94.1 Overall accuracy: 80.1% Kappa statistics: 60% Figure 4. Land-use/cover change in Dehdez from: (1) 1990-1998; (2) 1998-2006, and (3) 1990-2006. firewood and other household purposes. In summary, information from satellite remote sensing can play a sig- nificant role in quantifying and understanding the nature of changes in land cover and where they are occurring. Such information is essential for natural resources managers to managing the area and policy makers in the formulation of forest resources management strategies. 5. Summary The results demonstrate that Landsat and ASTER classi- fications can be used to produce accurate landscape change maps and statistics. General patterns and trends of land-use/cover change in the Zagros highlands were evaluated by: (1) classifying the amount of land in Deh- dez area that was converted from forest to rangeland, agriculture, water and settlement use during three periods from 1990 to 2006; (2) quantitatively assessing the ac- curacy of change detection maps. In addition to the gen- eration of information tied to geographic coordinates (i.e., maps), statistics quantifying the magnitude of change, and ‘‘from–to’’ information can be readily derived from  A. A. TORAHI ET AL. Copyright © 2011 SciRes. JGIS 10 the classifications. The results quantify the land cover change patterns in Dehdez area and demonstrate the po- tential of multitemporal Landsat and ASTER data to provide an accurate, economical means to map and ana- lyze changes in land cover over time that can be used as inputs to land management and policy decisions. The use of multi-temporal Landsat TM and ASTER data in con- junction with GIS provides an opportunity for environ- mental monitoring, surveying and change detection, which can help in monitoring deforestation and save considerable efforts, time and cost compared with tradi- tional surveying and mapping methods. The integrated land-use/cover maps have shown not only the temporal changes that occur in the forest cover but also in the oth- er land covers between 16 years period. The forest cover digital maps based on satellite remote sensing data and GIS techniques can supplement existing conventional ground based sources of information for monitoring changes in the forests cover on a regular basis, which can be helpful for forest resource management and future planning for the development of the areas. 6. Acknowledgements The satellite data have been made available by the Iran Space Agency. The authors wish to thank the “Division of Natural Resource Management” (DNRM) for provid- ing them with the forest inventory GIS d ata and the “Na- tional Geographic Institute” (NGI) for the Topography data used for the field survey. The authors thank also the reviewers for their constructive comments and remarks. 7. References [1] M. N. Siddiqui, S. Maajid, Z. Jamil and J. Afser, “Inte- grated Applications of Remote Sensing and GIS for Mapping and Monitoring Changes in Forest Cover,” Proceedings of the International Seminar on Natural Hazard Monitoring, Karachi, Pakistan, 2002, pp. 429- 435. doi:10.1016/j.foreco.2003.07.035 [2] FAO, “Global Forest Resources Assessment 2000” FAO Forestry Paper 140, Food and Agriculture Organization of the United Nations, Rome, 2001. [3] C. de Wasseige and P. Defourny, “Remote Sensing of Selective Logging Impact for Tropical Forest Manage- ment,” Forest Ecology and Management, Vol. 188, No. 1-3, 2004, pp. 161-173. doi:10.1016/j.foreco.2003.07.035 [4] G. M. Foody, “Remote Sensing of Tropical Forest Envi- ronments: Towards the Monitoring of Environmental Resources for Sustainable Development,” International Journal of Remote Sensing, Vol. 24, No. 20, 2003, pp. 4035-4046. doi:10.1080/0143116031000103853 [5] S. A. Sader, D. J. Hayes, J. A. Hepinstall, M. Coan and C. Soza, C, “Forest Change Monitoring of A Remote Bio- sphere Reserve,” International Journal of Remote Sens- ing, Vol. 22, No. 10, 2001, pp. 1937-1950. [6] S. S. Murai, “Development of Global Eco-Engineering Using Remote Sensing and Geographic Information Sys- tems,” Proceeding of 8th Toyota Conference, 1995. [7] M. Fattahi, “Investigation of Zagros Natural Resources and the Important Factors of Demolition,” Institute of Forests and Range Lands Researches Press, 1995. [8] M. Fattahi, “Management of Zagros Forests,” Institute of Forests and Range Lands Researches Press, 2002. [9] E. Etezadi, “The Complete Studies of Khuzestan Prov- ince, Section of Geological Study,” Planning and Man- agement Organzation of Khuzestn Province Press, 1996. [10] T. M. Lillesand, J. W. Chipman, D. E. Nagel, H. M. Reese, M. R. Bobo and R. A. Goldmann, “Upper Mid- west Gap Analysis Program Image Processing Protocol,” U.S. Geological Survey, Environmental Management Technical Center,Onalaska, Wisconsin, 1988, p. 25. [11] R. S. Lunetta and M. Balogh, “Apication of Multi-Tem- poral Landsat 5 TM Imagery for Wetland Identification,” Photogrammetric Engineering and Remote Sensing, Vol. 65, No. 11, 1999, pp. 1303-1310. [12] D. R. Oettera, W. B. Cohenb, M. Berterretchea, T. K. Maierspergera and R. E. Kennedy, “Land Cover Mapping in An Agricultural Setting Using Multiseasonal Thematic Mapper Data,” Remote Sensing of Environment, Vol. 76, 2000, pp. 139-155. doi:10.1016/S0034-4257(00)00202-9 [13] P. T. Wolter, D. J. Mladenoff, G. E. Host and T. R. Crow, “Improved Forest Classification in the Northern Lake States Using Multi-Temporal Landsat Imagery,” Photo- grammetric Engineering and Remote Sensing, Vol. 61, No. 9, 1995, pp. 1129-1143. [14] F. Yuan, M. E. Bauer, N. J. Heinert and G. Holden, “Multi-Level Land Cover Mapping of the Twin Cities (Minnesota) Metropolitan Area with Multi-Seasonal Landsat TM/ETM+Data,” Geocarto International, Vol. 20, No. 2, 2005, pp. 5-14. doi:10.1080/10106040508542340 [15] A. Anderson, “Land Use and Land Cover Classification System,” Geological Survey Professional Paper 964, Washington, D. C., 1976. [16] J. R. Jensen, “Introductory digital image processing,” New Jersay: Trentice Hall, 1996. [17] J. A. Richards, “Remote Sensing Digital Image Analysis, an Introduction,” Second Edition, Springer-Velarg, 1993. [18] R. G. Congalton and K. Green, “Assessing the Accuracy of Remotely Sensed Data: Principles and Practicesboca Rotan,” Lewis Publishers, Florida, 1999. [19] J. R. Jensen, “Digital Change Detection. Introductory Digital Image Processing: A Remote Sensing Perspective,” Prentice-Hall, New Jersey, 2004. [20] X. Yang, “Satellite Monitoring of Urban Spatial Growth in the Atlanta Metropolitan Area,” Photogrammetric En- gineering and Remote Sensing, Vol. 68, No. 7, 2002, pp. 725-734. [21] D. Yuan, C. D. Elvidge and R. S. Lunetta, “Survey of  A. A. TORAHI ET AL. Copyright © 2011 SciRes. JGIS 11 Multispectral Methods for Land Cover Change Analysis. Remote Sensing Change Detection: Environmental Moni- Toring Methods and Applications,” Michigan’ Ann Arbor Press, 1998. [22] R. M. Fuller, G. M. Smith, and B. J. Devereux, “The Characterization and Measurement of Land Cover Chang e through Remote Sensing: Problems in Operational Ap- plications,” International Journal of Applied Earth Ob- servation and Geoinformation, Vol. 4, No. 3, 2003, pp. 243-253. doi:10.1016/S0303-2434(03)00004-7 |