 Advances in Bioscience and Biotechnology, 2013, 4, 6-14 ABB http://dx.doi.org/10.4236/abb.2013.410A3002 Published Online October 2013 (http://www.scirp.org/journal/abb/) Reference gene selection for quantitative PCR studies in bovine neutrophils William R. Vorachek1, Gerd Bobe2, Jean A. Hall1 1Department of Biomedical Sciences, College of Veterinary Medicine, Oregon State University, Corvallis, USA 2Department of Animal and Rangeland Sciences, College of Agricultural Sciences, Linus Pauling Institute, Oregon State University, Corvallis, USA Email: Jean.Hall@oregonstate.edu Received 30 June 2013; revised 31 July 2013; accepted 2 August 2013 Copyright © 2013 William R. Vorachek et al. This is an open access article distributed under the Creative Commons Attribution Li- cense, which permits unrestricted use, distribution, and reproduction in any medium, provided the original work is properly cited. ABSTRACT Reference genes are essential for studying mRNA ex- pression with quantitative PCR (qPCR). We investi- gated 11 candidate whole-blood neutrophil reference genes (ACTB, B2M, G6PD, GAPDH, GYPC, HPRT, PGK1, RPL19, SDHA, TFRC, and YWHAZ) for beef calves, both males and females, with or without sele- nium supplementation. Initial screening was based on gene expression level (<28 Cq cycles), variability (SD < 1.5 Cq cycles), excluded GYPC and TFRC from further analysis. Expression stability of the remaining genes was evaluated using four software programs: geNorm, NormFinder, BestKeeper, and the compara- tive delta Cq method. The neutrophil reference genes, YWHAZ, PGK1, and RPL19, consistently ranked among the top four most stable genes under these ex- perimental conditions. The commonly used reference genes, ACTB and HPRT, were not reliable, under- scoring the need to validate neutrophil reference genes under different experimental conditions. Multiple re- ference genes rather than a single gene may provide more robust and reliable results. The best pair of re- ference genes in whole-blood neutrophils from beef calves overall was PGK1|YWHAZ. Keywords: Blood Neutrophils; Bos taurus; qPCR; Reference Genes; Selenium Treatment 1. INTRODUCTION Quantitative PCR (qPCR) is one of the most common techniques used for evaluating gene expression [1]. To adjust for differences in total RNA concentrations, data are normalized against RNA levels of internal control genes, also called reference genes or housekeeping genes. Reference genes are assumed to be constitutively ex- pressed in the tissue or cell type of interest at concentra- tions similar to genes of interest; however, their RNA levels may vary depending on tissue or cell type ana- lyzed as well as experimental conditions [2-5]. Therefore, it is essential to evaluate reference genes in the same type of tissue and under similar experimental conditions before using them to adjust RNA levels for genes of in- terest. Our interest is in studying the effects of supranutri- tional selenium (Se) supplementation on immune func- tion in ruminants. We previously reported in sheep that supranutritional Se-yeast supplementation alters whole- blood (WB) neutrophil gene expression profiles [6]. Neutrophils are the most numerous and important cellu- lar component of innate immunity. They serve as the body’s first line of defense against invading microorgan- isms. Neutrophils use two general mechanisms to kill mi- croorganisms: extracellular killing via neutrophil extra- cellular traps [7-9], or intracellular killing via phagocy- tosis followed by the secretion of antimicrobial proteins, proteolytic enzymes, and reactive oxygen species when membrane-bound granules fuse with phagocytic vesicles. We and others have reported on potential reference genes in human [10,11] and ovine neutrophils [12,13]. In one study with human neutrophils, suitable reference genes included a TATA box binding protein (TBP), beta-actin (ACTB), and succinate dehydrogenase complex subunit A (SDHA) [11]. In another human study, guanine nu- cleotide binding protein, ß-peptide 2-like1 (GNB2L1), hypoxanthine phosphoribosyl-transferase 1 (HPRT), ri- bosomal protein L32 (RPL32), ACTB, and beta-2-micro- globulin (B2M) were suggested as suitable reference genes in gene expression studies of neutrophils [10]. In sheep neutrophils, we found that SDHA and glucose-6- phosphate dehydrogenase (G6PD) in healthy sheep, and glyceraldehyde-3-phosphate dehydrogenase (GAPDH) OPEN ACCESS  W. R. Vorachek et al. / Advances in Bioscience and Biotechnology 4 (2013) 6-14 7 and tyrosine 3-monoxygenase/tryptophan 5-monooxy- genase activation protein zeta polypeptide (YWHAZ) in foot rot diseased sheep were the best pairs of references genes [13]. In ovine whole blood, SDHA and YWHAZ were considered the most suitable reference genes as they were stably expressed regardless of disease status [12]. In the bovine, potential reference genes have been evalu- ated in polymorphonuclear leukocytes [14], mammary epi- thelial cells [15], adipose tissue [16], milk somatic cells [17], and WB-cells [18] of lactating dairy cows, and in muscular tissue [19]; however, to our knowledge, poten- tial reference genes have not been evaluated in WB-neu- trophils under conditions of Se supplementation in grow- ing beef calves. Therefore, we investigated 11 potential neutrophil ref- erence genes (Tabl e 1) including: ACTB, B2M, G6PD, GAPDH, glycophorin C (GYPC), HPRT, phosphogly- cerate kinase 1 (PGK1), ribosomal protein L19 (RPL19), SDHA, transferrin receptor (TFRC), and YWHAZ. We assessed gene expression levels, and analyzed gene ex- pression stability using the programs geNorm [20], Norm Finder [21], BestKeeper [22], and a comparative delta Cq method [23], in WB neutrophils from beef calves, males and females, with or without Se supplementation, and in both treatment groups combined. 2. MATERIALS AND METHODS 2.1. Candidate Genes for Expression Studies Eleven genes were selected from commonly used refer- ence genes [11]: ACTB, B2M, G6PD, GAPDH, GYPC, HPRT, PGK1, RPL19, SDHA, TFRC, and YWHAZ. The length of the primers ranged from 18-bp to 27-bp, GC content varied from 45% to 60%, and the expected PCR product size was 71-bp to 126-bp (Table 2). Table 2 sum- marizes primer information including R2 and efficiency of qPCR analysis. The Minimum Information for Publi- cation of Quantitative Real-Time PCR Experiments gui- delines (MIQE) were followed for sample handling and analysis [24] and a checklist is available in the supple- mentary file. Reference genes were selected based upon a literature review to find genes that covered a wide variety of func- tions and pathways: ACTB, GAPDH, and B2M [19]; HPRT, SDHA, and YWHAZ [14], RPL19 [25], and four commonly used ovine neutrophil reference genes (G6PD, TFRC, PGK1, and GYPC) [12,13]. All primers were synthesized by Sigma Aldrich (St. Louis, MO) and puri- fied by desalting. To verify that these primers were bo- vine specific, each primer pair was used to amplify bo- vine cDNA (AccuPrime Taq; Applied Biosystems, Foster Table 1. Candidate reference genes evaluated in this study. Gene symbol Gene name Function Accession number* Gene synonyms ACTB Beta-actin Cytoskeletal structural protein NM_173979.3 Actin cytoplasmic 1; beta-actin B2M Beta-2-microglobin Beta-chain of class I major histocompatibility complex molecules NM_173893.3 G6PD Glucose-6-phosphate dehydrogenase Enzyme in carbohydrate metabolism NM_001244135.1 GAPDH Glyceraldehyde-3-phosphate dehydrogenase Enzyme in carbohydrate metabolism NM_001034034.2 GAPD; G3PDH GYPC Glycophorin C Integral RBC membrane binding protein NM_001002886.1 BOS_1916; CD236; D236R HPRT Hypoxanthine phosphoribosyl-transferase 1 Phosphoribosyl-transferase (PRT)-type I domain NM_001034035.2 HPRT1 PGK1 Phosphoglycerate kinase I Catalyzes the transfer of the high-energy phosphate group of 1,3-bisphosphoglycerate to ADP, forming ATP and 3-phosphoglycerate NM_001034299.1 RPL19 Ribosomal protein L19 Found in the large ribosomal subunit NM_001040516.1 SDHA Succinate dehydrogenase complex, subunit A Mitochondrial respiratory chain NM_174178.2 TFRC Transferrin receptor Protease-associated domain containing proteins, like transferrin receptors NM_001206577.1 p90; CD71 YWHAZ Tyrosine 3-monoxygenase/ tryptophan 5-monooxygenase activation protein, zeta polypeptide Signal transduction by binding to phosphoserine containing proteins NM_174814.2 14-3-3 protein zeta/delta; tyrosine 3-monooxygenase *NCBI Reference Sequence database http://www.ncbi.nlm.nih.gov/RefSeq/. Copyright © 2013 SciRes. OPEN ACCESS  W. R. Vorachek et al. / Advances in Bioscience and Biotechnology 4 (2013) 6-14 8 Table 2. Characteristics of the primers of the 11 candidate reference genes used for qPCR analysis. Gene symbol Primer sequences (forward/reverse) Spanned ExonsAmplicon size (bp) R2 PCR Efficiency ACTB AAGGCCAACCGTGAGAAGATGACC TGTCACGCACAATTTCCCGCTC 2nd 3rd 97 0.98 0.94 B2M CTGTCGCTGTCTGGACTGG TTTGGCTTTCCATCTTCTGG 1st 2nd 86 1.00 1.02 G6PD TGACCTATGGCAACCGATACAA CCGCAAAAGACATCCAGGAT 10th 11th 76 1.00 1.03 GAPDH ATGCCTCCTGCACCACCA AGTCCCTCCACGATGCCAA 7th 8th 86 0.99 1.35 GYPC ATCAACATCGCTGTCATTGC CTCGTTGGTGTCCTATGTGC 3rd 4th 117 0.97 1.55 HPRT TTTATTCCTCATGGACTTAATTATGGA CCACCCATCTCCTTCATCAC 4th 5th 71 0.99 1.02 RPL19 AGCCTGTGACTGTCCATTCC ACGTTACCTTCTCGGGCATT 2nd 3rd 126 0.99 1.00 PGK1 ACTCCTTGCAGCCAGTTGCT AGCACAAGCCTTCTCCACTTCT 3rd 4th 101 1.00 0.87 SDHA CATCCACTACATGACGGAGCA ATCTTGCCATCTTCAGTTCTGCTA 4th 5th 90 0.98 1.74 TFRC TTCTGGGCAGACCTCAAATC CAGCTTCACGTGGGACATAA 4th 5th 106 0.91 0.99 YWHAZ TGTAGGAGCCCGTAGGTCATCT TTCTCTCTGTATTCTCGAGCCATCT 2nd 3rd 123 1.00 0.89 City, CA). The following conditions were employed: 94˚C for 2 min; then 35 cycles of 94˚C for 30 s, 60˚C for 30 s, and 68˚C for 30 s. The PCR products were then purified using a QIAquick PCR Purification Kit (Qiagen Sciences, Germantown, MD) according to manufactur- er’s instructions, and quantitated using an ND-1000 Na- noDrop Spectrophotometer (Thermo Fisher Scientific; Waltham, MA). The PCR products were subsequently sequenced at the Oregon State University Center for Ge- nome Research and Biocomputing (Corvallis, OR) using an automated ABI 3100 capillary sequencer (Applied Bi- osystems). The sequences obtained were used in a BLAST search (National Center for Biotechnology In- formation, US National Library of Medicine, Bethesda, MD) to verify that the products were bovine in origin and were amplifying genes of interest. 2.2. Whole- Blood Collection Calves were bled after feeding Se-enriched alfalfa hay for 6 or 7 weeks, as part of a study that has been previ- ously reported [26]. The experimental protocol was re- viewed and approved by the Oregon State University Animal Care and Use Committee. Jugular venous blood was collected into evacuated ethylenediaminetetraacetic acid (EDTA) tubes (10 mL; final EDTA concentration 2 g/L; Becton Dickinson, Franklin Lakes, NJ) and stored on ice until transported to the lab for neutrophil isolation. 2.3. Neutrophil Isolation Neutrophils were isolated within 4 h of collection, using a Percoll (Sigma-Aldrich, St. Louis, MO) gradient tech- nique, then resuspended in 1× Hank’s balanced saline so- lution (HBSS; Life Technologies, Grand Island, NY) plus 0.5% fetal bovine serum (FBS; Life Technologies). Cells were counted using a Coulter counter (Beckman Coulter, Indianapolis, IN) to determine cell concentration. Briefly, 10 mL of anticoagulated blood was transferred into 50- mL tubes (Thermo Fisher Scientific) and centrifuged at 1000 × g in a TJ-6 swinging bucket centrifuge (Beckman Coulter) for 20 min at 22˚C. The plasma, buffy coat, and one third of the RBC pack from each tube were asepti- cally removed. The remaining RBC pack and leukocytes were mixed with 34-mL ice-cold PBS (Life Technologies) and layered onto 10 mL of freshly prepared 1.084 g/mL Percoll. Tubes were centrifuged at 400 × g for 40 min at 22˚C. After centrifugation, RBC and neutrophils pelleted at the bottom of the tube and the mononuclear cell band remained at the sample/medium interface. Neutrophils were isolated after removing the mononu- clear cell band; all layers above the RBC pack were as- pirated and discarded. The RBC were lysed using 24-mL ice-cold hypotonic lysis buffer (10.56 mM Na2HPO4, 2.67 mM NaH2PO4, pH 7.3) for 90 s, and then isotonicity was restored by adding 12-mL ice-cold hypertonic re- store buffer (10.56 mM Na2HPO4, 2.67 mM NaH2PO4, 0.43 M NaCl, pH 7.3) to stop lysis. Neutrophils were pelleted by centrifugation of tubes at 800 × g for 5 min at 22˚C in a TJ-6 centrifuge. The lysis solution was de- canted, and the neutrophils were resuspended and wash- ed twice more with 1× HBSS plus 0.5% FBS. The neu- Copyright © 2013 SciRes. OPEN ACCESS  W. R. Vorachek et al. / Advances in Bioscience and Biotechnology 4 (2013) 6-14 9 trophils were then resuspended in 0.25 mL of 1× HBSS with 0.5% FBS and stored on ice until needed. A 20-µL aliquot of the cell suspension was used to determine cell concentration using a Coulter counter (Beckman). An- other 5-µL aliquot was used to assess purity of neutrophil preparations (differential cell count) by microscopic exa- mination after Wright-Giemsa staining (96% ± 1% neu- trophils; mean ± SEM). The remaining neutrophils were pelleted by centrifugation at 700 × g for 10 min at 4˚C in a TJ-6 swinging bucket rotor (Beckman), supernatant was removed, and cells were frozen at −80˚C. 2.4. RNA Isolation Total RNA was extracted from previously frozen neu- trophils using an RNeasy® Mini Kit (Qiagen Sciences) according to manufacturer’s instructions. Genomic DNA was eliminated with an RNase-Free DNase (Qiagen Sci- ences) digestion. Total isolated RNA was quantified us- ing an ND-1000 NanoDrop Spectrophotometer (Thermo Fisher Scientific). Only samples with A260/A280 ratios be- tween 1.40 and 2.16 were analyzed further. Samples were stored at −80˚C until needed. 2.5. Quantitative PCR Expression level of references genes in neutrophils was determined by qPCR. First-strand cDNA was synthesized from 50 ng of total RNA from each sample using the High Capacity cDNA Reverse Transcription Kit (Applied Biosystems). Subsequent qPCR was conducted using RT2 SYBR Green qPCR Mastermix (Qiagen Sciences) in 96- well MicroAmp® reaction plates (Applied Biosystems) with a final reaction volume of 25 μL. Each well con- tained 12.5 μL of qPCR Mastermix, 1 μL of each primer, 1 μL of cDNA sample, and 9.5 μL of PCR-grade water. Abundance of gene transcripts was determined by abso- lute qPCR using the 7300 Real-time PCR System (Appli- ed Biosystems). A negative control (containing all rea- gents except target DNA) was included to verify the ab- sence of contamination in each qPCR assay. Each reac- tion consisted of the following steps: 10 min initial de- naturation at 95˚C to activate the polymerase; followed by 40 cycles of 15 s denaturation at 95˚C and 1 min an- nealing-elongation at 60˚C. For each primer, PCR effi- ciency and R2 were calculated using a standard curve de- rived from a pooled cDNA mixture serially diluted 4-fold over 4 measuring points, with two replications at each measuring point. 2.6. Statistical Analysis of Neutrophil Gene Expression Stability The Cq values were reported as mean, standard deviation (SD), and range. Expression stability of potential neu- trophil reference genes was evaluated using generally accepted Excel-based software tools [24] according to instructions provided by the program developers, i.e., geNorm [20], NormFinder [21], BestKeeper [22], and a comparative delta Cq method [23]. Ranking of potential neutrophil reference genes was performed for neutrophils collected from calves fed alfalfa hay that was not en- riched with Se (calves consumed 0.95 mg Se/head/day) and calves fed Se-enriched alfalfa hay (calves consumed 18.76 mg Se/head/day). To provide a summary statistic for the four algorithms, the geometric mean of the rank- ing for each of the four algorithms was calculated [27]; the gene with the lowest value was viewed as the most stable reference gene. Normality of gene expression was tested using the Shapiro Wilk statistic in SAS, version 9.2 (SAS, Inc., Cary, NC, USA) software. Group aver- ages of Cq values were compared overall, between male and female calves, between calves fed alfalfa hay that was Se-enriched or not, and between blood samples taken on two different dates (PROC GLM). The R2 and efficiency were calculated as previously described [24]. All tests were two-sided. Statistical significance was declared at P ≤ 0.05. 3. RESULTS AND DISCUSSION 3.1. Expression Level of Neutrophil Reference Genes Evaluated in This Study To identify the most appropriate set of reference genes for gene expression analyses in WB neutrophils of growing beef calves in the context of Se supplementation, a sys- tematic investigation of 11 commonly used reference genes (Table 1) was performed by qPCR experiments. The 11 potential reference genes covered a variety of pathways to avoid bias from co-regulation among them [20]. The observed Cq values were distributed over a wide range in beef calf neutrophils (Table 3), including highly expressed B2M (Cq ± SD, 17.61 ± 0.62; Cq range, 2.62) and less transcribed TFRC (29.83 ± 0.88; Cq range, 3.22) and GYPC (31.52 ± 0.78; Cq range, 2.80). The least va- riation was associated with YWHAZ (22.49 ± 0.35; Cq range, 1.23) and the most variation was associated with ACTB (22.44 ± 1.06; Cq range, 3.85). Three genes did not pass the test for normal distribution at P ≤ 0.01, namely SDHA (Shapiro-Wilk W = 0.87; P = 0.008), B2M (Sha- piro-Wilk W = 0.82; P = 0.001), and HPRT (Shapiro- Wilk W = 0.87; P = 0.007). None of the 11 genes evalu- ated differed significantly by sex of calf or Se supplemen- tation. We arbitrarily selected a gene expression level >28 cycles or high variability (SD > 1.5 cycle) for exclusion of potential reference genes from further consideration. This eliminated GYPC and TFRC from further analysis. Our Copyright © 2013 SciRes. OPEN ACCESS 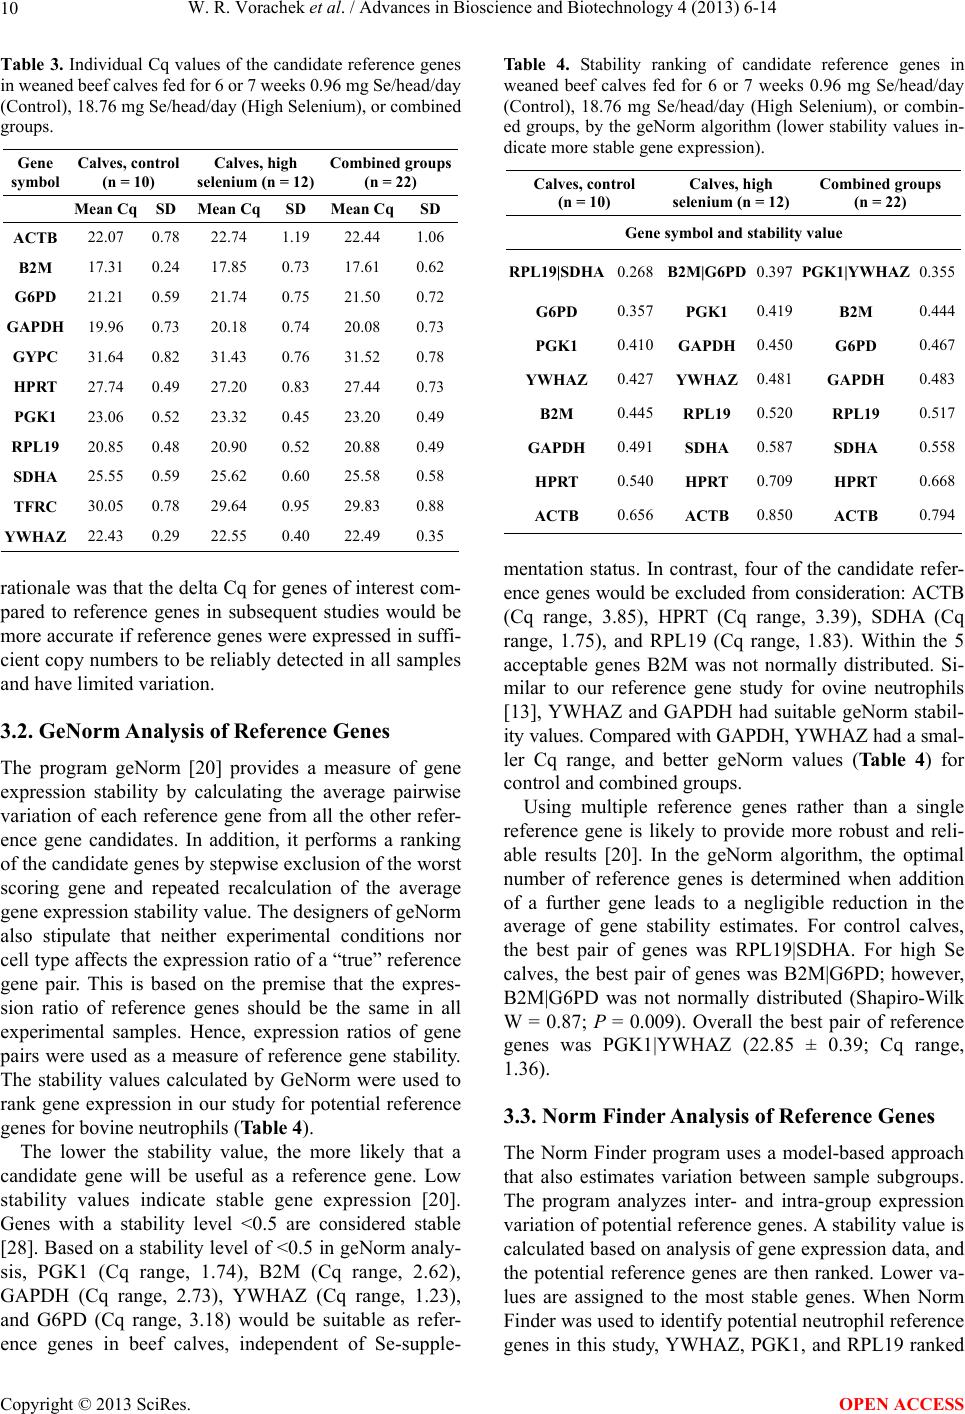 W. R. Vorachek et al. / Advances in Bioscience and Biotechnology 4 (2013) 6-14 10 Table 3. Individual Cq values of the candidate reference genes in weaned beef calves fed for 6 or 7 weeks 0.96 mg Se/head/day (Control), 18.76 mg Se/head/day (High Selenium), or combined groups. Gene symbol Calves, control (n = 10) Calves, high selenium (n = 12) Combined groups (n = 22) Mean Cq SD Mean Cq SD Mean CqSD ACTB 22.07 0.78 22.74 1.19 22.44 1.06 B2M 17.31 0.24 17.85 0.73 17.61 0.62 G6PD 21.21 0.59 21.74 0.75 21.50 0.72 GAPDH 19.96 0.73 20.18 0.74 20.08 0.73 GYPC 31.64 0.82 31.43 0.76 31.52 0.78 HPRT 27.74 0.49 27.20 0.83 27.44 0.73 PGK1 23.06 0.52 23.32 0.45 23.20 0.49 RPL19 20.85 0.48 20.90 0.52 20.88 0.49 SDHA 25.55 0.59 25.62 0.60 25.58 0.58 TFRC 30.05 0.78 29.64 0.95 29.83 0.88 YWHAZ 22.43 0.29 22.55 0.40 22.49 0.35 rationale was that the delta Cq for genes of interest com- pared to reference genes in subsequent studies would be more accurate if reference genes were expressed in suffi- cient copy numbers to be reliably detected in all samples and have limited variation. 3.2. GeNorm Analysis of Reference Genes The program geNorm [20] provides a measure of gene expression stability by calculating the average pairwise variation of each reference gene from all the other refer- ence gene candidates. In addition, it performs a ranking of the candidate genes by stepwise exclusion of the worst scoring gene and repeated recalculation of the average gene expression stability value. The designers of geNorm also stipulate that neither experimental conditions nor cell type affects the expression ratio of a “true” reference gene pair. This is based on the premise that the expres- sion ratio of reference genes should be the same in all experimental samples. Hence, expression ratios of gene pairs were used as a measure of reference gene stability. The stability values calculated by GeNorm were used to rank gene expression in our study for potential reference genes for bovine neutrophils (Table 4). The lower the stability value, the more likely that a candidate gene will be useful as a reference gene. Low stability values indicate stable gene expression [20]. Genes with a stability level <0.5 are considered stable [28]. Based on a stability level of <0.5 in geNorm analy- sis, PGK1 (Cq range, 1.74), B2M (Cq range, 2.62), GAPDH (Cq range, 2.73), YWHAZ (Cq range, 1.23), and G6PD (Cq range, 3.18) would be suitable as refer- ence genes in beef calves, independent of Se-supple- Table 4. Stability ranking of candidate reference genes in weaned beef calves fed for 6 or 7 weeks 0.96 mg Se/head/day (Control), 18.76 mg Se/head/day (High Selenium), or combin- ed groups, by the geNorm algorithm (lower stability values in- dicate more stable gene expression). Calves, control (n = 10) Calves, high selenium (n = 12) Combined groups (n = 22) Gene symbol and stability value RPL19|SDHA 0.268 B2M|G6PD 0.397 PGK1|YWHAZ 0.355 G6PD 0.357 PGK1 0.419 B2M 0.444 PGK1 0.410 GAPDH 0.450 G6PD 0.467 YWHAZ 0.427 YWHAZ 0.481 GAPDH 0.483 B2M 0.445 RPL19 0.520 RPL19 0.517 GAPDH 0.491 SDHA 0.587 SDHA 0.558 HPRT 0.540 HPRT 0.709 HPRT 0.668 ACTB 0.656 ACTB 0.850 ACTB 0.794 mentation status. In contrast, four of the candidate refer- ence genes would be excluded from consideration: ACTB (Cq range, 3.85), HPRT (Cq range, 3.39), SDHA (Cq range, 1.75), and RPL19 (Cq range, 1.83). Within the 5 acceptable genes B2M was not normally distributed. Si- milar to our reference gene study for ovine neutrophils [13], YWHAZ and GAPDH had suitable geNorm stabil- ity values. Compared with GAPDH, YWHAZ had a smal- ler Cq range, and better geNorm values (Table 4) for control and combined groups. Using multiple reference genes rather than a single reference gene is likely to provide more robust and reli- able results [20]. In the geNorm algorithm, the optimal number of reference genes is determined when addition of a further gene leads to a negligible reduction in the average of gene stability estimates. For control calves, the best pair of genes was RPL19|SDHA. For high Se calves, the best pair of genes was B2M|G6PD; however, B2M|G6PD was not normally distributed (Shapiro-Wilk W = 0.87; P = 0.009). Overall the best pair of reference genes was PGK1|YWHAZ (22.85 ± 0.39; Cq range, 1.36). 3.3. Norm Finder Analysis of Reference Genes The Norm Finder program uses a model-based approach that also estimates variation between sample subgroups. The program analyzes inter- and intra-group expression variation of potential reference genes. A stability value is calculated based on analysis of gene expression data, and the potential reference genes are then ranked. Lower va- lues are assigned to the most stable genes. When Norm Finder was used to identify potential neutrophil reference genes in this study, YWHAZ, PGK1, and RPL19 ranked Copyright © 2013 SciRes. OPEN ACCESS 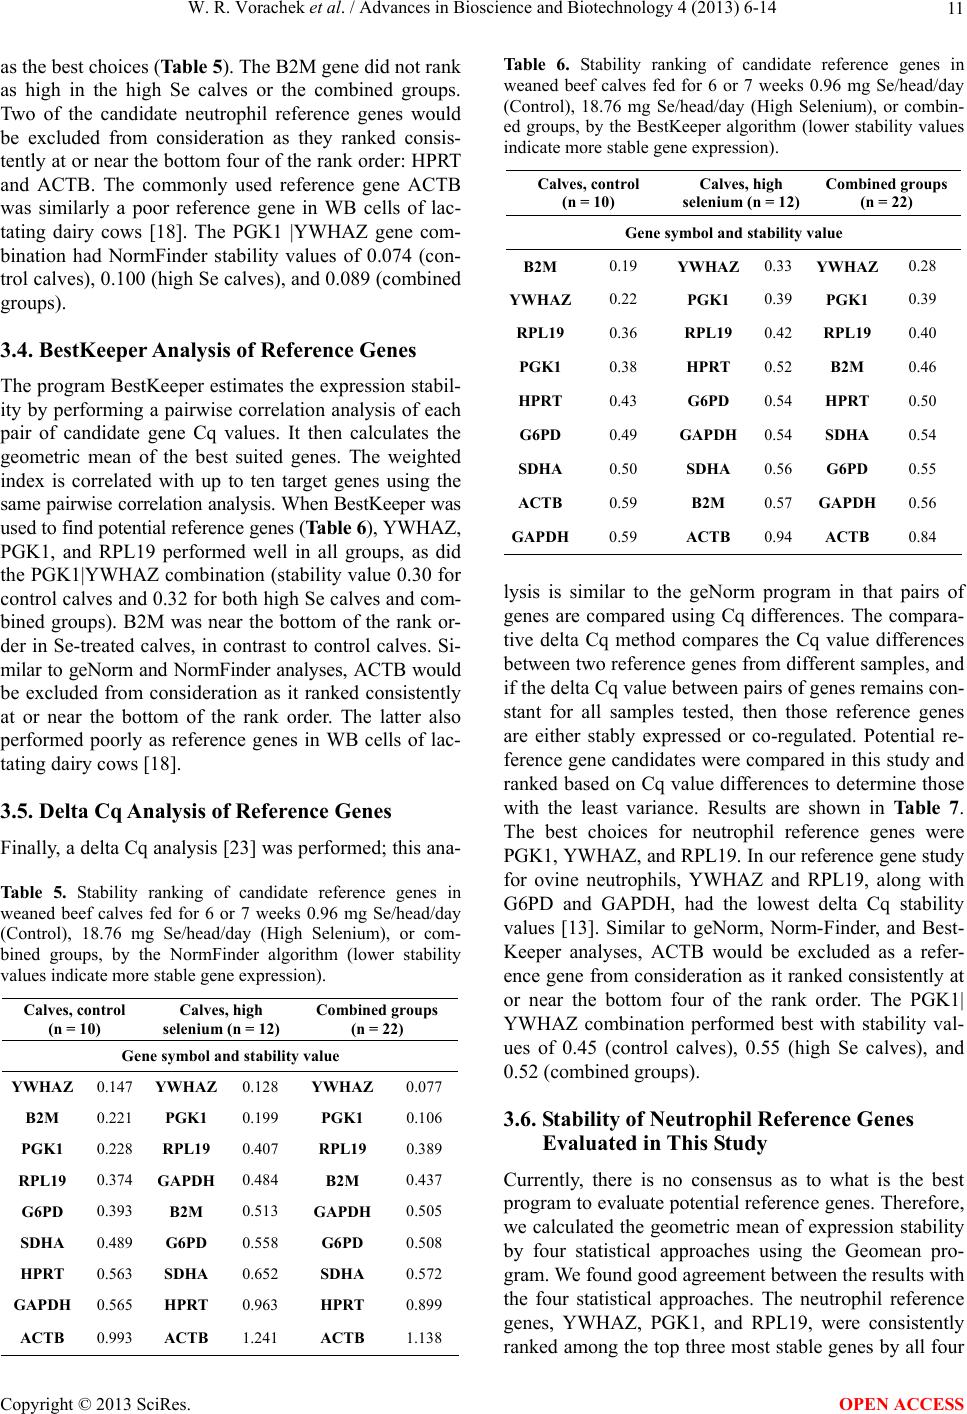 W. R. Vorachek et al. / Advances in Bioscience and Biotechnology 4 (2013) 6-14 11 as the best choices (Table 5). The B2M gene did not rank as high in the high Se calves or the combined groups. Two of the candidate neutrophil reference genes would be excluded from consideration as they ranked consis- tently at or near the bottom four of the rank order: HPRT and ACTB. The commonly used reference gene ACTB was similarly a poor reference gene in WB cells of lac- tating dairy cows [18]. The PGK1 |YWHAZ gene com- bination had NormFinder stability values of 0.074 (con- trol calves), 0.100 (high Se calves), and 0.089 (combined groups). 3.4. BestKeeper Analysis of Reference Genes The program BestKeeper estimates the expression stabil- ity by performing a pairwise correlation analysis of each pair of candidate gene Cq values. It then calculates the geometric mean of the best suited genes. The weighted index is correlated with up to ten target genes using the same pairwise correlation analysis. When BestKeeper was used to find potential reference genes (Table 6), YWHAZ, PGK1, and RPL19 performed well in all groups, as did the PGK1|YWHAZ combination (stability value 0.30 for control calves and 0.32 for both high Se calves and com- bined groups). B2M was near the bottom of the rank or- der in Se-treated calves, in contrast to control calves. Si- milar to geNorm and NormFinder analyses, ACTB would be excluded from consideration as it ranked consistently at or near the bottom of the rank order. The latter also performed poorly as reference genes in WB cells of lac- tating dairy cows [18]. 3.5. Delta Cq Analysis of Reference Genes Finally, a delta Cq analysis [23] was performed; this ana- Table 5. Stability ranking of candidate reference genes in weaned beef calves fed for 6 or 7 weeks 0.96 mg Se/head/day (Control), 18.76 mg Se/head/day (High Selenium), or com- bined groups, by the NormFinder algorithm (lower stability values indicate more stable gene expression). Calves, control (n = 10) Calves, high selenium (n = 12) Combined groups (n = 22) Gene symbol and stability value YWHAZ 0.147 YWHAZ 0.128 YWHAZ 0.077 B2M 0.221 PGK1 0.199 PGK1 0.106 PGK1 0.228 RPL19 0.407 RPL19 0.389 RPL19 0.374 GAPDH 0.484 B2M 0.437 G6PD 0.393 B2M 0.513 GAPDH 0.505 SDHA 0.489 G6PD 0.558 G6PD 0.508 HPRT 0.563 SDHA 0.652 SDHA 0.572 GAPDH 0.565 HPRT 0.963 HPRT 0.899 ACTB 0.993 ACTB 1.241 ACTB 1.138 Table 6. Stability ranking of candidate reference genes in weaned beef calves fed for 6 or 7 weeks 0.96 mg Se/head/day (Control), 18.76 mg Se/head/day (High Selenium), or combin- ed groups, by the BestKeeper algorithm (lower stability values indicate more stable gene expression). Calves, control (n = 10) Calves, high selenium (n = 12) Combined groups (n = 22) Gene symbol and stability value B2M 0.19 YWHAZ 0.33 YWHAZ 0.28 YWHAZ 0.22 PGK1 0.39 PGK1 0.39 RPL19 0.36 RPL19 0.42 RPL19 0.40 PGK1 0.38 HPRT 0.52 B2M 0.46 HPRT 0.43 G6PD 0.54 HPRT 0.50 G6PD 0.49 GAPDH 0.54 SDHA 0.54 SDHA 0.50 SDHA 0.56 G6PD 0.55 ACTB 0.59 B2M 0.57 GAPDH 0.56 GAPDH 0.59 ACTB 0.94 ACTB 0.84 lysis is similar to the geNorm program in that pairs of genes are compared using Cq differences. The compara- tive delta Cq method compares the Cq value differences between two reference genes from different samples, and if the delta Cq value between pairs of genes remains con- stant for all samples tested, then those reference genes are either stably expressed or co-regulated. Potential re- ference gene candidates were compared in this study and ranked based on Cq value differences to determine those with the least variance. Results are shown in Table 7. The best choices for neutrophil reference genes were PGK1, YWHAZ, and RPL19. In our reference gene study for ovine neutrophils, YWHAZ and RPL19, along with G6PD and GAPDH, had the lowest delta Cq stability values [13]. Similar to geNorm, Norm-Finder, and Best- Keeper analyses, ACTB would be excluded as a refer- ence gene from consideration as it ranked consistently at or near the bottom four of the rank order. The PGK1| YWHAZ combination performed best with stability val- ues of 0.45 (control calves), 0.55 (high Se calves), and 0.52 (combined groups). 3.6. Stability of Neutrophil Reference Genes Evaluated in This Study Currently, there is no consensus as to what is the best program to evaluate potential reference genes. Therefore, we calculated the geometric mean of expression stability by four statistical approaches using the Geomean pro- gram. We found good agreement between the results with the four statistical approaches. The neutrophil reference genes, YWHAZ, PGK1, and RPL19, were consistently ranked among the top three most stable genes by all four Copyright © 2013 SciRes. OPEN ACCESS 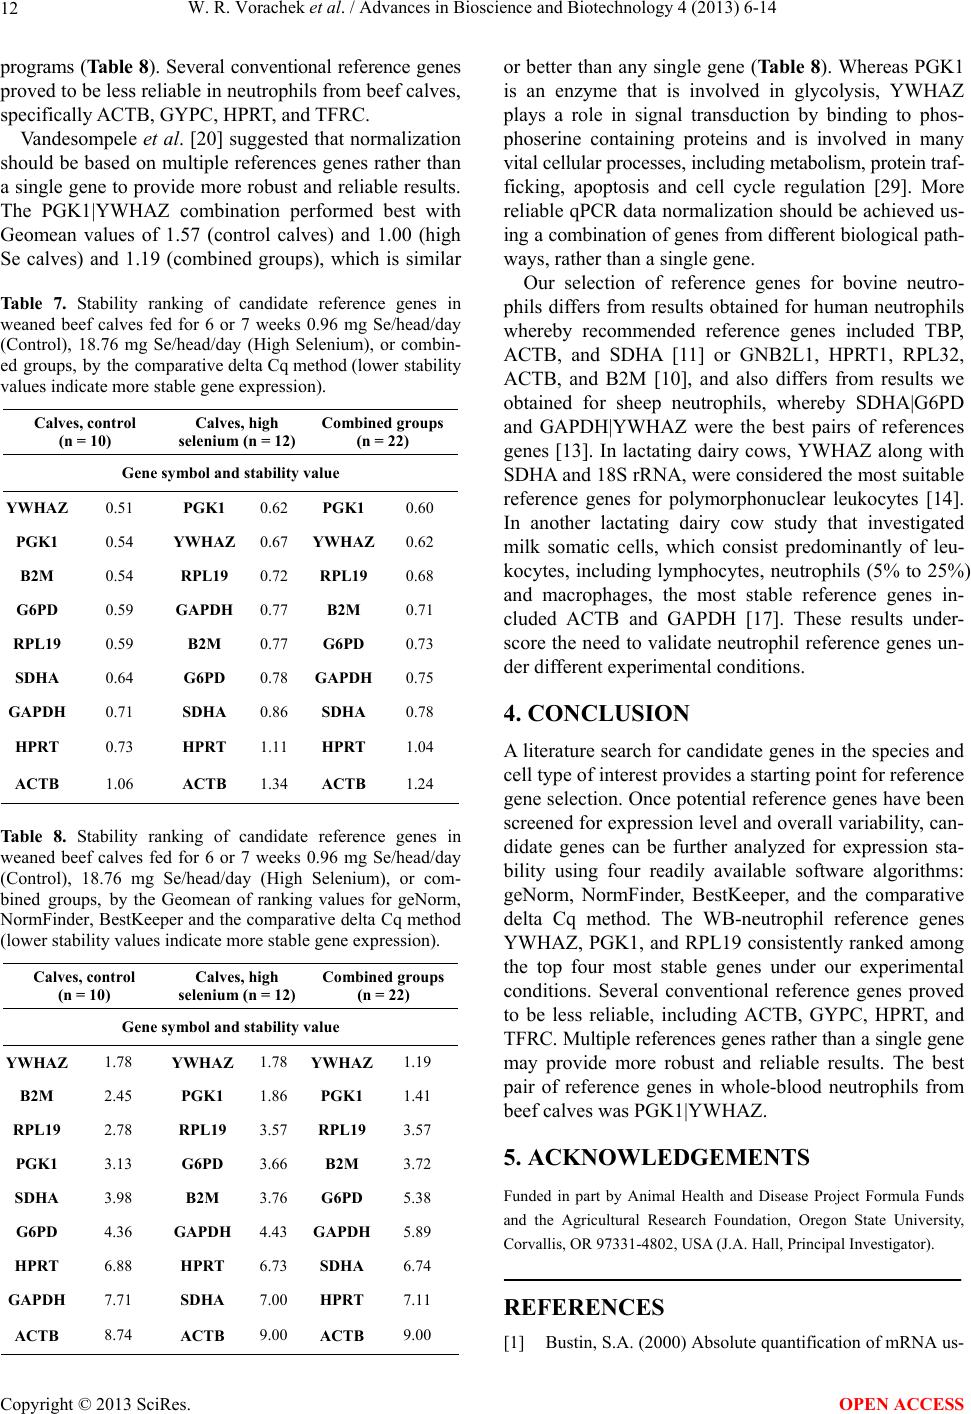 W. R. Vorachek et al. / Advances in Bioscience and Biotechnology 4 (2013) 6-14 12 programs (Table 8). Several conventional reference genes proved to be less reliable in neutrophils from beef calves, specifically ACTB, GYPC, HPRT, and TFRC. Vandesompele et al. [20] suggested that normalization should be based on multiple references genes rather than a single gene to provide more robust and reliable results. The PGK1|YWHAZ combination performed best with Geomean values of 1.57 (control calves) and 1.00 (high Se calves) and 1.19 (combined groups), which is similar Table 7. Stability ranking of candidate reference genes in weaned beef calves fed for 6 or 7 weeks 0.96 mg Se/head/day (Control), 18.76 mg Se/head/day (High Selenium), or combin- ed groups, by the comparative delta Cq method (lower stability values indicate more stable gene expression). Calves, control (n = 10) Calves, high selenium (n = 12) Combined groups (n = 22) Gene symbol and stability value YWHAZ 0.51 PGK1 0.62 PGK1 0.60 PGK1 0.54 YWHAZ 0.67 YWHAZ 0.62 B2M 0.54 RPL19 0.72 RPL19 0.68 G6PD 0.59 GAPDH 0.77 B2M 0.71 RPL19 0.59 B2M 0.77 G6PD 0.73 SDHA 0.64 G6PD 0.78 GAPDH 0.75 GAPDH 0.71 SDHA 0.86 SDHA 0.78 HPRT 0.73 HPRT 1.11 HPRT 1.04 ACTB 1.06 ACTB 1.34 ACTB 1.24 Table 8. Stability ranking of candidate reference genes in weaned beef calves fed for 6 or 7 weeks 0.96 mg Se/head/day (Control), 18.76 mg Se/head/day (High Selenium), or com- bined groups, by the Geomean of ranking values for geNorm, NormFinder, BestKeeper and the comparative delta Cq method (lower stability values indicate more stable gene expression). Calves, control (n = 10) Calves, high selenium (n = 12) Combined groups (n = 22) Gene symbol and stability value YWHAZ 1.78 YWHAZ 1.78 YWHAZ 1.19 B2M 2.45 PGK1 1.86 PGK1 1.41 RPL19 2.78 RPL19 3.57 RPL19 3.57 PGK1 3.13 G6PD 3.66 B2M 3.72 SDHA 3.98 B2M 3.76 G6PD 5.38 G6PD 4.36 GAP DH 4.43 GAPDH 5.89 HPRT 6.88 HPRT 6.73 SDHA 6.74 GAPDH 7.71 SDHA 7.00 HPRT 7.11 ACTB 8.74 ACTB 9.00 ACTB 9.00 or better than any single gene (Table 8). Whereas PGK1 is an enzyme that is involved in glycolysis, YWHAZ plays a role in signal transduction by binding to phos- phoserine containing proteins and is involved in many vital cellular processes, including metabolism, protein traf- ficking, apoptosis and cell cycle regulation [29]. More reliable qPCR data normalization should be achieved us- ing a combination of genes from different biological path- ways, rather than a single gene. Our selection of reference genes for bovine neutro- phils differs from results obtained for human neutrophils whereby recommended reference genes included TBP, ACTB, and SDHA [11] or GNB2L1, HPRT1, RPL32, ACTB, and B2M [10], and also differs from results we obtained for sheep neutrophils, whereby SDHA|G6PD and GAPDH|YWHAZ were the best pairs of references genes [13]. In lactating dairy cows, YWHAZ along with SDHA and 18S rRNA, were considered the most suitable reference genes for polymorphonuclear leukocytes [14]. In another lactating dairy cow study that investigated milk somatic cells, which consist predominantly of leu- kocytes, including lymphocytes, neutrophils (5% to 25%) and macrophages, the most stable reference genes in- cluded ACTB and GAPDH [17]. These results under- score the need to validate neutrophil reference genes un- der different experimental conditions. 4. CONCLUSION A literature search for candidate genes in the species and cell type of interest provides a starting point for reference gene selection. Once potential reference genes have been screened for expression level and overall variability, can- didate genes can be further analyzed for expression sta- bility using four readily available software algorithms: geNorm, NormFinder, BestKeeper, and the comparative delta Cq method. The WB-neutrophil reference genes YWHAZ, PGK1, and RPL19 consistently ranked among the top four most stable genes under our experimental conditions. Several conventional reference genes proved to be less reliable, including ACTB, GYPC, HPRT, and TFRC. Multiple references genes rather than a single gene may provide more robust and reliable results. The best pair of reference genes in whole-blood neutrophils from beef calves was PGK1|YWHAZ. 5. ACKNOWLEDGEMENTS Funded in part by Animal Health and Disease Project Formula Funds and the Agricultural Research Foundation, Oregon State University, Corvallis, OR 97331-4802, USA (J.A. Hall, Principal Investigator). REFERENCES [1] Bustin, S.A. (2000) Absolute quantification of mRNA us- Copyright © 2013 SciRes. OPEN ACCESS  W. R. Vorachek et al. / Advances in Bioscience and Biotechnology 4 (2013) 6-14 13 ing real-time reverse transcription polymerase chain reac- tion assays. Journal of Molecular Endocrinology, 25, 169-193. http://dx.doi.org/10.1677/jme.0.0250169 [2] Suzuki, T., Higgins, P.J. and Crawford, D.R. (2000) Con- trol selection for RNA quantitation. Biotechniques, 29, 332-337. [3] Warrington, J.A., Nair, A., Mahadevappa, M. and Tsy- ganskaya, M. (2000) Comparison of human adult and fe- tal expression and identification of 535 housekeeping/ maintenance genes. Physiological Genomics, 2, 143-147. [4] Thellin, O., Zorzi, W., Lakaye, B., De Borman, B., Cou- mans, B., Hennen, G., Grisar, T., Igout, A. and Heinen, E. (1999) Housekeeping genes as internal standards: Use and limits. Journal of Biotechnology, 75, 291-295. http://dx.doi.org/10.1016/S0168-1656(99)00163-7 [5] Huggett, J., Dheda, K., Bustin, S. and Zumla, A. (2005) Real-time RT-PCR normalisation; strategies and consid- erations. Genes & Immunity, 6, 279-284. http://dx.doi.org/10.1038/sj.gene.6364190 [6] Hugejiletu, H., Bobe, G., Vorachek, W.R., Gorman, M.E., Mosher, W.D., Pirelli, G.J. and Hall, J.A. (2013) Selenium supplementation alters gene expression profiles associat- ed with innate immunity in whole-blood neutrophils of sheep. Biological Tra c e E lement Researc h, 154, 28-44. http://dx.doi.org/10.1007/s12011-013-9716-6 [7] Brinkmann, V., Reichard, U., Goosmann, C., Fauler, B., Uhlemann, Y., Weiss, D.S., Weinrauch, Y. and Zychlin- sky, A. (2004) Neutrophil extracellular traps kill bacteria. Science, 303, 1532-1535. http://dx.doi.org/10.1126/science.1092385 [8] Buchanan, J.T., Simpson, A.J., Aziz, R.K., Liu, G.Y., Kristian, S.A., Kotb, M., Feramisco, J. and Nizet, V. (2006) DNase expression allows the pathogen group A Streptococcus to escape killing in neutrophil extracellular traps. Current Biology, 16, 396-400. http://dx.doi.org/10.1016/j.cub.2005.12.039 [9] Beiter, K., Wartha, F., Albiger, B., Normark, S., Zychlin- sky, A. and Henriques-Normark, B. (2006) An endonu- clease allows Streptococcus pneumoniae to escape from neutrophil extracellular traps. Current Biology, 16, 401- 407. http://dx.doi.org/10.1016/j.cub.2006.01.056 [10] Zhang, X., Ding, L. and Sandford, A.J. (2005) Selection of reference genes for gene expression studies in human neutrophils by real-time PCR. BMC Molecular Biology, 6, 4. http://dx.doi.org/10.1186/1471-2199-6-4 [11] Ledderose, C., Heyn, J., Limbeck, E. and Kreth, S. (2011) Selection of reliable reference genes for quantitative real- time PCR in human T cells and neutrophils. BMC Re- search Notes, 4, 427. http://dx.doi.org/10.1186/1756-0500-4-427 [12] Peletto, S., Bertuzzi, S., Campanella, C., Modesto, P., Ma- niaci, M.G., Bellino, C., Ariello, D., Quasso, A., Cara- melli, M. and Acutis, P.L. (2011) Evaluation of internal reference genes for quantitative expression analysis by real-time PCR in ovine whole blood. International Jour- nal of Molecular Sciences, 12, 7732-7747. http://dx.doi.org/10.3390/ijms12117732 [13] Vorachek, W.R., Hugejiletu, Bobe, G. and Hall, J.A. (2013) Reference gene selection for quantitative PCR studies in sheep neutrophils. International Journal of Molecular Sci- ences, 14, 11484-11495. http://dx.doi.org/10.3390/ijms140611484 [14] De Ketelaere, A., Goossens, K., Peelman, L. and Burve- nich, C. (2006) Technical note: Validation of internal con- trol genes for gene expression analysis in bovine poly- morphonuclear leukocytes. Journal of Dairy Science, 89, 4066-4069. http://dx.doi.org/10.3168/jds.S0022-0302(06)72450-X [15] Bougarn, S., Cunha, P., Gilbert, F.B., Meurens, F. and Rai- nard, P. (2011) Technical note: Validation of candidate reference genes for normalization of quantitative PCR in bovine mammary epithelial cells responding to inflamma- tory stimuli. Journal of Dairy Science, 94, 2425-2430. http://dx.doi.org/10.3168/jds.2010-3859 [16] Saremi, B., Sauerwein, H., Danicke, S. and Mielenz, M. (2012) Technical note: Identification of reference genes for gene expression studies in different bovine tissues fo- cusing on different fat depots. Journal of Dairy Science, 95, 3131-3138. http://dx.doi.org/10.3168/jds.2011-4803 [17] Varshney, N., Mohanty, A.K., Kumar, S., Kaushik, J.K., Dang, A.K., Mukesh, M., Mishra, B.P., Kataria, R., Ki- mothi, S.P., Mukhopadhyay, T.K., Malakar, D., Prakash, B.S., Grover, S. and Batish, V.K. (2012) Selection of sui- table reference genes for quantitative gene expression stu- dies in milk somatic cells of lactating cows (Bos indicus). Journal of Dairy Science, 95, 2935-2945. http://dx.doi.org/10.3168/jds.2011-4442 [18] Brym, P., Rusc, A. and Kaminski, S. (2013) Evaluation of reference genes for qRT-PCR gene expression studies in whole blood samples from healthy and leukemia-virus in- fected cattle. Veterinary Immunology and Immunopatho- logy, 153, 302-307. http://dx.doi.org/10.1016/j.vetimm.2013.03.004 [19] Perez, R., Tupac-Yupanqui, I. and Dunner, S. (2008) Eva- luation of suitable reference genes for gene expression studies in bovine muscular tissue. BMC Molecular Biol- ogy, 9, 79. http://dx.doi.org/10.1186/1471-2199-9-79 [20] Vandesompele, J., De Preter, K., Pattyn, F., Poppe, B., Van Roy, N., De Paepe, A. and Speleman, F. (2002) Accurate normalization of real-time quantitative RT-PCR data by geometric averaging of multiple internal control genes. Genome Biology, 3, RESEARCH0034. [21] Andersen, C.L., Jensen, J.L. and Orntoft, T.F. (2004) Nor- malization of real-time quantitative reverse transcription- PCR data: A model-based variance estimation approach to identify genes suited for normalization, applied to bladder and colon cancer data sets. Cancer Research, 64, 5245- 5250. http://dx.doi.org/10.1158/0008-5472.CAN-04-0496 [22] Pfaffl, M.W., Tichopad, A., Prgomet, C. and Neuvians, T.P. (2004) Determination of stable housekeeping genes, differentially regulated target genes and sample integrity: BestKeeper—Excel-based tool using pair-wise correlations. Biotechnology Letters, 26, 509-515. http://dx.doi.org/10.1023/B:BILE.0000019559.84305.47 [23] Silver, N., Best, S., Jiang, J. and Thein, S.L. (2006) Se- lection of housekeeping genes for gene expression studies in human reticulocytes using real-time PCR. BMC Mole- cular Biology, 7, 33. http://dx.doi.org/10.1186/1471-2199-7-33 Copyright © 2013 SciRes. OPEN ACCESS  W. R. Vorachek et al. / Advances in Bioscience and Biotechnology 4 (2013) 6-14 Copyright © 2013 SciRes. 14 OPEN ACCESS [24] Bustin, S.A., Benes, V., Garson, J.A., Hellemans, J., Hug- gett, J., Kubista, M., Mueller, R., Nolan, T., Pfaffl, M.W., Shipley, G.L., Vandesompele, J. and Wittwer, C.T. (2009) The MIQE guidelines: Minimum information for publica- tion of quantitative real-time PCR experiments. Clinical Chemistry, 55, 611-622. http://dx.doi.org/10.1373/clinchem.2008.112797 [25] Tao, W., Mallard, B., Karrow, N. and Bridle, B. (2004) Construction and application of a bovine immune-endo- crine cDNA microarray. Veterinary Immunology and Im- munopathology, 101, 1-17. http://dx.doi.org/10.1016/j.vetimm.2003.10.011 [26] Hall, J.A., Bobe, G., Hunter, J.K., Vorachek, W.R., Ste- wart, W.C., Vanegas, J.A., Estill, C.T., Mosher, W.D. and Pirelli, G.J. (2013) Effect of feeding selenium-fertilized alfalfa hay on performance of weaned beef calves. PLoS One, 8, e58188. http://dx.doi.org/10.1371/journal.pone.0058188 [27] Pfister, C., Tatabiga, M.S. and Roser, F. (2011) Selection of suitable reference genes for quantitative real-time po- lymerase chain reaction in human meningiomas and ara- chnoidea. BMC Resea rch Notes, 4, 275. http://dx.doi.org/10.1186/1756-0500-4-275 [28] Hellemans, J., Mortier, G., De Paepe, A., Speleman, F. and Vandesompele, J. (2007) qBase relative quantification framework and software for management and automated analysis of real-time quantitative PCR data. Genome Bi- ology, 8, R19. http://dx.doi.org/10.1186/gb-2007-8-2-r19 [29] Niemantsverdriet, M., Wagner, K., Visser, M. and Bac- kendorf, C. (2008) Cellular functions of 14-3-3 zeta in apoptosis and cell adhesion emphasize its oncogenic cha- racter. Oncogene, 27, 1315-1319. http://dx.doi.org/10.1038/sj.onc.1210742
|