H. JOHNKE ET AL.
98
Control
10 mM ketamine
20 mM ketamine
30 mM ketamine
45 mM ketamine
1.2
1.0
60 mM ketamine
80 mM ketamine
90 mM ketamine
y = −0.002x + 0.861
R = −0.99451
0.85
0.80
0.75
0.70
0.65
0.60
0.8
0.6
0.4
0.2
0.0
Absorbance
Absorbance at 515 nm
0 20 40 60 80 100
Ketamine Concentration (mM)
450 475 500 525 550 575 600
Wavelength (nm)
1-5
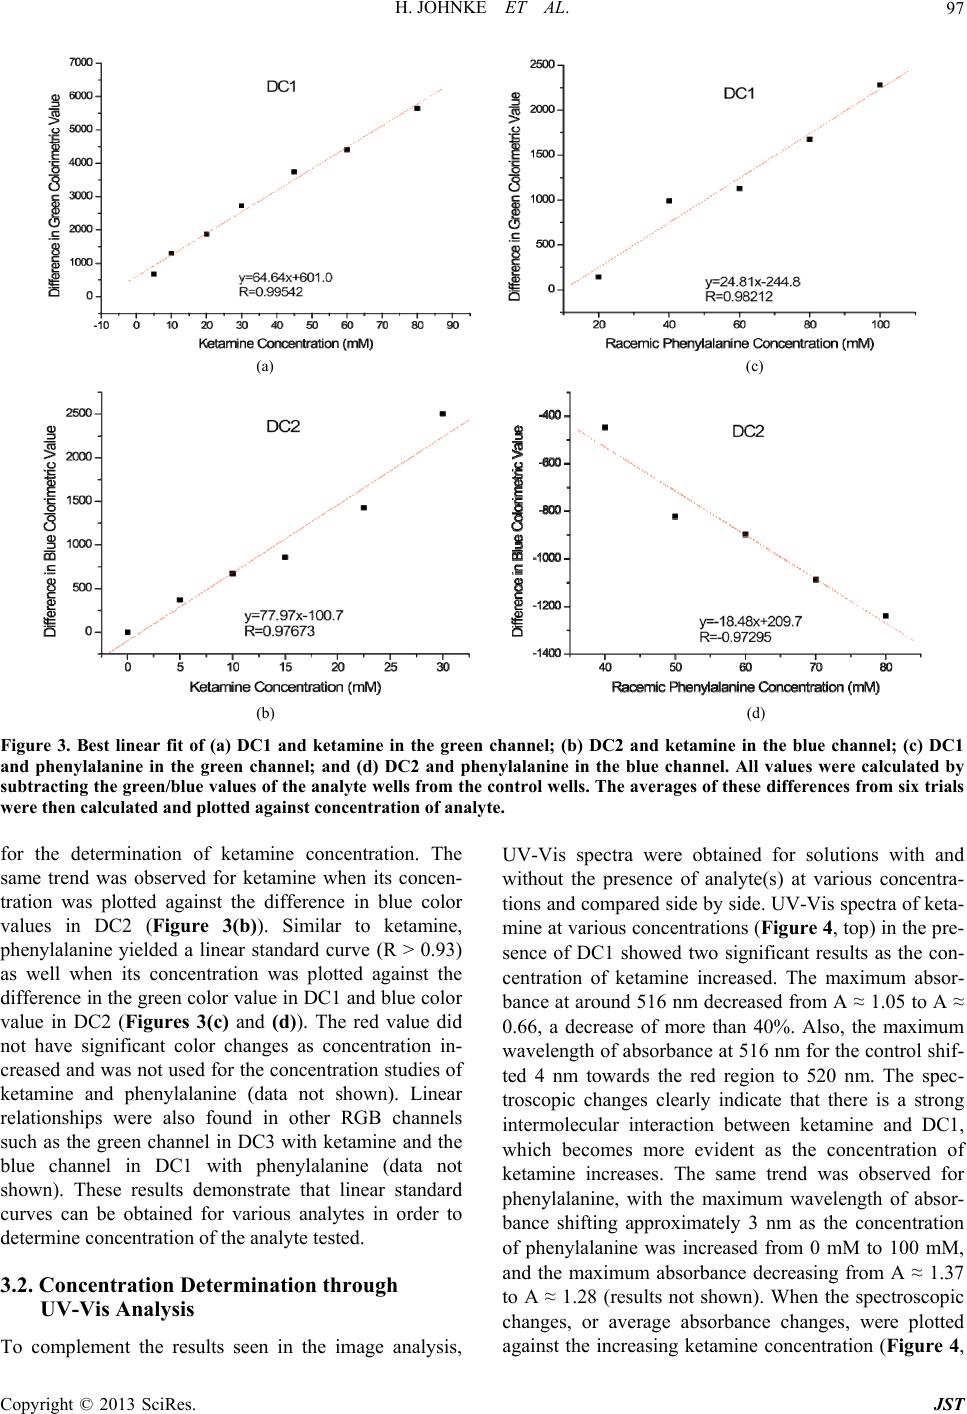
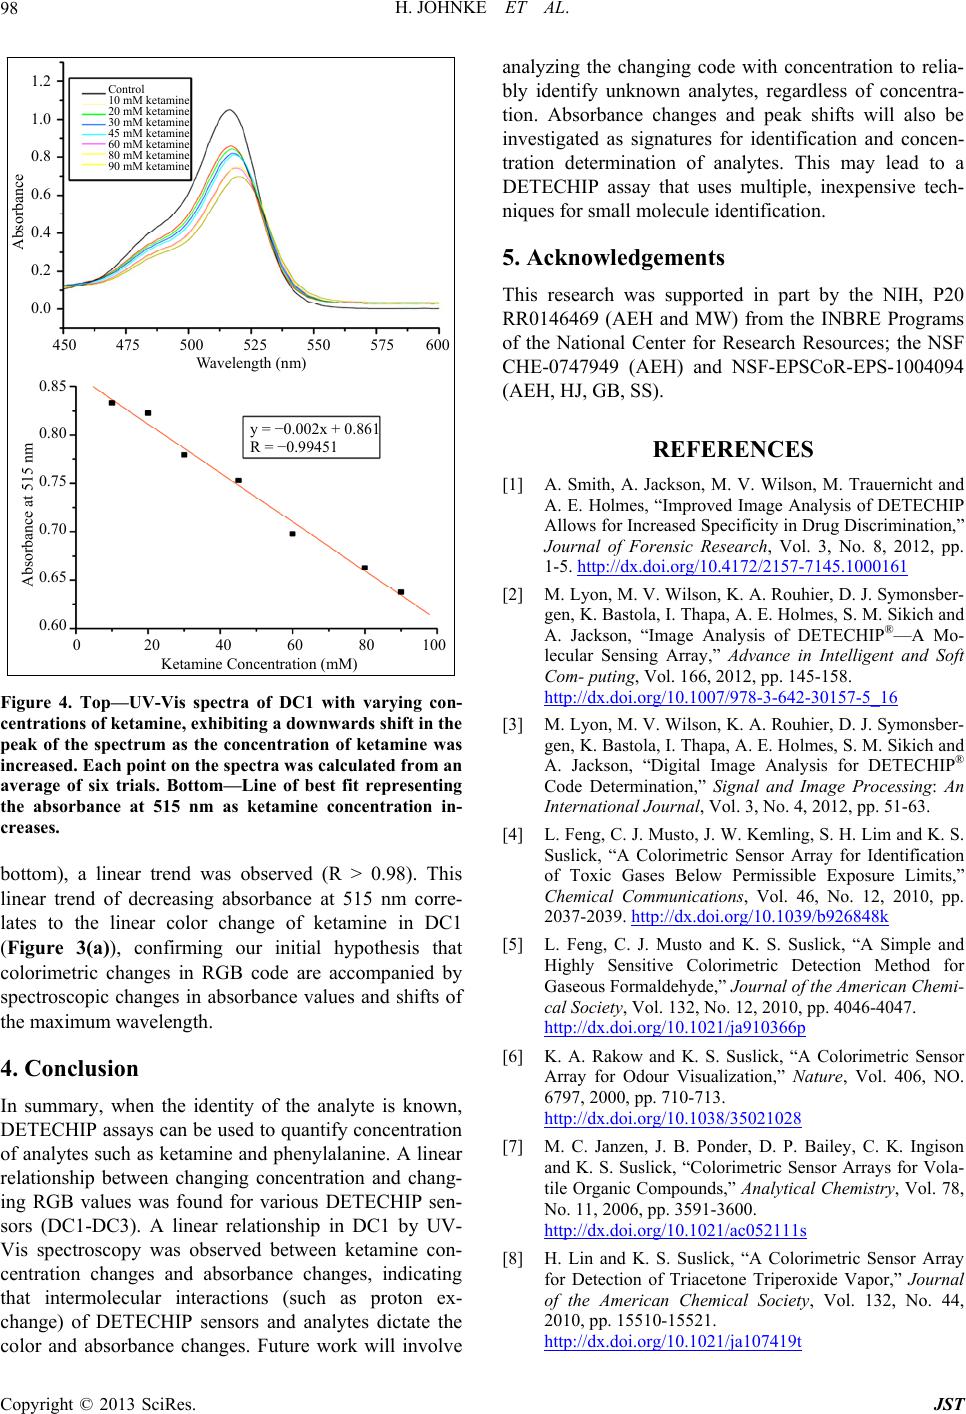
Figure 4. Top—UV-Vis spectra of DC1 with varying
centrations of ketamine, exhibiting a dow nwards shift in the
peak of the spectrum as the concentration of ketamine was
nd of decreasing absorbance at 515 nm corre-
tes to the linear color change of ketamine in
tity of the analyte is known,
can be used to quantify concentration
ketamine and phenylalanine. A linea
color and absorbance changes. Future work will involve
BRE Programs
ources; the NSF
F-EPSCoR-EPS-1004094
son, M. V. Wilson, M. Trauernicht and
A. E. Holmes, “Improved Image Analysis of DETECHIP
Allows for Incrination,”
Journal of Fo, No. 8, 2012, pp.
con-
increased. Each point on the spectra was calculated from an
average of six trials. Bottom—Line of best fit representing
the absorbance at 515 nm as ketamine concentration in-
creases.
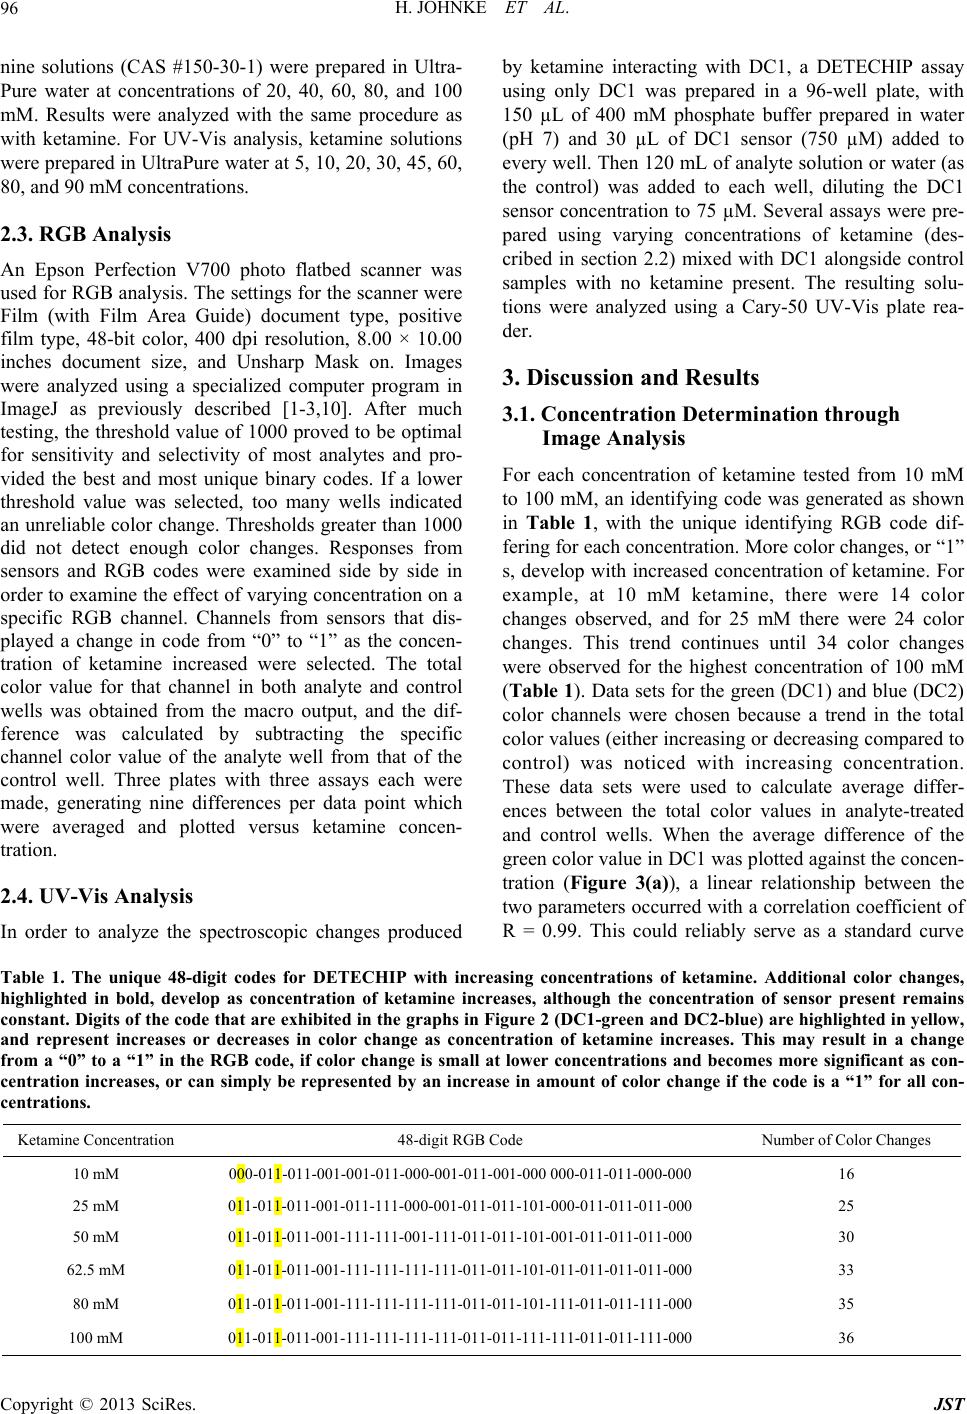
bottom), a linear trend was observed (R > 0.98). This
linear tre
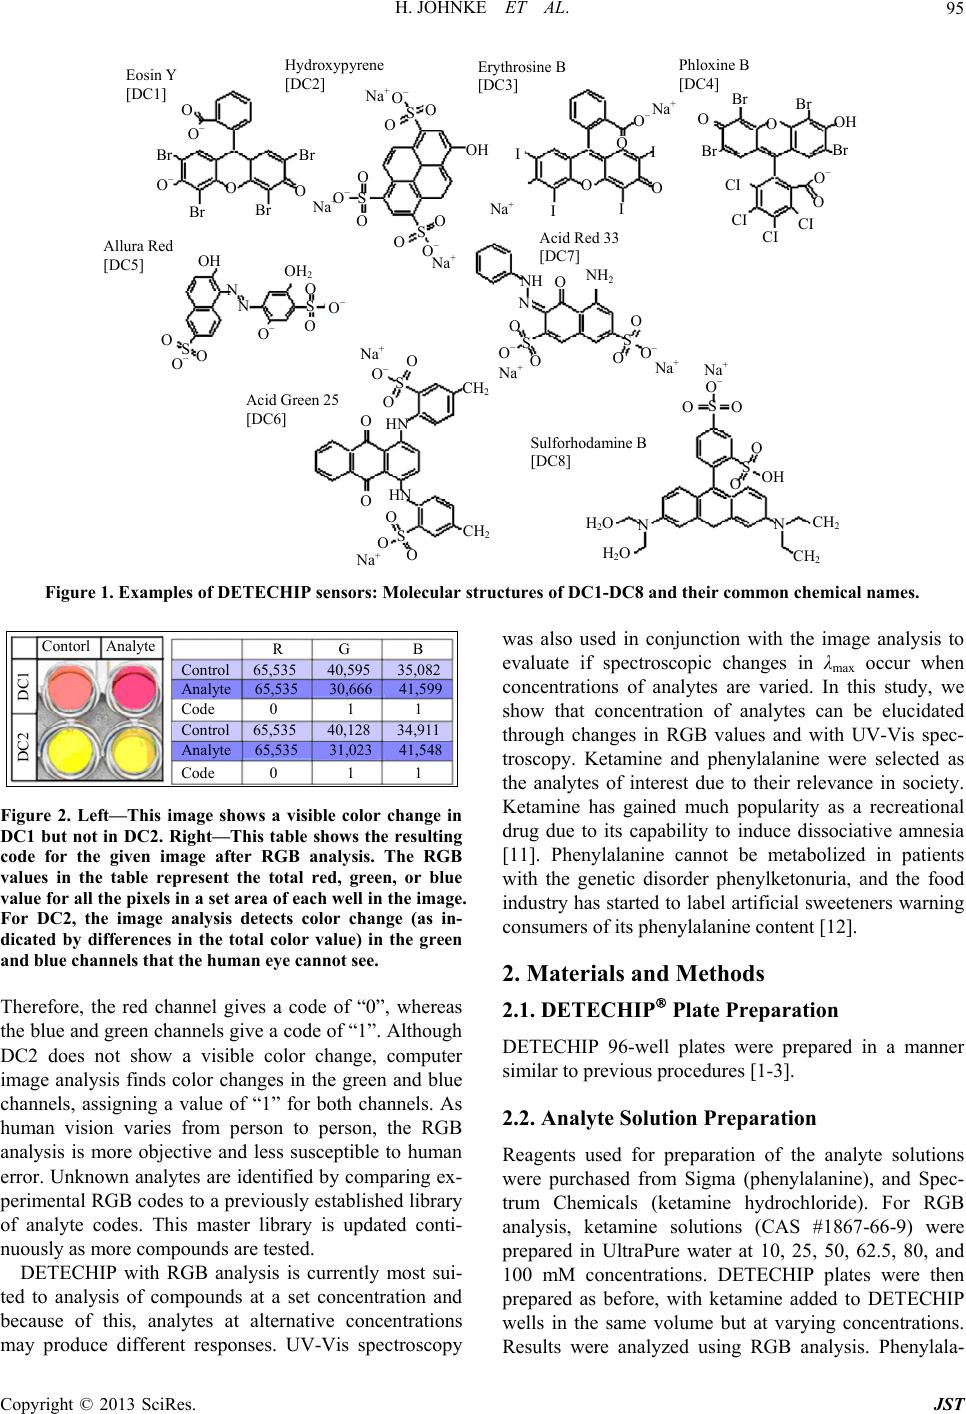
laDC1
(Figure 3(a)), confirming our initial hypothesis that
colorimetric changes in RGB code are accompanied by
spectroscopic changes in absorbance values and shifts of
the maximum wavelength.
4. Conclusion
In summary, when the iden
DETECHIP assays
of analytes such asr
relationship between changing concentration and chang-
ing RGB values was found for various DETECHIP sen-
sors (DC1-DC3). A linear relationship in DC1 by UV-
Vis spectroscopy was observed between ketamine con-
centration changes and absorbance changes, indicating
that intermolecular interactions (such as proton ex-
change) of DETECHIP sensors and analytes dictate the
analyzing the changing code with concentration to relia-
bly identify unknown analytes, regardless of concentra-
tion. Absorbance changes and peak shifts will also be
investigated as signatures for identification and concen-
tration determination of analytes. This may lead to a
DETECHIP assay that uses multiple, inexpensive tech-
niques for small molecule identification.
5. Acknowledgements
This research was supported in part by the NIH, P20
RR0146469 (AEH and MW) from the IN
of the National Center for Research Res
CHE-0747949 (AEH) and NS
(AEH, HJ, GB, SS).
REFERENCES
[1] A. Smith, A. Jack
eased Specificity in Drug Discrim
rensic Research, Vol. 3
. http://dx.doi.org/10.4172/2157-7145.1000161
[2] M. Lyon, M. V. Wilson, K. A. Rouhier, D. J. Symonsber-
gen, K. Bastola, I. Thapa, A. E. Holmes, S. M. Sikich and
A. Jackson, “Image Analysis of DETECHIP®—A Mo-
lecular Sensing Array,” Advance in Intelligent and Soft
Com- puting, Vol. 166, 2012, pp. 145-158.
http://dx.doi.org/10.1007/978-3-642-30157-5_16
[3] M. Lyon, M. V. Wilson, K. A. Rouhier, D. J. Symonsber-
gen, K. Bastola, I. Thapa, A. E. Holmes, S. M. Sikich and
A. Jackson, “Digital Image Analysis for DETECHIP®
Code Determination,” Signal and Image Processing: An
International Journal, Vol. 3, No. 4, 2012, pp. 51-63.
[4] L. Feng, C. J. Musto, J. W. Kemling, S. H. Lim and K. S.
Suslick, “A Colorimetric Sensor Array for Identification
of Toxic Gases Below Permissible Exposure Limits,”
Chemical Communications, Vol. 46, No. 12, 2010, pp.
2037-2039. http://dx.doi.org/10.1039/b926848k
[5] L. Feng, C. J. Musto and K. S. Suslick, “A Simple and
Highly Sensitive Colorimetric Detection Method for
Gaseous Formaldehyde,” Journal of the American Chemi-
cal Society, Vol. 132, No. 12, 2010, pp. 4046-4047.
http://dx.doi.org/10.1021/ja910366p
[6] K. A. Rakow and K. S. Suslick, “A Colorimetric Sensor
Array for Odour Visualization,” Nature, Vol. 406, NO.
6797, 2000, pp. 710-713.
http://dx.doi.org/10.1038/35021028
[7] M. C. Janzen, J. B. Ponder, D. P. Bailey, C. K. Ingison
and K. S. Suslick, “Colorimetric Sensor Arrays for Vola-
tile Organic Compounds,” Analytical Chemistry, Vol. 78,
No. 11, 2006, pp. 3591-3600.
http://dx.doi.org/10.1021/ac052111s
[8] H. Lin and K. S. Suslick, “A Colorimetric Sensor Array
for Detection of Triacetone Triperoxide Vapor,” Journal
of the American Chemical Society, Vol. 132, No. 44,
2010, pp. 15510-15521.
http://dx.doi.org/10.1021/ja107419t
Copyright © 2013 SciRes. JST