Pharmacology & Pharmacy, 2013, 4, 484-489
http://dx.doi.org/10.4236/pp.2013.46070 Published Online September 2013 (http://www.scirp.org/journal/pp)
New Matrix Tablet from Okra Gum: Effects of Method of
Preparation and Gum Concentration on Tablet Properties
Bakre Lateef Gbenga*, Abimbola Zulikha
Department of Pharmaceutics and Pharmaceutical Technology, Olabisi Onabanjo University, Sagamu, Nigeria.
Email: *lateefbakr@yahoo.com
Received May 21st, 2013; revised June 28th, 2013; accepted July 14th, 2013
Copyright © 2013 Bakre Lateef Gbenga, Abimbola Zulikha. This is an open access article distributed under the Creative Commons
Attribution License, which permits unrestricted use, distribution, and reproduction in any medium, provided the original work is
properly cited.
ABSTRACT
The objective of this investigation is to study the effect of methods of preparation and concentration of gum on the
compressional and mechanical properties of Okra gum matrix. The compressional behavior of Okra gum matrices pre-
pared by direct compression and wet granulations is analyzed using density measurements, Heckel and Kawakita analy-
sis while the mechanical properties of the formulations were assessed using crushing strength (CS) and friability (FR) as
well as CSFR ratio. Formulations prepared by direct compression had lower Pk values than those prepared by wet
granulation while there was no significant difference between Py values of formulations prepared by direct compression
and wet granulations. Therefore, formulations prepared by direct compression underwent plastic deformation more eas-
ily and rapidly than those prepared by wet granulation. The results show that DB values increased with decrease in con-
centration of the gum and granules undergo higher degree of fragmentation than powders. Formulations containing 90%
w/w Okra gum exhibited the highest amount of total plastic deformation and gave the best packing. Tablets prepared by
direct compression showed lower bond strength and higher friability values than those prepared by wet granulations.
The crushing strength generally decreases with a decrease in the concentration of the gum while there was an inverse
relationship between friability and gum concentration. CSFR decreases with a decrease in gum concentration and tab-
lets prepared by wet granulations showed significantly higher values of CSFR (p < 0.001) than those prepared by direct
compression. The results suggest that the concentration of gum and the method of preparation of materials for compres-
sion are critical factors in the formulation of Okra gum matrices with acceptable compressional and mechanical proper-
ties.
Keywords: Okra Gum; Wet Granulation; Direct Compression; Compressional and Mechanical Properties
1. Introduction
Natural polymers and their semi-synthetic derivatives
gained popularity in development of novel drug delivery
systems. They are degradable, compatible with bioactive
agents, readily available, and possess ability for chemical
modifications as well as have functional versatility [1-4].
A large number of natural polymers that are used for
drug delivery are non starch polysaccharides, many of
which are hydrogels with high swelling ratios and capa-
ble of causing large viscosity increases in aqueous solu-
tions even at small concentrations [5]. These are among
the properties that make them overtly dependable in sev-
eral conventional and novel drug delivery systems [6,7].
Thus, natural biopolymers like Okra gum along with
their modification products offer a wide range of proper-
ties and applications.
Okra gum obtained from the fruits of Abelmuscus es-
culentus, is a polysaccharide consisting of D-galactose,
L-rhamnose and L-galacturonic acid [8]. Okra gum had
been evaluated as binder in tablet dosage formulation
[9,10] and as a control release agent in modified release
matrices in comparison with sodium carboxymethyl cel-
lulose (NaCMC) and hydroxypropylmethylcellulose (HPMC)
using paracetamol as the model drug. Okra gum matrices
provided controlled release of paracetamol for more than
6 h and the release rates followed time-dependent kinet-
ics. Okra gum compared favourably with NaCMC, and a
combination of Okra gum and NaCMC, and further addi-
tion of HPMC resulted in a near zero order release of
paracetamol from the matrix tablet [11].
*Corresponding author.
Copyright © 2013 SciRes. PP
New Matrix Tablet from Okra Gum: Effects of Method of Preparation and Gum Concentration on Tablet Properties 485
In the manufacture of matrix tablets, measures are
taken to ensure that they possess a suitable mechanical
strength to avoid crumbling or breaking on handling or
subsequent processing and good release profile. The ef-
fect of formulation factors on the properties of matrix
tablets made from various natural gums has been widely
reported [12]. However, there appears to be little infor-
mation on the effect of method of preparation on the
properties of Okra gum matrices. Thus, the aim of the
present investigation is to study the effect of concentra-
tion of gum and the method of preparation on the com-
pressional and mechanical properties of Okra gun matri-
ces.
2. Materials and Methods
2.1. Material
The materials used were Metformin (Lifeline Pharma-
ceutical, Mumbai), acetonitrite, sodium carboxymethyl
cellulose and magnesium stearate (BDH chemicals, UK).
Okra gum was isolated from okra pods at the Pharma-
ceutics Laboratory, Olabisi Onabanjo University, Nige-
ria.
2.2. Extraction of Gum from Okra Pods
Okra gum was extracted from the pods of okra fruit. The
fruits were cleaned, washed, sliced, crushed and then
macerated in distilled water for 10 hours with intermit-
tent stirring. The mucilage was filtered through a white
muslin cloth to extract the gum and acetone was added to
precipitate the extracted gum. The gum was then filtered
under vacuum to remove acetone and dried in a dessica-
tor.
2.3. Preparation of Granules
Batches (200 g) of the formulation of Okra gum and met-
formin with or without sodium carboxymethyl cellulose
were dry-mixed for 5 min in a Kenwood planetary mixer.
Particle density was determined by using the Helium
pycnometer. The dry mixed batches were moistened with
15 mL of distilled water and mixed in a Kenwood plan-
ery mixer. Massing was continued for 5 min and, the wet
masses were granulated by passing them through a num-
ber 12 mesh sieve (1400 µm), dried in a hot air oven for
18 h at 50˚C, and resieved through a 16-mesh sieve
(1000 µm). The granules were stored in air tight contain-
ers.
2.4. Determination of Precompression Density
The particle density was determined by the pycnometer
method using the liquid immersion technique with ben-
zene as the displacement fluid. The bulk density of for-
mulation at zero pressure (loose density) was determined
by pouring the granules at an angle of 45˚ through a fun-
nel into a glass measuring cylinder with a diameter of 21
mm and a volume of 50 mL. Determinations were made
in triplicate. The relative density, D0, of each powder was
obtained from the ratio of its loose density to the tapped
density.
2.5. Tablet Compression
Okra gum matrix (300 mg) were prepared by direct com-
pression of each mixture containing 0%, 10%, 20%, 40%
drug (Metformin) in Okra and 10% drug in Sodium car-
boxymethyl cellulose (NaCMC), for 30 sec with prede-
termined loads using a carver hydraulic press (Model C,
Carver Inc., Menomomee Falls, WJ). Before each com-
pression, the die (12.5 mm) and the flat faced punches
were lubricated with a 2% magnesium stearate in ben-
zene. After ejection, the tablets were stored over silica
gel for 24 hr to allow for elastic recovery and hardening
and to prevent false low yield values. Their weights and
dimensions were determined to within ±1 mg and 0.01
mm respectively.
Matrix tablets (300 mg) were also prepared from the
500 to 1000 µm size fraction of granules by compressing
them for 30 sec with pre determined loads on a hydraulic
press as described above for tablets prepared by direct
compression.
2.6. Crushing Strength and Friability Tests
The load required to diametrically break each tablet
(crushing strength, CS) was determined using a Mon-
santo Hardness tester. The friability (F) of the tablets
were determined using a friabilator (Veego scientific
device, Mumbai, India) operated at 25 revolutions per
minute for 4 minutes.
2.7. Tablet Disintegration Test
The disintegration times of the tablets were determined
in distilled water at 37˚C using a BP Manesty disintegra-
tion unit (Manesty Machines, Poole, UK). Six tablets
from each formulation were placed on the wire mesh just
above the surface of the distilled water in the tube and
the apparatus was started simultaneously. The time at
which each tablet disintegrated completely was observed
and recorded. Determinations were made in triplicate and
the mean time was recorded.
2.8. Compaction Data Analysis
The Heckel equation has by far been the most popular in
recent years among pharmaceutical scientists, and many
apparent yield pressure values (“in-die”, Py) and mean
yield pressure values (“out-of-die”) of active substances
and tableting excipients have been published [13]. De-
spite the versatility of the Heckel equation however,
Copyright © 2013 SciRes. PP
New Matrix Tablet from Okra Gum: Effects of Method of Preparation and Gum Concentration on Tablet Properties
486
drawbacks and limitations to its use have been reported.
Some scientists have used more than one equation to try
to eliminate the shortcomings of the others [14,15].
Hence, in this study, both Heckel and Kawakita plots
have been used to assess the compressional behaviour of
the materials.
2.9. Heckel Analysis
The plots constructed according to the Heckel equation
[16] were used to characterize the consolidation behavior
of the formulations:
Ln 11DKPA

 (1)
where D is the ratio of the density of the powder mass at
pressure P to the density of the powder mixture (i.e.,
relative density). K, the slope of the straight portion of
the graph, reflects the reduction in porosity or the resis-
tance to volume reduction of granules and A is a constant.
The yield pressure, Py, is usually calculated as the recip-
rocal of the linear portion of the slope of the Heckel plot.
The relative density DA was calculated from the intercept,
A, using the Equation 2:
A
A
D1e
(2)
DB, the relative density during the rearrangement
phase was calculated from the difference between DA and
DO (relative density of the granules at nil pressure).
2.10. Kawakita Analysis
The Kawakita equation [17] describes the relationship
between the volume reduction of powder column and the
applied pressure;
00
CVVV ab1
b
PP   (3)
where, C, is degree of volume reduction, V0 is initial
volume, V is volume of powder column under the ap-
plied pressure P. a, b are constants characteristic to pow-
der being compressed. The equation above can be re ar-
ranged in linear form as:
PC Paab1 (4)
From the graphical presentation of P/C versus P, the
constant “a”, is given as a reciprocal of the slope from
the linear portion of the plot and equivalent to the value
of C at infinitely high pressures. 1/ab is the intercept. a,
gives an indication of the maximum volume reduction
available and is considered to describe the compressibil-
ity of a powder, while b is considered to describe an in-
clination toward volume reduction. However, the actual
physical meaning of the constants a and b have been in
question [18]. Values of 1 – a yield the initial relative
density of the material, DI which has been shown to pro-
vide a measure of the packed initial relative density of
tablets with the application of small pressure [19] The
reciprocal of b is related to pressure term, Pk, which is
the pressure, required to reduce the powder bed by 50%
[20].
2.11. Statistical Analysis
The data were analyzed using correlation analysis and
two-way ANOVA.
3. Results and Discussion
Powder compaction is a volume reduction process [16]
and the Heckel equation is also based on volume change
of a powder column during compression, hence the plots
gave a general impression of the densification process of
the powder column. Figure 1 shows representative
Heckel plots for Okra gum matrices containing 90% w/w
and 60% w/w of Okra gum prepared by direct compres-
sion and wet granulation.
The mean yield pressure, Py, was calculated from the
regions of the plots showing the highest correlation coef-
ficient of 0.990 for all formulations (usually 84.93 -
226.47 MN/m2). The intercept A, was determined from
the extrapolation of the line. The values of the mean
yield pressure Py, DA, DB and DO are presented in Table 1.
The DA values, which represent the total degree of
packing at zero and low pressures increases as the con-
centration of the gum decreases. In general, formulations
prepared by wet granulation gave higher DA values than
those prepared by wet granulations. The DB values rep-
resent the particulate rearrangement phase in the early
compression stages and tend to indicate the extent of
particle or granule fragmentation, although fragmentation
Figure 1. Heckel plots for Okra gum matrix tablet prepared
by direct compression (-------) and wet granulation (…….).
, 90% w/w Okra gum; , 60% w/w okra gum.
Copyright © 2013 SciRes. PP
New Matrix Tablet from Okra Gum: Effects of Method of Preparation and Gum Concentration on Tablet Properties
Copyright © 2013 SciRes. PP
487
Table 1. Parameters derived from Heckel and Kawakita plots for Okra gum matrices.
Direct Compresion Wet Granulation
Heckel Plot Kawakita plot Heckel Plot Kawakita plot
Matrix
Tablet
Composition Py D
A D
B P
k a DI P
y D
A D
B P
k a DI
10% Drug in Okra Gum 2.82 0.299 0.099 0.0260.9660.0342.3960.77200.290 0.113 0.9650.035
20% Drug in Okra Gum 2.14 0.373 0.173 0.4290.9700.0302.1370.99980.722 0.018 0.9790.021
30% Drug in Okra Gum 1.48 0.491 0.208 0.0760.9710.0291.4810.00020.412 0.381 0.9570.043
40% Drug In Okra Gum 1.47 0.493 0.293 0.0630.9700.0031.4490.00020.286 1.360 0.9950.005
10% Drug in NaCMC 2.14 0.374 0.174 0.0150.9870.0132.1330.00010.141 0.524 0.9820.018
can occur concurrently with plastic and elastic deforma-
tion of constituent particles. The DB values increase with
decrease concentration of the gum and formulations pre-
pared by wet granulation exhibited higher values. This
result indicates that granules undergo higher degree of
fragmentation than powders. Powder particles were more
resistant to movement once the initial phase of packing
(as a result of die filling) had been completed. This could
be attributed to the high cohesive forces likely present as
a result of the powder’s amorphous nature.
Figure 2 shows representative Kawakita plots for
Okra gum matrices containing 90% w/w and 60% w/w
Okra gum prepared by wet granulations and direct com-
pression. A linear relationship was obtained at all com-
pression pressures used with a 0.999 correlation coeffi-
cient for all formulation. Values of a and ab were ob-
tained from the slope and intercept of the plot respec-
tively. DI , the initial relative density of the formulation
were obtained from 1-a while Pk values were obtained
from the reciprocal of b. The DI values, which are meas-
urements of the packed initial relative density of the
formulation with application of small pressures or tap-
ping [21] decreased as the concentration of the gum de-
creases. The Pk and Py values, which are inverse meas-
urements of the plastic deformation occurring during the
compression process also decreased with a decrease in
concentration of gum. In addition, formulations prepared
by direct compression had lower Pk values than those
prepared by wet granulation while there was no signifi-
cant difference between Py values of formulations pre-
pared by direct compression and wet granulations. Thus,
the method of preparation appears to have little or no
effect on the onset of plastic deformation but the overall
amount of plastic deformation occurring during the com-
pression process was higher for formulations prepared by
direct compression as indicated by the lower Pk values.
The results indicate that formulations prepared by direct
compression underwent plastic deformation more easily
and rapidly than those prepared by wet granulation. This
also suggests that the wet granulation formulations are
somewhat resistant to deformation. In tablets prepared by
direct compression, formulations containing 90% of Okra
Figure 2. Kawakita plots for Okra gum matrix tablet pre-
pared by direct compression and wet granulation.
gum exhibited the highest amount of total plastic defor-
mation and gave the best packing as evidenced by the
low value of “a”.
The mechanical strength of a tablet is associated with
the resistance of the solid specimen to fracturing and
attrition. An acceptable tablet must remain intact at all
stages i.e. during production, packaging, warehousing,
distribution, dispensing and administration by the patient.
Thus, an integrated part of the formulation and produc-
tion of tablets is the determination of their mechanical
strength which are quantifiable by the crushing strength
(CS) and friability (F) of the tablets. There are no clear
official limits for acceptance or rejection of tablet
batches probably because the desired crushing strength is
largely dependent on the intended use of the tablet while
tablets that lose less than 1% of their weight during the
friability test are generally considered acceptable [22].
The values of crushing strength and friability for all for-
mulation are presented in Table 2. The crushing strength
generally decreases with a decrease in the concentration
New Matrix Tablet from Okra Gum: Effects of Method of Preparation and Gum Concentration on Tablet Properties
488
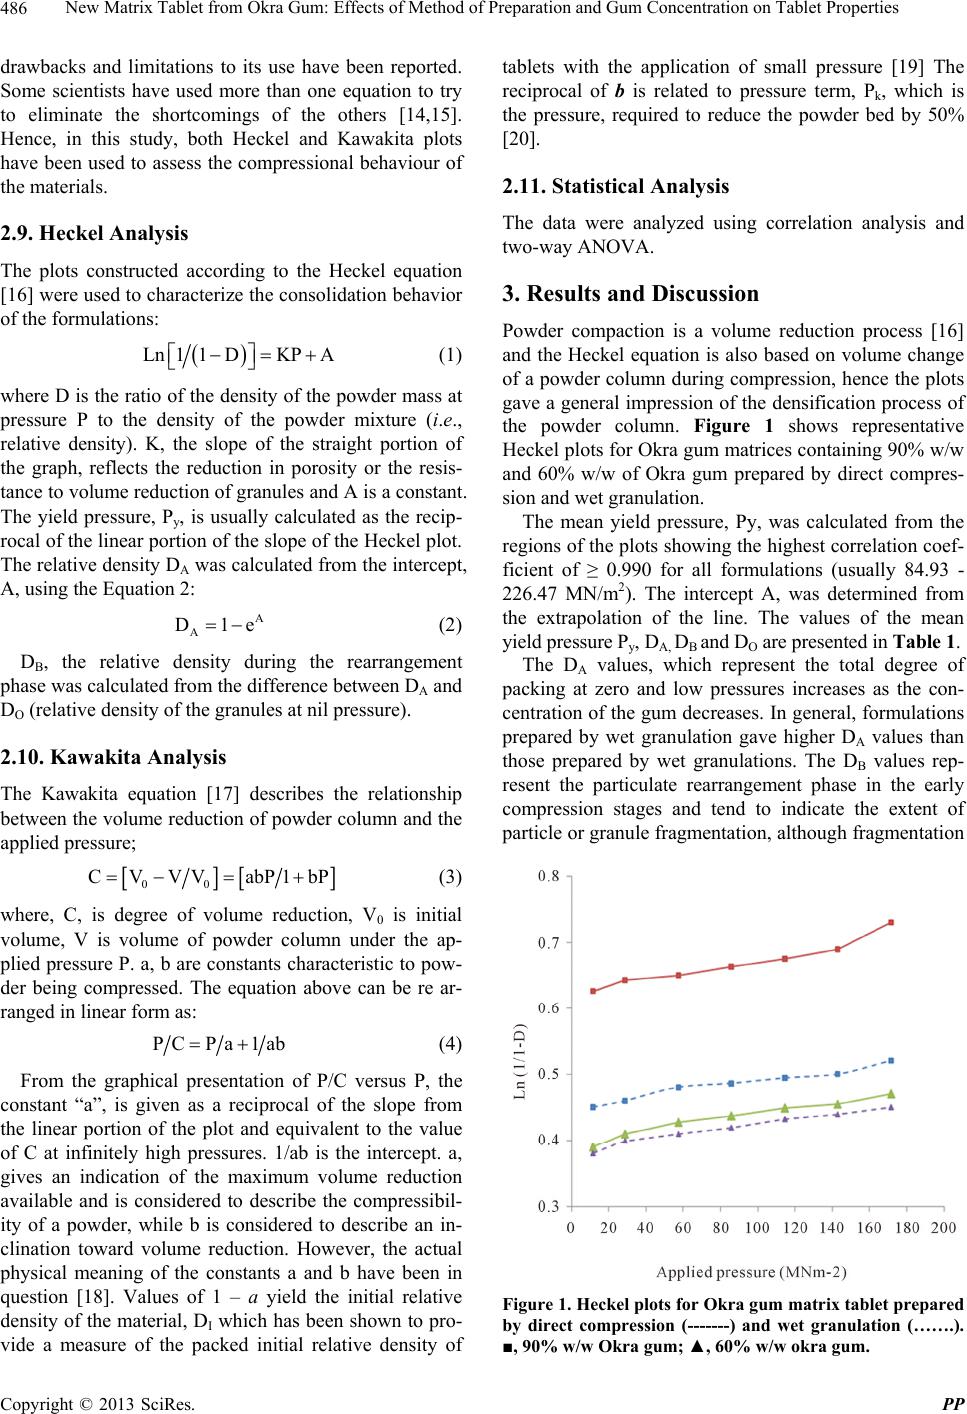
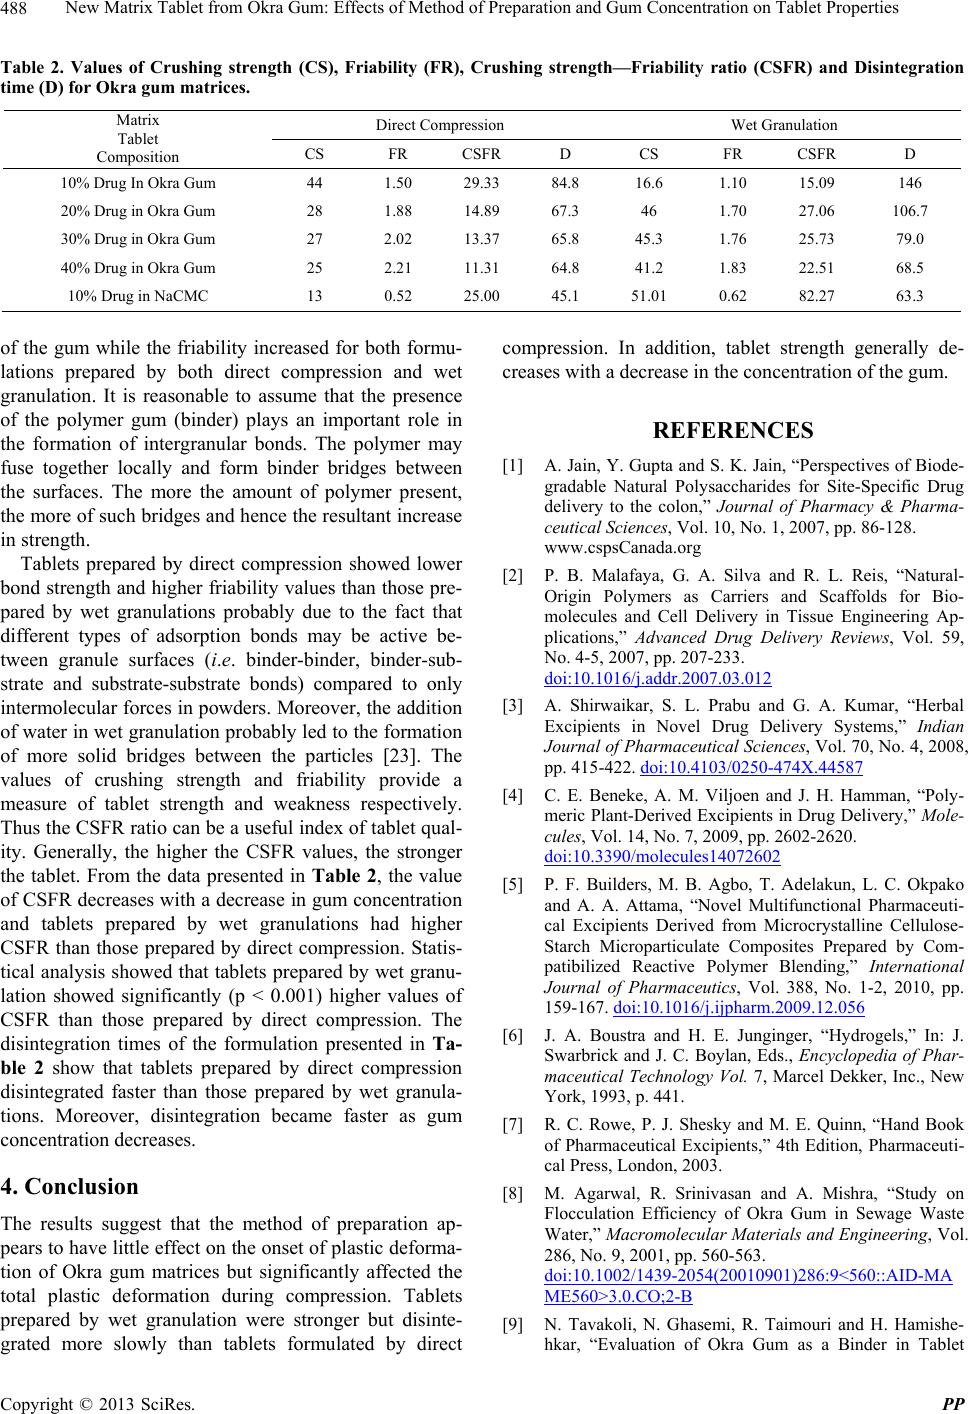
Table 2. Values of Crushing strength (CS), Friability (FR), Crushing strength—Friability ratio (CSFR) and Disintegration
time (D) for Okra gum matrices.
Direct Compression Wet Granulation
Matrix
Tablet
Composition CS FR CSFR D CS FR CSFR D
10% Drug In Okra Gum 44 1.50 29.33 84.8 16.6 1.10 15.09 146
20% Drug in Okra Gum 28 1.88 14.89 67.3 46 1.70 27.06 106.7
30% Drug in Okra Gum 27 2.02 13.37 65.8 45.3 1.76 25.73 79.0
40% Drug in Okra Gum 25 2.21 11.31 64.8 41.2 1.83 22.51 68.5
10% Drug in NaCMC 13 0.52 25.00 45.1 51.01 0.62 82.27 63.3
of the gum while the friability increased for both formu-
lations prepared by both direct compression and wet
granulation. It is reasonable to assume that the presence
of the polymer gum (binder) plays an important role in
the formation of intergranular bonds. The polymer may
fuse together locally and form binder bridges between
the surfaces. The more the amount of polymer present,
the more of such bridges and hence the resultant increase
in strength.
Tablets prepared by direct compression showed lower
bond strength and higher friability values than those pre-
pared by wet granulations probably due to the fact that
different types of adsorption bonds may be active be-
tween granule surfaces (i.e. binder-binder, binder-sub-
strate and substrate-substrate bonds) compared to only
intermolecular forces in powders. Moreover, the addition
of water in wet granulation probably led to the formation
of more solid bridges between the particles [23]. The
values of crushing strength and friability provide a
measure of tablet strength and weakness respectively.
Thus the CSFR ratio can be a useful index of tablet qual-
ity. Generally, the higher the CSFR values, the stronger
the tablet. From the data presented in Table 2, the value
of CSFR decreases with a decrease in gum concentration
and tablets prepared by wet granulations had higher
CSFR than those prepared by direct compression. Statis-
tical analysis showed that tablets prepared by wet granu-
lation showed significantly (p < 0.001) higher values of
CSFR than those prepared by direct compression. The
disintegration times of the formulation presented in Ta-
ble 2 show that tablets prepared by direct compression
disintegrated faster than those prepared by wet granula-
tions. Moreover, disintegration became faster as gum
concentration decreases.
4. Conclusion
The results suggest that the method of preparation ap-
pears to have little effect on the onset of plastic deforma-
tion of Okra gum matrices but significantly affected the
total plastic deformation during compression. Tablets
prepared by wet granulation were stronger but disinte-
grated more slowly than tablets formulated by direct
compression. In addition, tablet strength generally de-
creases with a decrease in the concentration of the gum.
REFERENCES
[1] A. Jain, Y. Gupta and S. K. Jain, “Perspectives of Biode-
gradable Natural Polysaccharides for Site-Specific Drug
delivery to the colon,” Journal of Pharmacy & Pharma-
ceutical Sciences, Vol. 10, No. 1, 2007, pp. 86-128.
www.cspsCanada.org
[2] P. B. Malafaya, G. A. Silva and R. L. Reis, “Natural-
Origin Polymers as Carriers and Scaffolds for Bio-
molecules and Cell Delivery in Tissue Engineering Ap-
plications,” Advanced Drug Delivery Reviews, Vol. 59,
No. 4-5, 2007, pp. 207-233.
doi:10.1016/j.addr.2007.03.012
[3] A. Shirwaikar, S. L. Prabu and G. A. Kumar, “Herbal
Excipients in Novel Drug Delivery Systems,” Indian
Journal of Pharmaceutical Sciences, Vol. 70, No. 4, 2008,
pp. 415-422. doi:10.4103/0250-474X.44587
[4] C. E. Beneke, A. M. Viljoen and J. H. Hamman, “Poly-
meric Plant-Derived Excipients in Drug Delivery,” Mole-
cules, Vol. 14, No. 7, 2009, pp. 2602-2620.
doi:10.3390/molecules14072602
[5] P. F. Builders, M. B. Agbo, T. Adelakun, L. C. Okpako
and A. A. Attama, “Novel Multifunctional Pharmaceuti-
cal Excipients Derived from Microcrystalline Cellulose-
Starch Microparticulate Composites Prepared by Com-
patibilized Reactive Polymer Blending,” International
Journal of Pharmaceutics, Vol. 388, No. 1-2, 2010, pp.
159-167. doi:10.1016/j.ijpharm.2009.12.056
[6] J. A. Boustra and H. E. Junginger, “Hydrogels,” In: J.
Swarbrick and J. C. Boylan, Eds., Encyclopedia of Phar-
maceutical Technology Vol. 7, Marcel Dekker, Inc., New
York, 1993, p. 441.
[7] R. C. Rowe, P. J. Shesky and M. E. Quinn, “Hand Book
of Pharmaceutical Excipients,” 4th Edition, Pharmaceuti-
cal Press, London, 2003.
[8] M. Agarwal, R. Srinivasan and A. Mishra, “Study on
Flocculation Efficiency of Okra Gum in Sewage Waste
Water,” Macromolecular Materials and Engineering, Vol.
286, No. 9, 2001, pp. 560-563.
doi:10.1002/1439-2054(20010901)286:9<560::AID-MA
ME560>3.0.CO;2-B
[9] N. Tavakoli, N. Ghasemi, R. Taimouri and H. Hamishe-
hkar, “Evaluation of Okra Gum as a Binder in Tablet
Copyright © 2013 SciRes. PP
New Matrix Tablet from Okra Gum: Effects of Method of Preparation and Gum Concentration on Tablet Properties 489
Dosage Forms,” Iranian Journal of Pharmaceutical Re-
search, Vol. 3, Suppl. 2, 2004, pp. 47-49.
[10] M.O Emeje, C. Y. Isimi and O. O. Kunle, “Evaluation of
Okra Gum as a Dry Binder in Paracetamol Tablet Formu-
lations,” Continental Journal of Pharmaceutical Sciences,
Vol. 1, 2007, pp. 15-22.
[11] V. D. Kalu, M. A. Odeniyi and K. T. Jaiyeoba, “Matrix
Properties of a New Plant Gum in Controlled Drug De-
livery,” Archives of Pharmacal Research, Vol. 30, No. 7,
2007, pp. 884-889. doi:10.1007/BF02978841
[12] M. M. Talukdar, A. Michoel, P. Rombant and R. Kinget
“Comparative Study on Xanthum Gum and Hydroxypro-
pylmethyl Cellulose as Matrices for Controlled Release
Drug Delivery. I. Compaction and in Vitro Drug Release
Behavior,” International Journal of Pharmaceutics, Vol.
129, No. 1-2, 1996, pp. 233-241.
doi:10.1016/0378-5173(95)04355-1
[13] J. M. Sonnergaard,” A Critical Evaluation of the Heckel
Equation,” International Journal of Pharmaceutics, Vol.
193, No. 1, 1999, pp. 63-71.
doi:10.1016/S0378-5173(99)00319-1
[14] I. Krycer, D. G. Pope and J. A. Hersey, “The Interpreta-
tion of Powder Compaction Data—A Critical Review,”
Drug Development and Industrial Pharmacy, Vol. 8, No.
3, 1982, pp. 307-342. doi:10.3109/03639048209022103
[15] T. Comoglu, “An Overview of Compaction Equations,”
Journal Faculty of Pharmacy, Vol. 36, No. 2, 2007, pp.
123-133.
[16] W. Heckel, “Density-Pressure Relationship in Powder
Compaction,” Transactions of the Metallurgical Society
of AIME, Vol. 221, 1961, pp. 671-675.
[17] K. Kawakita and K. H. Ludde, “Some Considerations on
Powder Compression Equations,” Powder Technology,
Vol. 4, No. 2, 1971, pp. 61-68.
[18] G. Alderborn and C. Nystrom, “Studies on Direct Com-
pression of Tablets. IV. The Effect of Particle Size on the
Mechanical Strength of Tablets,” Acta Pharmaceutica
Suecica, Vol. 19, No. 5, 1982, pp. 381-390.
[19] O. O. Odeku and O. A. Itiola, “Evaluation of Khaya Gum
as a Binder in a Paracetamol Tablet Formulation,” Phar-
macy and Pharmacology Communications, Vol. 4, No. 4,
1998, pp. 183-188.
[20] P. Shivanand and O. L. Sprokel, “Compaction Behaviour
of Cellulose Polymers,” Powder Technology, Vol. 69, No.
2, 1992, pp. 177-184. doi:10.1016/0032-5910(92)85072-4
[21] F. Podczeck and M. Sharma, “The Influence of Particle
Size and Shape of Components of Binary Powder Mix-
tures on the Maximum Volume Reduction Due to Pack-
ing,” International Journal of Pharmaceutics, Vol. 134,
No. 1, 1996, pp. 41-47.
doi:10.1016/0378-5173(95)04420-5
[22] O. O. Odeku and O. A. Itiola, “Evaluation of the Effects
of Khaya Gum on the Mechanical and Release Properties
of Paracetamol Tablets,” Drug Development and Indus-
trial Pharmacy, Vol. 29, No. 3, 2003, pp. 311-320.
doi:10.1081/DDC-120018205
[23] J. Sujja-Areavath, D. L. Munday, P. J. Cox and K. A.
Khan, “Release Characteristics of Diclofenac Sodium
from Encapsulated Natural Gum Mini-Matrix Formula-
tions,” International Journal of Pharmaceutics, Vol. 139,
1996, pp. 53-62. doi:10.1016/0378-5173(96)04573-5
Copyright © 2013 SciRes. PP