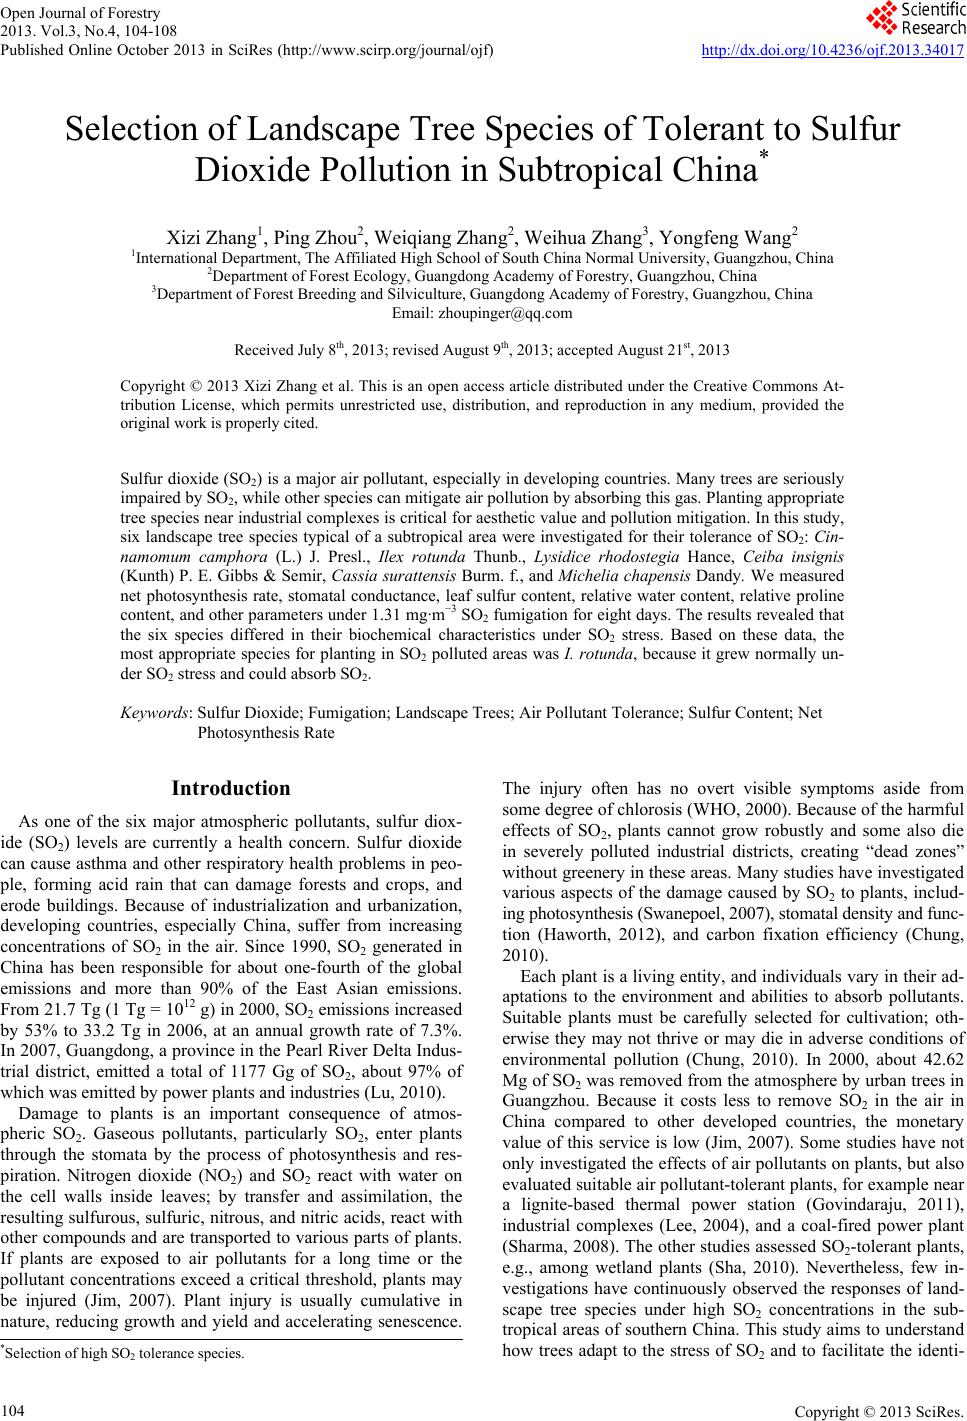
 Open Journal of Forestry 2013. Vol.3, No.4, 104-108 Published Online October 2013 in SciRes (http://www.scirp.org/journal/ojf) http://dx.doi.org/10.4236/ojf.2013.34017 Copyright © 2013 SciRes. 104 Selection of Landscape Tree Species of Tolerant to Sulfur Dioxide Pollution in Subtropical China* Xizi Zhang1, Ping Zhou2, Weiqiang Zhang2, Weihua Zhang3, Yongfeng Wang2 1International Department, The Affiliated High School of South China Normal University, Guangzhou, China 2Department of Forest Ecology, Guangdong Academy of Forestry, Guangzhou, China 3Department of Forest Breeding and Silviculture, Guangdong Academy of Forestry, Guangzhou, China Email: zhoupinger@qq.com Received July 8th, 2013; revised August 9th, 2013; accepted August 21st, 2013 Copyright © 2013 Xizi Zhang et al. This is an open access article distributed under the Creative Commons At- tribution License, which permits unrestricted use, distribution, and reproduction in any medium, provided the original work is properly cited. Sulfur dioxide (SO2) is a major air pollutant, especially in developing countries. Many trees are seriously impaired by SO2, while other species can mitigate air pollution by absorbing this gas. Planting appropriate tree species near industrial complexes is critical for aesthetic value and pollution mitigation. In this study, six landscape tree species typical of a subtropical area were investigated for their tolerance of SO2: Cin- namomum camphora (L.) J. Presl., Ilex rotunda Thunb., Lysidice rhodostegia Hance, Ceiba insignis (Kunth) P. E. Gibbs & Semir, Cassia surattensis Burm. f., and Michelia chapensis Dandy. We measured net photosynthesis rate, stomatal conductance, leaf sulfur content, relative water content, relative proline content, and other parameters under 1.31 mg·m−3 SO2 fumigation for eight days. The results revealed that the six species differed in their biochemical characteristics under SO2 stress. Based on these data, the most appropriate species for planting in SO2 polluted areas was I. rotunda, because it grew normally un- der SO2 stress and could absorb SO2. Keywords: Sulfur Dioxide; Fumigation; Landscape Trees; Air Pollutant Tolerance; Sulfur Content; Net Photosynthesis Rate Introduction As one of the six major atmospheric pollutants, sulfur diox- ide (SO2) levels are currently a health concern. Sulfur dioxide can cause asthma and other respiratory health problems in peo- ple, forming acid rain that can damage forests and crops, and erode buildings. Because of industrialization and urbanization, developing countries, especially China, suffer from increasing concentrations of SO2 in the air. Since 1990, SO2 generated in China has been responsible for about one-fourth of the global emissions and more than 90% of the East Asian emissions. From 21.7 Tg (1 Tg = 1012 g) in 2000, SO2 emissions increased by 53% to 33.2 Tg in 2006, at an annual growth rate of 7.3%. In 2007, Guangdong, a province in the Pearl River Delta Indus- trial district, emitted a total of 1177 Gg of SO2, about 97% of which was emitted by power plants and industries (Lu, 2010). Damage to plants is an important consequence of atmos- pheric SO2. Gaseous pollutants, particularly SO2, enter plants through the stomata by the process of photosynthesis and res- piration. Nitrogen dioxide (NO2) and SO2 react with water on the cell walls inside leaves; by transfer and assimilation, the resulting sulfurous, sulfuric, nitrous, and nitric acids, react with other compounds and are transported to various parts of plants. If plants are exposed to air pollutants for a long time or the pollutant concentrations exceed a critical threshold, plants may be injured (Jim, 2007). Plant injury is usually cumulative in nature, reducing growth and yield and accelerating senescence. The injury often has no overt visible symptoms aside from some degree of chlorosis (WHO, 2000). Because of the harmful effects of SO2, plants cannot grow robustly and some also die in severely polluted industrial districts, creating “dead zones” without greenery in these areas. Many studies have investigated various aspects of the damage caused by SO2 to plants, includ- ing photosynthesis (Swanepoel, 2007), stomatal density and func- tion (Haworth, 2012), and carbon fixation efficiency (Chung, 2010). Each plant is a living entity, and individuals vary in their ad- aptations to the environment and abilities to absorb pollutants. Suitable plants must be carefully selected for cultivation; oth- erwise they may not thrive or may die in adverse conditions of environmental pollution (Chung, 2010). In 2000, about 42.62 Mg of SO2 was removed from the atmosphere by urban trees in Guangzhou. Because it costs less to remove SO2 in the air in China compared to other developed countries, the monetary value of this service is low (Jim, 2007). Some studies have not only investigated the effects of air pollutants on plants, but also evaluated suitable air pollutant-tolerant plants, for example near a lignite-based thermal power station (Govindaraju, 2011), industrial complexes (Lee, 2004), and a coal-fired power plant (Sharma, 2008). The other studies assessed SO2-tolerant plants, e.g., among wetland plants (Sha, 2010). Nevertheless, few in- vestigations have continuously observed the responses of land- scape tree species under high SO2 concentrations in the sub- tropical areas of southern China. This study aims to understand how trees adapt to the stress of SO2 and to facilitate the identi- *Selection of high SO2 tolerance species. 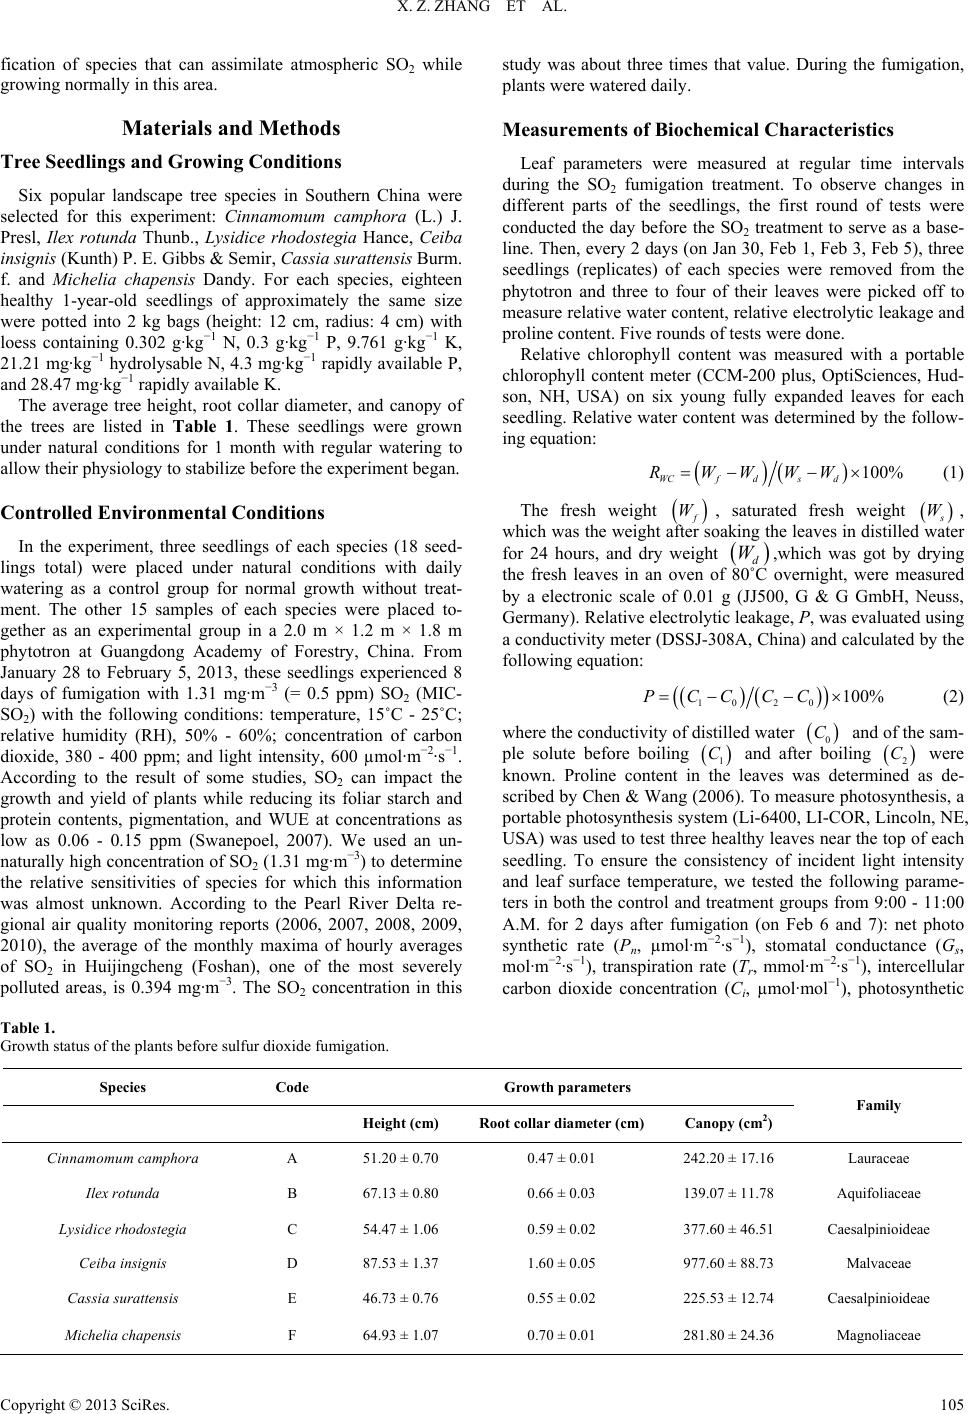 X. Z. ZHANG ET AL. fication of species that can assimilate atmospheric SO2 while growing normally in this area. Materials and Methods Tree Seedlings and Growing Conditions Six popular landscape tree species in Southern China were selected for this experiment: Cinnamomum camphora (L.) J. Presl, Ilex rotunda Thunb., Lysidice rhodostegia Hance, Ceiba insignis (Kunth) P. E. Gibbs & Semir, Cassia surattensis Burm. f. and Michelia chapensis Dandy. For each species, eighteen healthy 1-year-old seedlings of approximately the same size were potted into 2 kg bags (height: 12 cm, radius: 4 cm) with loess containing 0.302 g·kg−1 N, 0.3 g·kg−1 P, 9.761 g·kg−1 K, 21.21 mg·kg−1 hydrolysable N, 4.3 mg·kg−1 rapidly available P, and 28.47 mg·kg−1 rapidly available K. The average tree height, root collar diameter, and canopy of the trees are listed in Table 1. These seedlings were grown under natural conditions for 1 month with regular watering to allow their physiology to stabilize before the experiment began. Controlled Environmental Conditions In the experiment, three seedlings of each species (18 seed- lings total) were placed under natural conditions with daily watering as a control group for normal growth without treat- ment. The other 15 samples of each species were placed to- gether as an experimental group in a 2.0 m × 1.2 m × 1.8 m phytotron at Guangdong Academy of Forestry, China. From January 28 to February 5, 2013, these seedlings experienced 8 days of fumigation with 1.31 mg·m−3 (= 0.5 ppm) SO2 (MIC- SO2) with the following conditions: temperature, 15˚C - 25˚C; relative humidity (RH), 50% - 60%; concentration of carbon dioxide, 380 - 400 ppm; and light intensity, 600 µmol·m−2·s−1. According to the result of some studies, SO2 can impact the growth and yield of plants while reducing its foliar starch and protein contents, pigmentation, and WUE at concentrations as low as 0.06 - 0.15 ppm (Swanepoel, 2007). We used an un- naturally high concentration of SO2 (1.31 mg·m−3) to determine the relative sensitivities of species for which this information was almost unknown. According to the Pearl River Delta re- gional air quality monitoring reports (2006, 2007, 2008, 2009, 2010), the average of the monthly maxima of hourly averages of SO2 in Huijingcheng (Foshan), one of the most severely polluted areas, is 0.394 mg·m−3. The SO2 concentration in this study was about three times that value. During the fumigation, plants were watered daily. Measurements of Biochemical Characteristics Leaf parameters were measured at regular time intervals during the SO2 fumigation treatment. To observe changes in different parts of the seedlings, the first round of tests were conducted the day before the SO2 treatment to serve as a base- line. Then, every 2 days (on Jan 30, Feb 1, Feb 3, Feb 5), three seedlings (replicates) of each species were removed from the phytotron and three to four of their leaves were picked off to measure relative water content, relative electrolytic leakage and proline content. Five rounds of tests were done. Relative chlorophyll content was measured with a portable chlorophyll content meter (CCM-200 plus, OptiSciences, Hud- son, NH, USA) on six young fully expanded leaves for each seedling. Relative water content was determined by the follow- ing equation: 100% WCfds d RWWWW (1) The fresh weight W, saturated fresh weight W, which was the weight after soaking the leaves in distilled water for 24 hours, and dry weight ,which was got by drying the fresh leaves in an oven of 80˚C overnight, were measured by a electronic scale of 0.01 g (JJ500, G & G GmbH, Neuss, Germany). Relative electrolytic leakage, P, was evaluated using a conductivity meter (DSSJ-308A, China) and calculated by the following equation: d W 10 20100%PCCCC (2) where the conductivity of distilled water and of the sam- ple solute before boiling 0 C 1 C and after boiling 2 C were known. Proline content in the leaves was determined as de- scribed by Chen & Wang (2006). To measure photosynthesis, a portable photosynthesis system (Li-6400, LI-COR, Lincoln, NE, USA) was used to test three healthy leaves near the top of each seedling. To ensure the consistency of incident light intensity and leaf surface temperature, we tested the following parame- ters in both the control and treatment groups from 9:00 - 11:00 A.M. for 2 days after fumigation (on Feb 6 and 7): net photo synthetic rate (Pn, µmol·m−2·s−1), stomatal conductance (Gs, mol·m−2·s−1), transpiration rate (Tr, mmol·m−2·s−1), intercellular carbon dioxide concentration (Ci, µmol·mol−1), photosynthetic Table 1. Growth status of the plants before sulfur dioxide fumigation. Species Code Growth parameters Height (cm) Root collar diameter (cm) Canopy (cm2) Family Cinnamomum camphora A 51.20 ± 0.70 0.47 ± 0.01 242.20 ± 17.16 Lauraceae Ilex rotunda B 67.13 ± 0.80 0.66 ± 0.03 139.07 ± 11.78 Aquifoliaceae Lysidice rhodostegia C 54.47 ± 1.06 0.59 ± 0.02 377.60 ± 46.51 Caesalpinioideae Ceiba insignis D 87.53 ± 1.37 1.60 ± 0.05 977.60 ± 88.73 Malvaceae Cassia surattensis E 46.73 ± 0.76 0.55 ± 0.02 225.53 ± 12.74 Caesalpinioideae Michelia chapensis F 64.93 ± 1.07 0.70 ± 0.01 281.80 ± 24.36 Magnoliaceae Copyright © 2013 SciRes. 105 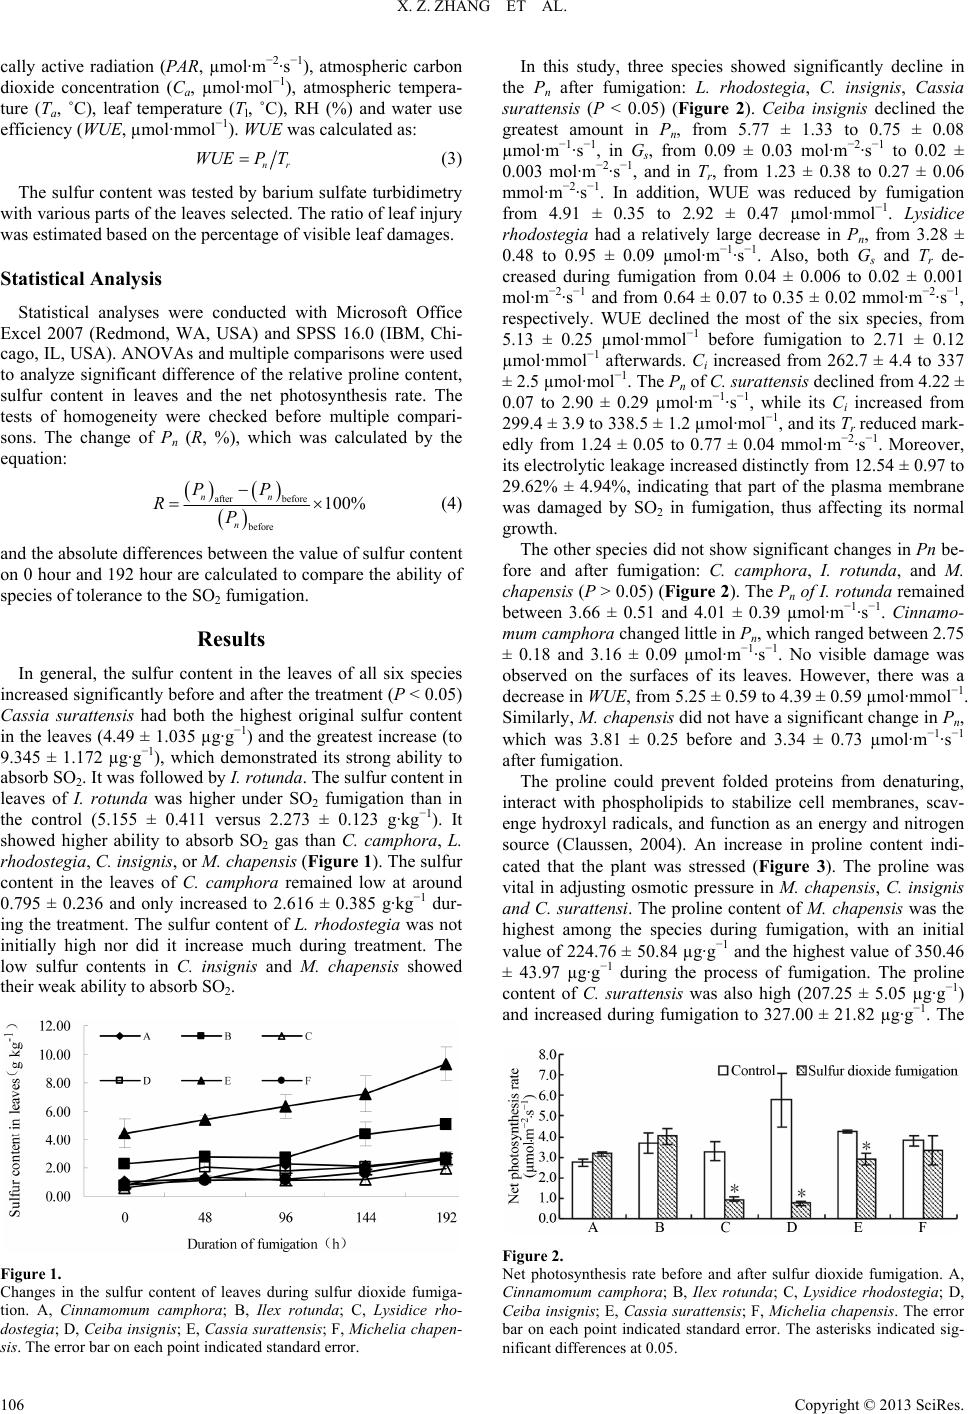 X. Z. ZHANG ET AL. cally active radiation (PAR, µmol·m−2·s−1), atmospheric carbon dioxide concentration (Ca, µmol·mol−1), atmospheric tempera- ture (Ta, ˚C), leaf temperature (Tl, ˚C), RH (%) and water use efficiency (WUE, µmol·mmol−1). WUE was calculated as: nr WUEP T (3) The sulfur content was tested by barium sulfate turbidimetry with various parts of the leaves selected. The ratio of leaf injury was estimated based on the percentage of visible leaf damages. Statistical Analysis Statistical analyses were conducted with Microsoft Office Excel 2007 (Redmond, WA, USA) and SPSS 16.0 (IBM, Chi- cago, IL, USA). ANOVAs and multiple comparisons were used to analyze significant difference of the relative proline content, sulfur content in leaves and the net photosynthesis rate. The tests of homogeneity were checked before multiple compari- sons. The change of Pn (R, %), which was calculated by the equation: after before before 100% nn n PP RP (4) and the absolute differences between the value of sulfur content on 0 hour and 192 hour are calculated to compare the ability of species of tolerance to the SO2 fumigation. Results In general, the sulfur content in the leaves of all six species increased significantly before and after the treatment (P < 0.05) Cassia surattensis had both the highest original sulfur content in the leaves (4.49 ± 1.035 µg·g−1) and the greatest increase (to 9.345 ± 1.172 µg·g−1), which demonstrated its strong ability to absorb SO2. It was followed by I. rotunda. The sulfur content in leaves of I. rotunda was higher under SO2 fumigation than in the control (5.155 ± 0.411 versus 2.273 ± 0.123 g·kg−1). It showed higher ability to absorb SO2 gas than C. camphora, L. rhodostegia, C. insignis, or M. chapensis (Figure 1). The sulfur content in the leaves of C. camphora remained low at around 0.795 ± 0.236 and only increased to 2.616 ± 0.385 g·kg−1 dur- ing the treatment. The sulfur content of L. rhodostegia was not initially high nor did it increase much during treatment. The low sulfur contents in C. insignis and M. chapensis showed their weak ability to absorb SO2. Figure 1. Changes in the sulfur content of leaves during sulfur dioxide fumiga- tion. A, Cinnamomum camphora; B, Ilex rotunda; C, Lysidice rho- dostegia; D, Ceiba insignis; E, Cassia surattensis; F, Michelia chapen- sis In this study, three species showed significantly . The error bar on each point indicated standard error. decline in th her species did not show significant changes in Pn be- fo ld prevent folded proteins from denaturing, in e Pn after fumigation: L. rhodostegia, C. insignis, Cassia surattensis (P < 0.05) (Figure 2). Ceiba insignis declined the greatest amount in Pn, from 5.77 ± 1.33 to 0.75 ± 0.08 µmol·m−1·s−1, in Gs, from 0.09 ± 0.03 mol·m−2·s−1 to 0.02 ± 0.003 mol·m−2·s−1, and in Tr, from 1.23 ± 0.38 to 0.27 ± 0.06 mmol·m−2·s−1. In addition, WUE was reduced by fumigation from 4.91 ± 0.35 to 2.92 ± 0.47 µmol·mmol−1. Lysidice rhodostegia had a relatively large decrease in Pn, from 3.28 ± 0.48 to 0.95 ± 0.09 µmol·m−1·s−1. Also, both Gs and Tr de- creased during fumigation from 0.04 ± 0.006 to 0.02 ± 0.001 mol·m−2·s−1 and from 0.64 ± 0.07 to 0.35 ± 0.02 mmol·m−2·s−1, respectively. WUE declined the most of the six species, from 5.13 ± 0.25 µmol·mmol−1 before fumigation to 2.71 ± 0.12 µmol·mmol−1 afterwards. Ci increased from 262.7 ± 4.4 to 337 ± 2.5 µmol·mol−1. The Pn of C. surattensis declined from 4.22 ± 0.07 to 2.90 ± 0.29 µmol·m−1·s−1, while its Ci increased from 299.4 ± 3.9 to 338.5 ± 1.2 µmol·mol−1, and its Tr reduced mark- edly from 1.24 ± 0.05 to 0.77 ± 0.04 mmol·m−2·s−1. Moreover, its electrolytic leakage increased distinctly from 12.54 ± 0.97 to 29.62% ± 4.94%, indicating that part of the plasma membrane was damaged by SO2 in fumigation, thus affecting its normal growth. The ot re and after fumigation: C. camphora, I. rotunda, and M. chapensis (P > 0.05) (Figure 2). The Pn of I. rotunda remained between 3.66 ± 0.51 and 4.01 ± 0.39 µmol·m−1·s−1. Cinnamo- mum camphora changed little in Pn, which ranged between 2.75 ± 0.18 and 3.16 ± 0.09 µmol·m−1·s−1. No visible damage was observed on the surfaces of its leaves. However, there was a decrease in WUE, from 5.25 ± 0.59 to 4.39 ± 0.59 µmol·mmol−1. Similarly, M. chapensis did not have a significant change in Pn, which was 3.81 ± 0.25 before and 3.34 ± 0.73 µmol·m−1·s−1 after fumigation. The proline cou teract with phospholipids to stabilize cell membranes, scav- enge hydroxyl radicals, and function as an energy and nitrogen source (Claussen, 2004). An increase in proline content indi- cated that the plant was stressed (Figure 3). The proline was vital in adjusting osmotic pressure in M. chapensis, C. insignis and C. surattensi. The proline content of M. chapensis was the highest among the species during fumigation, with an initial value of 224.76 ± 50.84 µg·g−1 and the highest value of 350.46 ± 43.97 µg·g−1 during the process of fumigation. The proline content of C. surattensis was also high (207.25 ± 5.05 µg·g−1) and increased during fumigation to 327.00 ± 21.82 µg·g−1. The Figure 2. ynthesis rate before and after sulfur dioxide fumigation. A, nificant differences at 0.05. Net photos Cinnamomum camphora; B, Ilex rotunda; C, Lysidice rhodostegia; D, Ceiba insignis; E, Cassia surattensis; F, Michelia chapensis. The error bar on each point indicated standard error. The asterisks indicated sig- Copyright © 2013 SciRes. 106 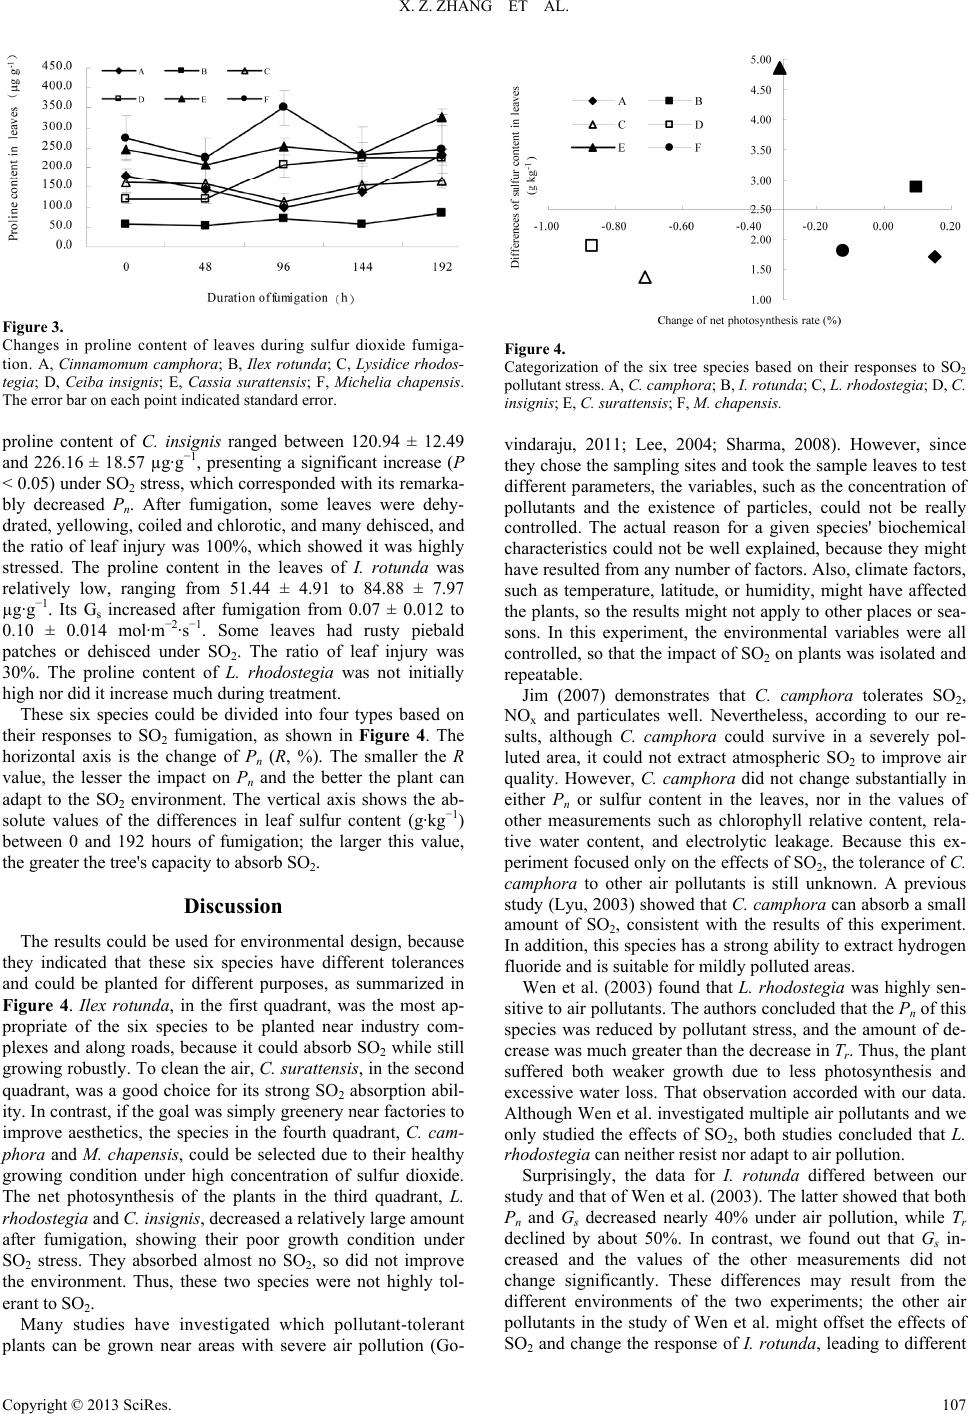 X. Z. ZHANG ET AL. Figure 3. Changes in proline content of leaves during sulfur dioxide fumiga nnamomum camphora; B, Ilex rotunda; C, Lysidice rhodos- 20.94 ± 12.49 −1 The results could be umental design, because the rown near areas with severe air pollution (Go- - tion. A, Ci tegia; D, Ceiba insignis; E, Cassia surattensis; F, Michelia chapensis. The error bar on each point indicated standard error. proline content of C. insignis ranged between 1 and 226.16 ± 18.57 µg·g, presenting a significant increase (P < 0.05) under SO2 stress, which corresponded with its remarka- bly decreased Pn. After fumigation, some leaves were dehy- drated, yellowing, coiled and chlorotic, and many dehisced, and the ratio of leaf injury was 100%, which showed it was highly stressed. The proline content in the leaves of I. rotunda was relatively low, ranging from 51.44 ± 4.91 to 84.88 ± 7.97 µg·g−1. Its Gs increased after fumigation from 0.07 ± 0.012 to 0.10 ± 0.014 mol·m−2·s−1. Some leaves had rusty piebald patches or dehisced under SO2. The ratio of leaf injury was 30%. The proline content of L. rhodostegia was not initially high nor did it increase much during treatment. These six species could be divided into four types based on their responses to SO fumigation, as shown in 2Figure 4. The horizontal axis is the change of Pn (R, %). The smaller the R value, the lesser the impact on Pn and the better the plant can adapt to the SO2 environment. The vertical axis shows the ab- solute values of the differences in leaf sulfur content (g·kg−1) between 0 and 192 hours of fumigation; the larger this value, the greater the tree's capacity to absorb SO2. Discussion sed for environ y indicated that these six species have different tolerances and could be planted for different purposes, as summarized in Figure 4. Ilex rotunda, in the first quadrant, was the most ap- propriate of the six species to be planted near industry com- plexes and along roads, because it could absorb SO2 while still growing robustly. To clean the air, C. surattensis, in the second quadrant, was a good choice for its strong SO2 absorption abil- ity. In contrast, if the goal was simply greenery near factories to improve aesthetics, the species in the fourth quadrant, C. cam- phora and M. chapensis, could be selected due to their healthy growing condition under high concentration of sulfur dioxide. The net photosynthesis of the plants in the third quadrant, L. rhodostegia and C. insignis, decreased a relatively large amount after fumigation, showing their poor growth condition under SO2 stress. They absorbed almost no SO2, so did not improve the environment. Thus, these two species were not highly tol- erant to SO2. Many studies have investigated which pollutant-tolerant plants can be g Figure 4. Categorization of the six tree species based on their responses to SO ess. A, C. camphora; B, I. rotunda; C, L. rhodostegi a; D, C. 2008). However, since ey chose the sampling sites and took the sample leaves to test rticulates well. Nevertheless, according to our re- su the P of this sp t both P 2 pollutant str insignis; E, C. surattensis; F, M. chapensis. vindaraju, 2011; Lee, 2004; Sharma, th different parameters, the variables, such as the concentration of pollutants and the existence of particles, could not be really controlled. The actual reason for a given species' biochemical characteristics could not be well explained, because they might have resulted from any number of factors. Also, climate factors, such as temperature, latitude, or humidity, might have affected the plants, so the results might not apply to other places or sea- sons. In this experiment, the environmental variables were all controlled, so that the impact of SO2 on plants was isolated and repeatable. Jim (2007) demonstrates that C. camphora tolerates SO2, NOx and pa lts, although C. camphora could survive in a severely pol- luted area, it could not extract atmospheric SO2 to improve air quality. However, C. camphora did not change substantially in either Pn or sulfur content in the leaves, nor in the values of other measurements such as chlorophyll relative content, rela- tive water content, and electrolytic leakage. Because this ex- periment focused only on the effects of SO2, the tolerance of C. camphora to other air pollutants is still unknown. A previous study (Lyu, 2003) showed that C. camphora can absorb a small amount of SO2, consistent with the results of this experiment. In addition, this species has a strong ability to extract hydrogen fluoride and is suitable for mildly polluted areas. Wen et al. (2003) found that L. rhodostegia was highly sen- sitive to air pollutants. The authors concluded that n ecies was reduced by pollutant stress, and the amount of de- crease was much greater than the decrease in Tr. Thus, the plant suffered both weaker growth due to less photosynthesis and excessive water loss. That observation accorded with our data. Although Wen et al. investigated multiple air pollutants and we only studied the effects of SO2, both studies concluded that L. rhodostegia can neither resist nor adapt to air pollution. Surprisingly, the data for I. rotunda differed between our study and that of Wen et al. (2003). The latter showed tha n and Gs decreased nearly 40% under air pollution, while Tr declined by about 50%. In contrast, we found out that Gs in- creased and the values of the other measurements did not change significantly. These differences may result from the different environments of the two experiments; the other air pollutants in the study of Wen et al. might offset the effects of SO2 and change the response of I. rotunda, leading to different Copyright © 2013 SciRes. 107  X. Z. ZHANG ET AL. Copyright © 2013 SciRes. 108 areas according to our results, it should receive more att In this study, the perfommon landscape tree species under SO fumied to help select trees fo ts This study was the Guangdong Forestry Science n Project (2010 K NCES Chen, J. X., & Wang, Xeffects of stress on the free proline content iogical experiment ma- C results. Because I. rotunda was the most suitable species for SO2 polluted ention to fully elucidate the mechanisms by which it adapts to SO2 stress. We believe that other species with similar behav- ioral responses can be found and planted to mitigate air pollu- tion. In addition, more parameters of C. camphora can be tested in order to further understand the adaptation of it under sulfur dioxide. This species remains poorly understood because most of the data did not change significantly or show obvious trends in this experiment. Therefore, future experiments must be con- ducted to investigate the effects on plants of other air pollutants, individually and in combination, to permit the selection of the optimal species for severely polluted regions. To fully under- stand how plants change under pollution stress, more parame- ters should be evaluated, including stomatal density, chloro- phyll fluorescence, and carbon fixation efficiency. To identify more air pollution tolerant plants, other common subtropical species, which were also mentioned in Wen et al. (2003), like Ficus microcarpa, Camellia japonica L., and Tutcheria spect- abilis (Benth.) Dunn, can also be tested. Conclusion ormance of six c igation was stud 2 r greenbelts near industrial complexes in subtropical area, especially where SO2 is the main emission. Ilex rotunda, which remained green and extracted a great amount of SO2, is rec- ommended as a key species for greenbelts. Cassia surattensis can be used to improve air quality in polluted areas. Both C. camphora and M. chapensis are also recommended for planting in severely polluted areas because of their high aesthetic values. From an economic and management perspective, L. rhodoste- gia and C. insignis are more suitable for cleaner, less-polluted environments. Integrating different tree species into a landscape can both contribute to greenery near factories and maintain biodiversity. As more studies are conducted on the appropriate species to grow in heavily industrial areas, the problem of air pollution can be effectively controlled. Acknowledgemen supported by funding from and Technology Innovatio JCX012-01) and the Guangzhou Science and Technology Project (2012Y2-00011), China. REFERE . F. (2006). Ch. 29: The n plants. In Phytophysiol nual (2nd ed., pp. 66-67). Guangzhou: South China University Tech- nology Press. hung, Y. C., Chung, P. L., & Liao, S. W. (2010). Carbon fixation ef- ficiency of plants influenced by sulfur dioxide. Environmental Mo- nitoring and Assessment, 173, 701-707. http://dx.doi.org/10.1007/s10661-010-1416-5 laussen, W. (2004). Proline as a measure of stress in tomato plants. Plant Science, 168, 241-248. C http://dx.doi.org/10.1016/j.plantsci.2004.07.039 ovindaraju, M., Ganeshkumar, R. S., MuthukumGaran, V. R., & Vis- G Ging Centre & Ging Centre & Ging Centre & Ging Centre & H., & McEl- 6/j.revpalbo.2012.06.006 vanathan, P. (2011). Identification and evaluation of air-pollution- tolerant plants around lignite-based thermal power station for green- belt development. Environmental Science and P ollut ion Research. uangdong Provincial Environmental Protection Monitoring Centre & Environmental Protection Department, HKSAR (2006). Pearl river delta regional air quality monitoring network: A report of monitor- ing results in 2006. Report numbers: PRDAIR-2006-2. uangdong Provincial Environmental Protection Monitor Environmental Protection Department, HKSAR (2007). Pearl river delta regional air quality monitoring network: A report of monitor- ing results in 2007. Report numbers: PRDAIR-2007-2. uangdong Provincial Environmental Protection Monitor Environmental Protection Department, HKSAR (2008). Pearl river delta regional air quality monitoring network: A report of monitor- ing results in 2008. Report numbers: PRDAIR-2008-2. uangdong Provincial Environmental Protection Monitor Environmental Protection Department, HKSAR (2009). Pearl river delta regional air quality monitoring network: A report of monitor- ing results in 2009. Report numbers: PRDAIR-2009-2. uangdong Provincial Environmental Protection Monitor Environmental Protection Department, HKSAR (2010). Pearl river delta regional air quality monitoring network: A report of monitor- ing results in 2010. Report numbers: PRDAIR-2010-2. aworth, M., Kingston, C. E., Gallagher, A., Fitzgerald, A wain, J. C. (2012). Sulphur dioxide fumigation effects on stomatal density and index of non-resistant plants: Implications for the sto- matal palaeo-[CO2] proxy method. Review of Palaeobotany and Pa- lynology, 182, 44-54. http://dx.doi.org/10.101 Jiosystem service of 35 m, C. Y., & Chen, W. Y. (2007). Assessing the ec air pollutant removal by urban trees in Guangzhou (China). Journal of Environmental Management, 88, 665-676. http://dx.doi.org/10.1016/j.jenvman.2007.03.0 L Kim, J. H. (2004). /10.1023/B:WATE.0000036815.93745.46 ee, C. S., Lee, K. S., Hwangbo, J. K., You, Y. H., & Selection of tolerant plants and their arrangement to restore a forest ecosystem damaged by air pollution. Water, Air, and Soil Pollution, 156, 251-273. http://dx.doi.org L., Cheng, u, Z., Streets, D. G., Zhang, Q., Wang, S., Carmichael, G. R Y. F., Wei, C., Chin, M., Diehl, T., & Tan, Q. (2010). Sulfur dioxide emissions in China and sulfur trends in East Asia since 2000. At- mospheric Chemistry and Physics, 10, 6311-6331. http://dx.doi.org/10.5194/acp-10-6311-2010 yu, H. Q. & Liu, F. P. (2003). A review Lof phytoremediation to S2010). Relative sensitivity of wet- chemical air pollution and plant species selection for greening. Sub- tropical Plant Science, 32, 73-77. ha C. Y., Wang, T. H., & Lu, J. J. ( land plants to SO2 pollution. Wetlands, 30, 1023-1030. http://dx.doi.org/10.1007/s13157-010-0095-x harma, A. P., & Tripathi, B. D. (2008) BiochemSical responses in tree foliage exposed to coal-fired power plant emission in seasonally dry tropical environment. Environmental Monitoring and Assessment, 158, 197-212. http://dx.doi.org/10.1007/s10661-008-0573-2 wanepoel, J. W., Krüger, G. H. J., Heerden, & van P. D. RS. (2007) Effects of sulphur dioxide on photosynthesis in the succulent Augea capensis Thunb. Journal o f Arid Environments, 70, 208-221. http://dx.doi.org/10.1016/j.jaridenv.2006.12.014 en, D. Z., Lu, Y. D., Kuang, Y. W., Hu, X. C., ZhWang, D. Q., Xue, K. Wice for Europe (2000). Ch. 10: N., & Kong, G. H. (2003). Ecophysiological responses and sensitiv- ity of 39 woody species exposed to air pollution. Journal of Tropical and Subtropical Botany, 11, 341-347. orld Health Organization Regional Off Effects of sulfur dioxide on vegetation: Critical levels. In Air quality guidelines (2nd ed.). Copenhagen: WHO Regional Publications.
|