C.-Uk KIM, G. LIM 593
choose two different industries in the United States, Ag-
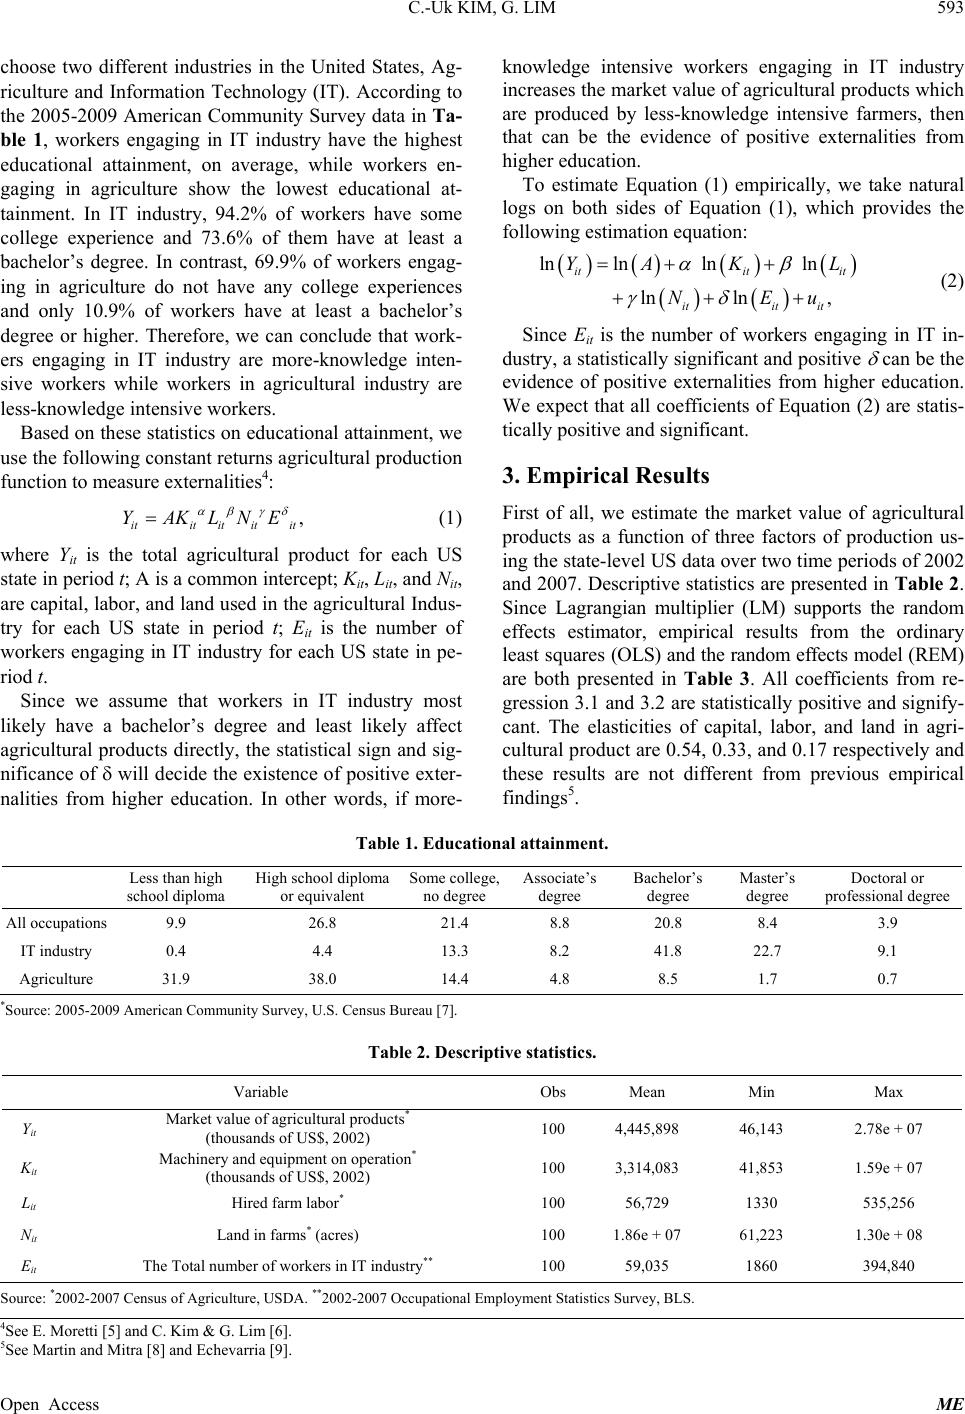
riculture and Information Technology (IT). According to
the 2005-2009 American Community Survey d ata in Ta-
ble 1, workers engaging in IT industry have the highest
educational attainment, on average, while workers en-
gaging in agriculture show the lowest educational at-
tainment. In IT industry, 94.2% of workers have some
college experience and 73.6% of them have at least a
bachelor’s degree. In contrast, 69.9% of workers engag-
ing in agriculture do not have any college experiences
and only 10.9% of workers have at least a bachelor’s
degree or higher. Therefore, we can conclude that work-
ers engaging in IT industry are more-knowledge inten-
sive workers while workers in agricultural industry are
less-knowledge intensive workers.
Open Access ME
Based on these statistics on educational attain ment, we
use the following constant returns agricultural production
function to measure externalities4:
,
itit ititit
YAKLNE
(1)
where Yit is the total agricultural product for each US
state in period t; A is a common intercept; Kit, Lit, and Nit,
are capital, labor, and land u sed in the agricultu ral Indus-
try for each US state in period t; Eit is the number of
workers engaging in IT industry for each US state in pe-
riod t.
Since we assume that workers in IT industry most
likely have a bachelor’s degree and least likely affect
agricultural products directly, the statistical sign and sig-
nificance of will decide the existence of positive exter-
nalities from higher education. In other words, if more-
knowledge intensive workers engaging in IT industry
increases the market value of agricultural products which
are produced by less-knowledge intensive farmers, then
that can be the evidence of positive externalities from
higher education.
To estimate Equation (1) empirically, we take natural
logs on both sides of Equation (1), which provides the
following estimation equation:
lnln ln ln
ln ln,
itit it
itit it
YA K
NEu
L
(2)
Since Eit is the number of workers engaging in IT in-
dustry, a statistically significant and positive
can be the
evidence of positive externalities from higher education.
We expect that all coefficients of Equation (2) are statis-
tically positive and significant.
3. Empirical Results
First of all, we estimate the market value of agricultural
products as a function of three factors of production us-
ing the state-level US data over two time periods of 2002
and 2007. Descriptiv e statistics are presented in Table 2 .
Since Lagrangian multiplier (LM) supports the random
effects estimator, empirical results from the ordinary
lea st s qu ares (OLS) and the random effects model (REM)
are both presented in Table 3. All coefficients from re-
gression 3.1 and 3.2 are statistically positive and signify-
cant. The elasticities of capital, labor, and land in agri-
cultural product are 0. 54, 0.33, and 0.17 respectively and
these results are not different from previous empirical
findings5.
Table 1. Educational attainment.
Less than high
school diploma High school diploma
or equivalent Some college,
no degree Associate’s
degree Bachelor’s
degree Master’s
degree Doctoral or
professional degree
All occupations 9.9 26.8 21.4 8.8 20.8 8.4 3.9
IT industry 0.4 4.4 13.3 8.2 41.8 22.7 9.1
Agriculture 31.9 38.0 14.4 4.8 8.5 1.7 0.7
*Source: 2005-2009 American Community Survey, U.S. Censu s Bureau [7].
Table 2. Descriptive statistics.
Variable Obs Mean Min Max
Yit Market value of agricultural products*
(thousands of US$, 2002) 100 4,445,898 46,143 2.78e + 07
Kit Machinery and equipment on operation*
(thousands of US$, 2002) 100 3,314,083 41,853 1.59e + 07
Lit Hired farm labor* 100 56,729 1330 535,256
Nit Land in farms* (acres) 100 1.86e + 07 61,223 1.30e + 08
Eit The Total number of workers in IT industry** 100 59,035 1860 394,840
Source: *2002-2007 Census of A griculture, USDA. **2002-2007 Occupational Employment Statistics Survey, BLS.
4See E. Moretti [5] and C. Kim & G. Lim [6].
5See Martin and Mitra [8] and Ec hevarria [9].