Modern Economy, 2013, 4, 569-575
http://dx.doi.org/10.4236/me.2013.49060 Published Online September 2013 (http://www.scirp.org/journal/me)
O
pen Access ME
Modeling the Customer Satisfaction Influence on the Long
Term Sales: Example with Leading OTC Analgesics
INN on National Market
Guenka Petrova1, Nikolay Mateev1, Dimitar Barumov1, Lily Peikova2,
Maria Dimitrova1, Manoela Manova1
1Faculty of Pharmacy, Department of Organization and Economics of Pharmacy, Medical University of Sofia, Sofia, Bulgaria
2Faculty of Pharmacy, Department of Pharmaceutical Chemistry, Medical University of Sofia, Sofia, Bulgaria
Email: guenka.petrova@gmail.com
Received July 9, 2013; revised August 7, 2013; accepted August 13, 2013
Copyright © 2013 Guenka Petrova et al. This is an open access article distributed under the Creative Commons Attribution License,
which permits unrestricted use, distribution, and reproduction in any medium, provided the original work is properly cited.
ABSTRACT
Background: The customer satisfaction models are used to examine brand loyalty and sales. The utilization of the
counter medicines depends directly on the level of knowledge of consumers, preferences and their satisfaction could be
considered as an important predictor for their revenue. Objectives: The goal of the current study is to develop a Markov
model for assessing the influence of the customer satisfaction on long term sales of leading OTC international nonpro-
prietary names (INNs) of analgesics on the national market. Methods: Two first-order stationary Markov models based
on marketing data for OTC analgesics sales and customer satisfaction inquiry, particularly from metamizole (MET),
paracetamol (PAR), acetysal (ASA), and ibuprofen (IBU) were created and manipulated. The first model considered the
very satisfied customers and the second the very satisfied and the somewhat satisfied customers. Results: MET is the
INN with the most loyal customers followed by PAR. The product Markov matrix was derived after multiplications of
the matrixes with market share and loyal customers’ probabilities. The steady state is achieved after 17 years for the
group of satisfied customers and after 40 iterations for the group of somewhat satisfied. The market fluctuations are
more dynamic in the second model probably due to lower determination of customers purchasing behavior. Conclusions:
The model allows prediction of the long term changes in sales, differences between the groups of customers and long
term marketing fluctuations. It could be useful in companies’ strategic sales management.
Keywords: OTC Analgesics; Marketing; Customer Satisfaction; Markov Model
1. Introduction
Customer satisfaction is a broad marketing concept ap-
plied towards the companies, products, services, and
even relationships [1,2]. Studies of the customer satisfac-
tion are trying to explain the factors that influence it, to
range those factors according to their way of impact,
measure the satisfaction and follow its relation with
brand loyalty [2-5]. The customer satisfaction models are
used for analytical purposes to explain its multi factorial
structure [6-8].
Modeling the long term satisfaction is a key aspect for
market sales and revenue forecasts [9,10]. Pharmaceuti-
cal studies provide numerous examples of research using
theories and methodologies to predict outcomes by quan-
tifying individuals’ behavior according to their personal
preferences [11-14].
Over the counter medicines (OTC) are groups of
brands with well-established safety and efficacy used to
treat self-recognizing and self-limiting symptoms [15].
The latter concerns in a great extend the OTC analgesics
most of which have been launched since centuries on the
market, like acetysal [16]. Anatomical Therapeutic Che-
mical Classification (ATC) of medicines includes four
main groups of OTC analgesics: salicylic acid derivatives
with main representative acetysal (acetyl-salicylic acid);
pyrazolones with main representative metamizol; anilides
with main representative paracetamol [17]. Recently
some antirheumatic medicines, like ibuprofen, have been
applied as OTC analgesics as well.
OTC medicines are not an object of physician pre-
scription and their utilization depends directly on the
level of knowledge of consumers, past experience, estab-
lished preferences and satisfaction of the consumers.
G. PETROVA ET AL.
570
Open Access ME
Therefore studying the influence of the customer satis-
faction on the sales of OTC analgesics is important to
predict their revenue. As there are no studies that create
models based on the customer satisfaction and exploring
its influence in the long term sales of OTC analgesics,
this raised our interest on the topic.
Objective and Research Hypotheses
The goal of the current study is to develop a Markov
model for assessing the influence of the customer satis-
faction on long term sales of leading OTC international
nonproprietary names (INNs) of analgesics on the na-
tional market.
The following research hypotheses have been tested:
1) The Markov model is suitable for the evaluation of
the influence of customer satisfaction on the long
term sales of OTC analgesics.
2) Customer satisfaction leads to differences in long
term sales of the OTC medicines.
2. Theoretical Background
Areas such as pharmaceuticals, health management, so-
cial support and patient outcomes all are areas to apply
the assumptions and techniques of modeling in order to
understand how relationships with others surrounding
areas are influenced or what is the impact of health on
them [18]. One of the major cornerstones of creating and
using a Markov models to appraise the brand switching is
the work of Ehrenberg [10]. The author stated that the
Markov brand switching models aims to present the re-
peat buying and brand switching behavior. In the exam-
ple discussed by Ehrenberg the goal of the Markov chain
analysis is twofold. From one side it must provide a
convenient and effective way of handling a variable and
complex data, while from the other side it is suitable for
studying the interrelationships. In the marketing Markov
chains model is frequently used to explore the topics
such as “brand loyalty” and “brand switching dynamics”
[19,20]. Loyalty towards a product is defined as prob-
ability at time “t” the product to be purchased by the
same customer. The persistence of the loyalty indicators
towards a product shows the future purchasing behavior
of the loyal customer.
Following the proposal of Draper and Nolin and the
work of Ehrenberg we choose the first order stationary
Markov type of model, which is recommended in the
marketing literature [10,21]. Similar to that proposal is
the work of Pfeifer and Carraway using the Markov
model to explore the customer relationships and calculate
the life time value of the customers [22]. The life time
value of the customers is important concept in marketing
pointing out at the importance of gaining and retaining
customers [23-25]. The graphical view of the model cre-
ated by Pfeifer and Carraway is close to that we created
for our investigation. Both models belong to Markov
chain models, which are considered appropriate for mod-
eling customer relationships and calculate the life time
value. Several authors consider as advantage of these
models their flexibility, complexity in handling both the
customers’ migration and retention [26,27]. The models
could be applied at customers’ level and at products’
level [28].
The life time value is a concept close to customer sa-
tisfaction because satisfied customers are of the long
term value for the producers because of their brand loy-
alty. There are numerous studies pointing out the impor-
tance of the customer satisfaction for the companies and
especially in the general sales forecasting [29-31]. Cus-
tomer satisfaction is defined as “the number of customers,
or percentage of total customers, whose reported experi-
ence with a company, its products, or its services (ratings)
exceeds specified satisfaction goals” [1]. The customer
satisfaction is measured by interviewing customers to
define their level of satisfaction usually in 5-point Likert
scale varying among very dissatisfied and very satisfied
[32]. We used this concept in our research and applied it
towards the customers which were buying the products
of interest at the moment of their purchase.
The choice of OTC analgesics was based on the fact
that they are a group of medicines with long standing
usage and their sales depend on the customer preferences
rather than on the physicians’ recommendations. Over
110 years ago Hoffman isolated aspirin, the first non-
steroidal anti-inflammatory medicinal product [33]. Cur-
rently there are over 50 different medicinal products with
anti-inflammatory, analgesic and antipyretic activity,
most of them are with OTC status all over the world.
Nonsteroidal anti-inflammatory medicines, including
aspirin, are now among the most widely prescribed me-
dicinal products in the world [34]. Acetylsalicylic acid
(shortly acetysal or ASA) was synthesized one hundred
years ago, and was produced under the commercial name
of “Aspirin” by the German company Bayer for the
treatment of fever and rheumatism [35]. In 1971, Vane
discovered the mechanism by which aspirin exerts its
anti-inflammatory, analgesic and antipyretic actions. He
proved that aspirin and other non-steroid anti-inflame-
matory medicines inhibit the activity of the cyclooxy-
genase, which leads to the formation of prostaglandins
[36]. The analgesic effect has mostly peripheral mecha-
nism.
Metamizole was first synthesized by the company
Hoechst AG in 1920. It remained available worldwide
until the 1970s, when several national medical authorities
withdrew metamizole from the market or restricted it to
be available only with a prescription, due to the fact that
may cause agranulocytosis, although it remains available
G. PETROVA ET AL. 571
over the counter in many other countries [37,38].
Many non-steroidal anti-inflammatory medicines
(NSAID) are available on the market, but aspirin and
ibuprofen are the most used without a prescription. It is
estimated that 20% - 30% of Americans use NSAID each
year, and 1% - 2% use NSAIDs every day [39]. Eighty-
five percent of all analgesics are available without a pre-
scription and as a group they have one of the highest
market shares [40]. Ibuprofen was derived from pro-
panoic acid by the research arm of Boots Group during
the 1960s and patented in 1961 [41]. Ibuprofen is a non-
selective COX inhibitor and its antipyretic and anti-in-
flammatory activity is mainly through inhibition of
COX-2 [42].
Paracetamol is not considered an NSAID because it
does not exhibit significant anti-inflammatory activity (it
is a weak COX inhibitor) [43]. Paracetamol was first
marketed in the United States in 1953 by Sterling-Win-
throp Co although was discovered in 1877 [44].
In general studies of the satisfaction from the OTC
medicines are very limited [45]. They are suitable for our
research due to their long standing usage that allows long
term forecasting and the possibility of customers to
choose the product themselves based on their past ex-
perience.
3. Methodology
This study was developed following several study steps.
During the first step information about the sales and
market share of four leading OTC analgesics INNs on the
national market-metamizole, paracetamol, acetyl-sali-
cylic acid, and ibuprofen (MET, PAR, ASA and IBU)
was collected. The information for the sales and market
share was collected from the website of the Bulgarian
Drug Agency (BDA) and from the officially published
International Medical Statistics reviews during one year
period [46]. Both datasets were compared for consistency
and average value was considered as final market sales
value and share. Only the mono products, containing one
active substance were selected for the study. Combina-
tions and pediatric dosage forms were excluded, as well
as the low dose acetyl-salicylic acid tablets used as anti-
platelet agent.
From the website of the Ministry of health officially
published information about the maximal retail prices of
all brands of mono products containing the INNs of in-
terest and the average price per INN was derived [47].
Within one month period on a random basis 300 indi-
viduals were questioned, who were buying OTC analge-
sics of interest from the pharmacies to state their general
satisfaction from the products in 5-point Likert scale
(very dissatisfied; somewhat dissatisfied; neither satisfied,
not dissatisfied; somewhat satisfied; very satisfied).
Based on both datasets the two first-order stationary
Markov models were created and manipulated (Figure 1)
[10]. The first model considered that the very satisfied
customers are the loyal ones that will always buy the
same INN and the rest are equally distributed during the
year between the other INNs. Those were considered as
switchers. In the second model the very satisfied and the
somewhat satisfied customers were considered as loyal
and the rest were considered as switchers that are equally
distributed among the other INNs.
The initial state matrix for the model is a row vector
with probabilities derived from the market share values
of the four OTC INNs of analgesics as shown with for-
mula (1):
Formula (1) [PMET; PPAR; PASA; PIBU]
For the first model a 4 (n × n) matrix was created,
where the main diagonal comprises of the probabilities
derived from the relative share of the very satisfied cus-
tomers for every OTC INN. In this model we suppose
that there is a probability for the rest part of the custom-
ers to switch to another INN during their following pur-
chases. We assume that this probability is equal for all
INNs. Thus the rest probabilities were derived as shown
with formula 2.
Formula 2: “pswitchers = (1 ployal customers)/3”.
For the second model different 4 (n × n) matrix was
created where the main diagonal comprises of the prob-
abilities derived from the relative share of the sum of
very satisfied and somewhat satisfied customers. Those
were considered as “somewhat loyal” customers, who are
expected to prefer the same INN. The other probabilities
were derived as in the first model following Formula 2.
By multiplying the initial matrix with that of the loyal
customers’ matrix was calculated the expected probabili-
ties of customers to remain loyal till the moment of
steady state. The same way was calculated the probabili-
ties of “somewhat loyal” customers.
The expected long term sales of the OTC analgesics’
INN were calculated for both groups of customers-the
loyal ones and “somewhat loyal” ones by multiplying the
Markov probabilities with the initial sales values of every
INN in the beginning of the observation. The length of
the Markov chain was determined to be one year.
Figure 1. The first-order stationary Markov model for OTC
sales and loyalty.
Open Access ME
G. PETROVA ET AL.
Open Access ME
572
4. Results mulative long term value.
The initial matrix with the probabilities derived from the
market shares of the four INNs is shown on Table 1.
Market shares are nationally determined and are results
of long standing traditions where the metamizole as na-
tionally produced is the OTC analgesics leader, followed
by the acetyl-salicylic acid probably as the product with
longest history of utilization within the group.
5. Discussion
To our knowledge this is the first Markov model built on
the basis of the customer satisfaction data for OTC anal-
gesics and their market share. It is based on official in-
formation for analgesics national market and prices and
thus it is trying to present the reality as much as possible.
Although is complicated to transform medicines utilize-
tion problems into mathematical equations Markov chain
The loyal customers correspond to the relative share of
the individuals who were very satisfied by the particular
INN (Table 2). Logically determined by the historical
market situation MET is the INN with most loyal cus-
tomers followed by PAR. If all other customers switch to
any one of the other INNs on an equal basis the other
probabilities will vary as is calculated on Table 2 . On the
main diagonal are the probabilities of the very satisfied
customer considered as loyal ones.
The product Markov matrix derived after several mul-
tiplications of the matrices in Tables 1 and 2 is presented
on Ta ble 3. The steady state is achieved after 17 periods,
meaning that under the given assumptions after 17 years
the market shares will became unchanged for all analge-
sics.
Figure 2. Graphical view of the Markov chain for loyal cus-
tomers.
Figure 2 represents the range of the probabilities in-
cluding the steady state period for the loyal customers. In
spite of the fact that the steady state is achieved after 17
iterations, the intensive market changes are observed till
the 6th iteration.
Table 1. Initial matrix for both models.
Probabilities in the state zero
(year of observation)
Metamizole (MET) 0.415
Paracetamol (PAR) 0.185
Ibuprofen (IBU) 0.197
Acetysal (ASA) 0.203
The probability matrix of “somewhat satisfied” and
“very satisfied” customers is shown on Table 4, where it
is evident that metamizole again is the leader, and ibu-
profen is the second one ranged product.
In this second model the steady state is achieved after
40 iterations (Figure 3, Table 5).
The market fluctuations are more dynamic in com- pa-
rison with the first model as evident from Figure 3. It
could be supposed that the customers are not so defini-
tive in their purchasing behavior.
Table 2. Probabilities of loyal customers.
MET PAR IBU ASA
Methamizole 0.292 0.243 0.257 0.264
paracetamol 0.236
0.271 0.257 0.264
Ibuprofen 0.236 0.243
0.229 0.264
Acetysal 0.236 0.243 0.257
0.208
The market made from loyal and loyal plus somewhat
loyal customers differs in term of their length and value
predictability (Figure 4). Logically the sales to loyal
customers are with smaller cumulative value and for the
shorter period, while the sales to loyal and somewhat
loyal customers are for the longer period and higher cu-
Table 3. Markov chain probabilities for the loyal customers.
S1 S2 S3 S4 S5 S5 S7 S17 S18
MET 0.270356 0.265568 0.263412 0.264196 0.264 0.264581 0.264365- 0.264311 0.264311
PAR 0.252296 0.255824 0.257392 0.257 0.2566080.256505 0.256657- 0.256697 0.256697
IBU 0.2416 0.242608 0.243 0.243392 0.241824 0.242676 0.242701- 0.242714 0.242714
ASA 0.235748 0.236 0.236196 0.235412 0.237568 0.236239 0.236278 - 0.236278 0.236278
G. PETROVA ET AL. 573
appears to be powerful technique to predict the long term
market share and in forecasting the influence of the cus-
tomer satisfaction on the sales of a product INN. On the
other side it is a demonstrative tool with possibility for
application in marketing management and decision mak-
ing [48].
The performed study shows that the first-order sta-
tionary Markov models could be successfully used to
Figure 3. Graphical view of the Markov chain for loyal and
somewhat loyal customers.
Figure 4. Market value and length predictability.
Table 4. Markov probabilities for the fully and partly loyal
customers.
MET PAR IBU ASA
Metamizole 0.652 0.143 0.107 0.181
Paracetamol 0.116 0.571 0.107 0.181
Ibuprofen 0.116 0.143
0.679 0.180
Acetysal 0.116 0.143 0.107
0.458
Open Access ME
analyze the influence of the customer satisfaction on the
long term sales of OTC analgesics. The latter is evident
from the differences in the dynamics and necessary time
to reach the steady state in the two formulated models. In
the case of very satisfied customers the time to steady
state is shorter than might be explained with the fact that
customers are loyal to the particular brand and their pur-
chasing behavior is very stable. In contrast the model
formulated with the probabilities of very satisfied and
somewhat satisfied customers is reaching the steady state
after three times more iterations. It is also characterized
with lots of fluctuations in almost two third of the years
that might be considered as not so stable customer be-
havior.
The differences in the both models let to the different
long term sales of the observed OTC analgesics that
prove our second research hypothesis. Lots of research-
ers pointed out that the customer satisfaction is a key for
market success of the products that is also evident from
our results [49]. As heterogeneous are the groups in
terms of their satisfaction as unstable are the sales values
and necessary time to reach the steady state. The model
with the very satisfied customers is smooth with limited
fluctuations than the model with very satisfied and
somewhat satisfied customers probably due to the het-
erogeneity of the group.
The current study possesses some limitations. The first
is the fact that interventions on the market were not per-
formed and the changes after such an intervention were
not measured. This might be considered as strength of
the study because the attempt was to measure the real life
as it is without any particular influence on the sales.
For some the one year length might be too long period
but OTC analgesics have seasonal utilization and if we
measure short term periods we have to comply with the
seasonal differences. The seasonal differences are not a
valuable indicator for the long term sales. Never mind
that the OTC analgesics are with long standing tradition
of utilization their sales are not stable and are influenced
by lots of other factors, as well as by customer satisfac-
tion.
The third limitation might be considered the fact that
only two models were created with the very satisfied and
somewhat satisfied customers in addition to the first one
model. Theoretically and practically all models are pos-
Table 5. Markov probabilities for the loyal and somewhat customers.
S1 S2 S3 S4 S5 S5 S7 S39 S40
MET 0.354857 0.4751 0.216073 0.1770850.2460530.3219750.383914- 0.283869 0.28526
PAR 0.211597 0.1752760.383813 0.1655290.2265050.2223350.204278- 0.229459 0.229323
IBU 0.244898 0.1918640.221078 0.5080140.2515390.2716640.238849- 0.305112 0.30386
ASA 0.188648 0.15776 0.179036 0.1493720.2759030.1840270.17296 - 0.18156 0.181557
G. PETROVA ET AL.
574
Open Access ME
sible in combination with the other three possibilities as
neither satisfied nor dissatisfied etc., but we consider
them as relatively indifferent for this study that might not
add new evidences.
6. Conclusion
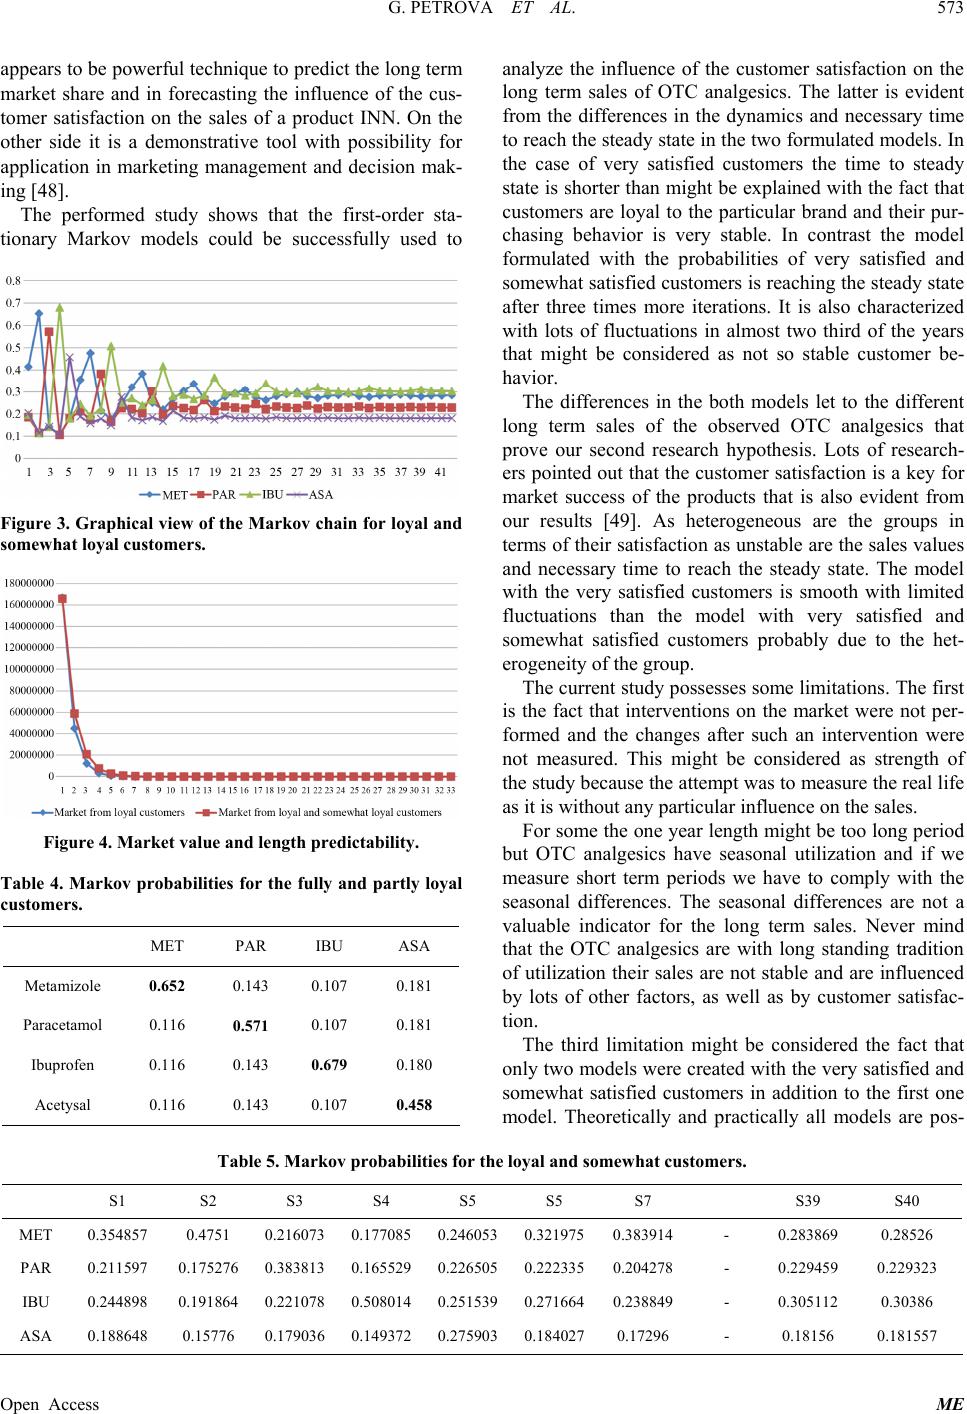
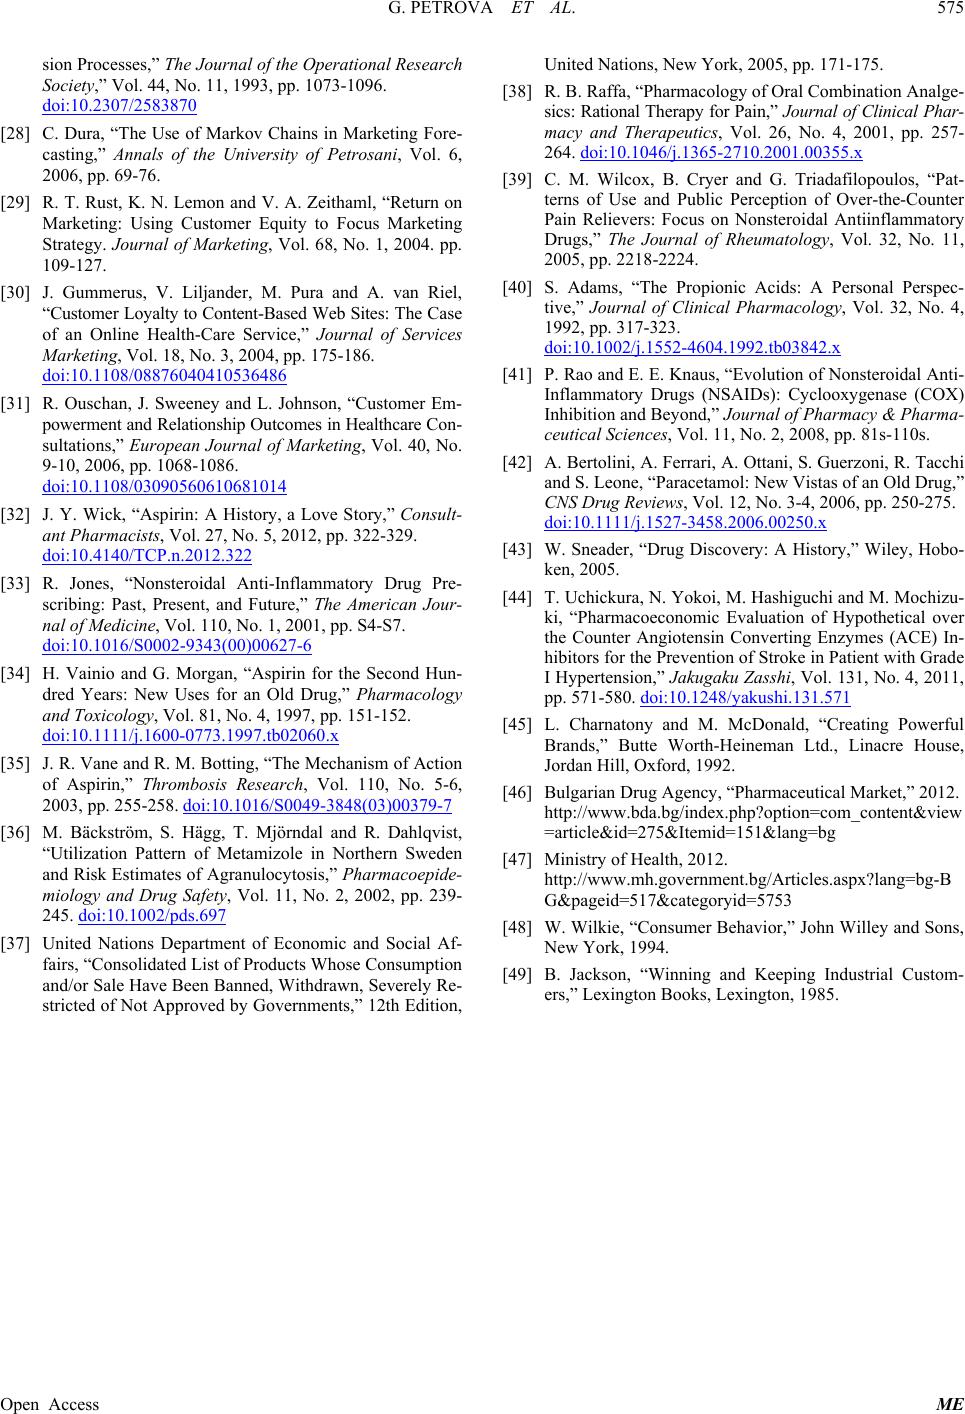
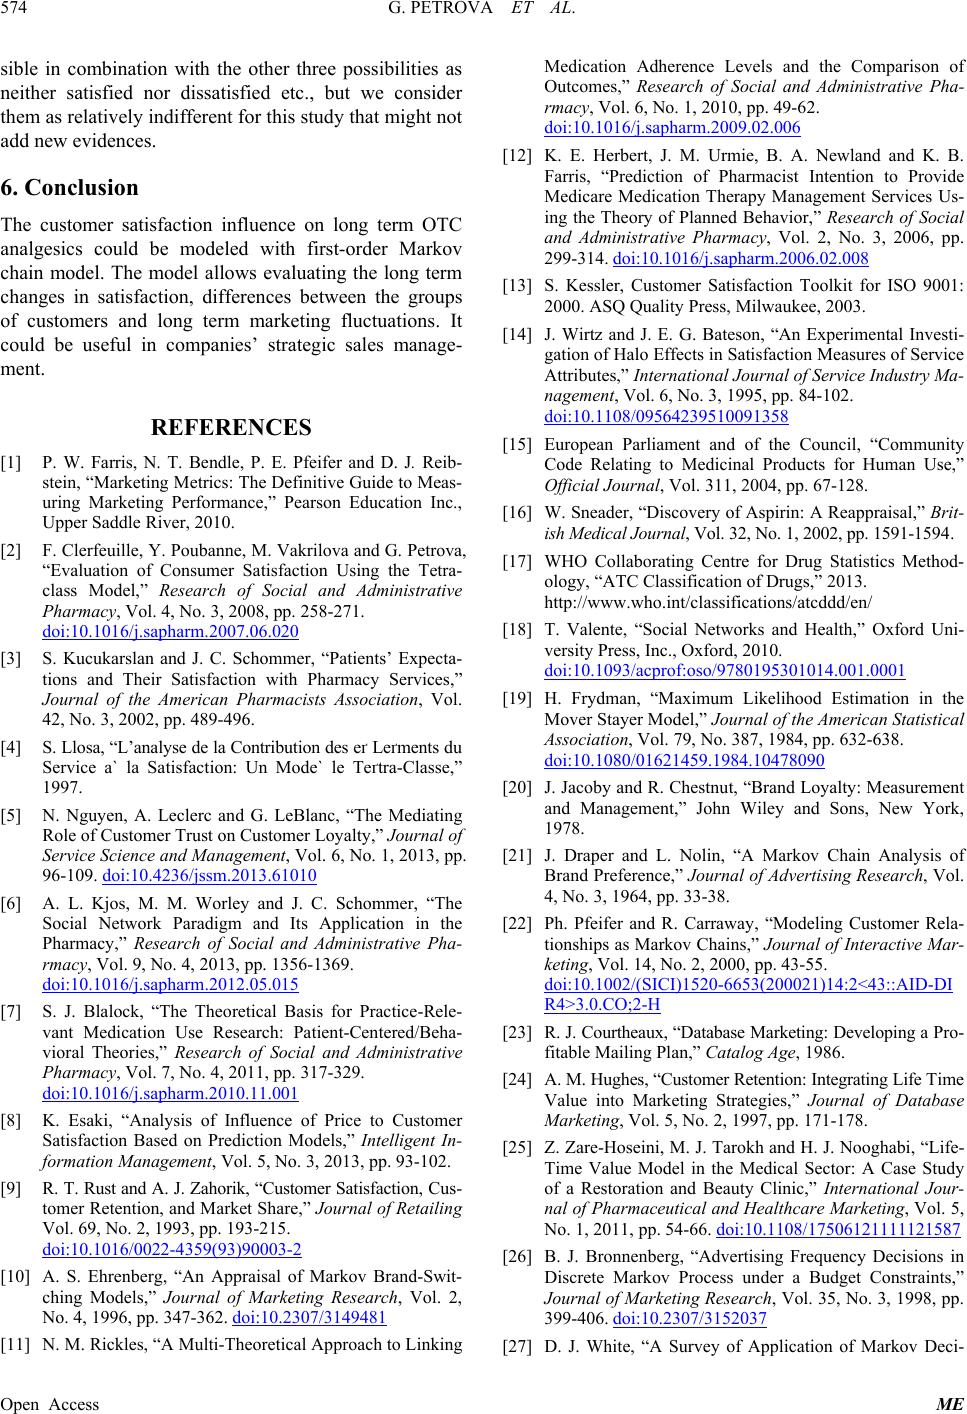
The customer satisfaction influence on long term OTC
analgesics could be modeled with first-order Markov
chain model. The model allows evaluating the long term
changes in satisfaction, differences between the groups
of customers and long term marketing fluctuations. It
could be useful in companies’ strategic sales manage-
ment.
REFERENCES
[1] P. W. Farris, N. T. Bendle, P. E. Pfeifer and D. J. Reib-
stein, “Marketing Metrics: The Definitive Guide to Meas-
uring Marketing Performance,” Pearson Education Inc.,
Upper Saddle River, 2010.
[2] F. Clerfeuille, Y. Poubanne, M. Vakrilova and G. Petrova,
“Evaluation of Consumer Satisfaction Using the Tetra-
class Model,” Research of Social and Administrative
Pharmacy, Vol. 4, No. 3, 2008, pp. 258-271.
doi:10.1016/j.sapharm.2007.06.020
[3] S. Kucukarslan and J. C. Schommer, “Patients’ Expecta-
tions and Their Satisfaction with Pharmacy Services,”
Journal of the American Pharmacists Association, Vol.
42, No. 3, 2002, pp. 489-496.
[4] S. Llosa, “L’analyse de la Contribution des eґ Leґments du
Service a` la Satisfaction: Un Mode` le Teґtra-Classe,”
1997.
[5] N. Nguyen, A. Leclerc and G. LeBlanc, “The Mediating
Role of Customer Trust on Customer Loyalty,” Journal of
Service Science and Management, Vol. 6, No. 1, 2013, pp.
96-109. doi:10.4236/jssm.2013.61010
[6] A. L. Kjos, M. M. Worley and J. C. Schommer, “The
Social Network Paradigm and Its Application in the
Pharmacy,” Research of Social and Administrative Pha-
rmacy, Vol. 9, No. 4, 2013, pp. 1356-1369.
doi:10.1016/j.sapharm.2012.05.015
[7] S. J. Blalock, “The Theoretical Basis for Practice-Rele-
vant Medication Use Research: Patient-Centered/Beha-
vioral Theories,” Research of Social and Administrative
Pharmacy, Vol. 7, No. 4, 2011, pp. 317-329.
doi:10.1016/j.sapharm.2010.11.001
[8] K. Esaki, “Analysis of Influence of Price to Customer
Satisfaction Based on Prediction Models,” Intelligent In-
formation Management, Vol. 5, No. 3, 2013, pp. 93-102.
[9] R. T. Rust and A. J. Zahorik, “Customer Satisfaction, Cus-
tomer Retention, and Market Share,” Journal of Retailing
Vol. 69, No. 2, 1993, pp. 193-215.
doi:10.1016/0022-4359(93)90003-2
[10] A. S. Ehrenberg, “An Appraisal of Markov Brand-Swit-
ching Models,” Journal of Marketing Research, Vol. 2,
No. 4, 1996, pp. 347-362. doi:10.2307/3149481
[11] N. M. Rickles, “A Multi-Theoretical Approach to Linking
Medication Adherence Levels and the Comparison of
Outcomes,” Research of Social and Administrative Pha-
rmacy, Vol. 6, No. 1, 2010, pp. 49-62.
doi:10.1016/j.sapharm.2009.02.006
[12] K. E. Herbert, J. M. Urmie, B. A. Newland and K. B.
Farris, “Prediction of Pharmacist Intention to Provide
Medicare Medication Therapy Management Services Us-
ing the Theory of Planned Behavior,” Research of Social
and Administrative Pharmacy, Vol. 2, No. 3, 2006, pp.
299-314. doi:10.1016/j.sapharm.2006.02.008
[13] S. Kessler, Customer Satisfaction Toolkit for ISO 9001:
2000. ASQ Quality Press, Milwaukee, 2003.
[14] J. Wirtz and J. E. G. Bateson, “An Experimental Investi-
gation of Halo Effects in Satisfaction Measures of Service
Attributes,” International Journal of Service Industry Ma-
nagement, Vol. 6, No. 3, 1995, pp. 84-102.
doi:10.1108/09564239510091358
[15] European Parliament and of the Council, “Community
Code Relating to Medicinal Products for Human Use,”
Official Journal, Vol. 311, 2004, pp. 67-128.
[16] W. Sneader, “Discovery of Aspirin: A Reappraisal,” Brit-
ish Medical Journal, Vol. 32, No. 1, 2002, pp. 1591-1594.
[17] WHO Collaborating Centre for Drug Statistics Method-
ology, “ATC Classification of Drugs,” 2013.
http://www.who.int/classifications/atcddd/en/
[18] T. Valente, “Social Networks and Health,” Oxford Uni-
versity Press, Inc., Oxford, 2010.
doi:10.1093/acprof:oso/9780195301014.001.0001
[19] H. Frydman, “Maximum Likelihood Estimation in the
Mover Stayer Model,” Journal of the American Statistical
Association, Vol. 79, No. 387, 1984, pp. 632-638.
doi:10.1080/01621459.1984.10478090
[20] J. Jacoby and R. Chestnut, “Brand Loyalty: Measurement
and Management,” John Wiley and Sons, New York,
1978.
[21] J. Draper and L. Nolin, “A Markov Chain Analysis of
Brand Preference,” Journal of Advertising Research, Vol.
4, No. 3, 1964, pp. 33-38.
[22] Ph. Pfeifer and R. Carraway, “Modeling Customer Rela-
tionships as Markov Chains,” Journal of Interactive Mar-
keting, Vol. 14, No. 2, 2000, pp. 43-55.
doi:10.1002/(SICI)1520-6653(200021)14:2<43::AID-DI
R4>3.0.CO;2-H
[23] R. J. Courtheaux, “Database Marketing: Developing a Pro-
fitable Mailing Plan,” Catalog Age, 1986.
[24] A. M. Hughes, “Customer Retention: Integrating Life Time
Value into Marketing Strategies,” Journal of Database
Marketing, Vol. 5, No. 2, 1997, pp. 171-178.
[25] Z. Zare-Hoseini, M. J. Tarokh and H. J. Nooghabi, “Life-
Time Value Model in the Medical Sector: A Case Study
of a Restoration and Beauty Clinic,” International Jour-
nal of Pharmaceutical and Healthcare Marketing, Vol. 5,
No. 1, 2011, pp. 54-66. doi:10.1108/17506121111121587
[26] B. J. Bronnenberg, “Advertising Frequency Decisions in
Discrete Markov Process under a Budget Constraints,”
Journal of Marketing Research, Vol. 35, No. 3, 1998, pp.
399-406. doi:10.2307/3152037
[27] D. J. White, “A Survey of Application of Markov Deci-
G. PETROVA ET AL. 575
Open Access ME
sion Processes,” The Journal of the Operational Research
Society,” Vol. 44, No. 11, 1993, pp. 1073-1096.
doi:10.2307/2583870
[28] C. Dura, “The Use of Markov Chains in Marketing Fore-
V. A. Zeithaml, “Return on
rus, V. Liljander, M. Pura and A. van Riel,
casting,” Annals of the University of Petrosani, Vol. 6,
2006, pp. 69-76.
[29] R. T. Rust, K. N. Lemon and
Marketing: Using Customer Equity to Focus Marketing
Strategy. Journal of Marketing, Vol. 68, No. 1, 2004. pp.
109-127.
[30] J. Gumme
“Customer Loyalty to Content-Based Web Sites: The Case
of an Online Health-Care Service,” Journal of Services
Marketing, Vol. 18, No. 3, 2004, pp. 175-186.
doi:10.1108/08876040410536486
[31] R. Ouschan, J. Sweeney and L. Johnson, “Customer Em-
014
powerment and Relationship Outcomes in Healthcare Con-
sultations,” European Journal of Marketing, Vol. 40, No.
9-10, 2006, pp. 1068-1086.
doi:10.1108/03090560610681
Love Story,” Consult- [32] J. Y. Wick, “Aspirin: A History, a
ant Pharmacists, Vol. 27, No. 5, 2012, pp. 322-329.
doi:10.4140/TCP.n.2012.322
[33] R. Jones, “Nonsteroidal Anti-Inflammatory Drug Pre-
scribing: Past, Present, and Future,” The American Jour-
nal of Medicine, Vol. 110, No. 1, 2001, pp. S4-S7.
doi:10.1016/S0002-9343(00)00627-6
[34] H. Vainio and G. Morgan, “Aspirin for the Second Hun-
dred Years: New Uses for an Old Drug,” Pharmacology
and Toxicology, Vol. 81, No. 4, 1997, pp. 151-152.
doi:10.1111/j.1600-0773.1997.tb02060.x
[35] J. R. Vane and R. M. Botting, “The Mechanism of Action
of Aspirin,” Thrombosis Research, Vol. 110, No. 5-6,
2003, pp. 255-258. doi:10.1016/S0049-3848(03)00379-7
[36] M. Bäckström, S. Hägg, T. Mjörndal and R. Dahlqvist,
“Utilization Pattern of Metamizole in Northern Sweden
and Risk Estimates of Agranulocytosis,” Pharmacoepide-
miology and Drug Safety, Vol. 11, No. 2, 2002, pp. 239-
245. doi:10.1002/pds.697
[37] United Nations Department of Economic and Social Af-
fairs, “Consolidated List of Products Whose Consumption
and/or Sale Have Been Banned, Withdrawn, Severely Re-
stricted of Not Approved by Governments,” 12th Edition,
United Nations, New York, 2005, pp. 171-175.
[38] R. B. Raffa, “Pharmacology of Oral Combination Analge-
sics: Rational Therapy for Pain,” Journal of Clinical Phar-
macy and Therapeutics, Vol. 26, No. 4, 2001, pp. 257-
264. doi:10.1046/j.1365-2710.2001.00355.x
[39] C. M. Wilcox, B. Cryer and G. Triadafilopoulos, “Pat-
terns of Use and Public Perception of Over-the-Counter
Pain Relievers: Focus on Nonsteroidal Antiinflammatory
Drugs,” The Journal of Rheumatology, Vol. 32, No. 11,
2005, pp. 2218-2224.
[40] S. Adams, “The Propionic Acids: A Personal Perspec-
tive,” Journal of Clinical Pharmacology, Vol. 32, No. 4,
1992, pp. 317-323.
doi:10.1002/j.1552-4604.1992.tb03842.x
[41] P. Rao and E. E. Knaus, “Evolution of Nonsteroidal Anti-
Inflammatory Drugs (NSAIDs): Cyclooxygenase (COX)
Inhibition and Beyond,” Journal of Pharmacy & Pharma-
ceutical Sciences, Vol. 11, No. 2, 2008, pp. 81s-110s.
[42] A. Bertolini, A. Ferrari, A. Ottani, S. Guerzoni, R. Tacchi
and S. Leone, “Paracetamol: New Vistas of an Old Drug,”
CNS Drug Reviews, Vol. 12, No. 3-4, 2006, pp. 250-275.
doi:10.1111/j.1527-3458.2006.00250.x
[43] W. Sneader, “Drug Discovery: A History,” Wiley, Hobo-
ken, 2005.
[44] T. Uchickura, N. Yokoi, M. Hashiguchi and M. Mochizu-
ki, “Pharmacoeconomic Evaluation of Hypothetical over
the Counter Angiotensin Converting Enzymes (ACE) In-
hibitors for the Prevention of Stroke in Patient with Grade
I Hypertension,” Jakugaku Zasshi, Vol. 131, No. 4, 2011,
pp. 571-580. doi:10.1248/yakushi.131.571
[45] L. Charnatony and M. McDonald, “Creating Powerful
Brands,” Butte Worth-Heineman Ltd., Linacre House,
Jordan Hill, Oxford, 1992.
[46] Bulgarian Drug Agency, “Pharmaceutical Market,” 2012.
http://www.bda.bg/index.php?option=com_content&view
=article&id=275&Itemid=151&lang=bg
[47] Ministry of Health, 2012.
http://www.mh.government.bg/Articles.aspx?lang=bg-B
G&pageid=517&categoryid=5753
[48] W. Wilkie, “Consumer Behavior,” John Willey and Sons,
New York, 1994.
[49] B. Jackson, “Winning and Keeping Industrial Custom-
ers,” Lexington Books, Lexington, 1985.